A HIGH-FAT HIGH-SUCROSE DIET AFFECTS THE LONG-TERM
1
METABOLIC FATE OF GRAPE PROANTHOCYANIDINS IN RATS
2
Eunice Molinar-Toribio1‡, Elisabet Fuguet2, Sara Ramos-Romero1, Núria Taltavull3, 3
Lucía Méndez4, M. Rosa Nogués3, Isabel Medina4, Josep Lluís Torres1, Jara Pérez-4
Jiménez1* 5
6
1
Institute of Advanced Chemistry of Catalonia (IQAC-CSIC), Barcelona, Spain
7
2
Departament de Química Analítica, Universitat de Barcelona, Barcelona, Spain/ Serra-8
Húnter Programme. Generalitat de Catalunya, Barcelona, Spain 9
3
Unidad de Farmacología, Facultad de Medicina y Ciencias de la Salud, Universidad 10
Rovira i Virgili, Reus, Spain 11
4
Instituto de Investigaciones Marinas (IIM-CSIC), Vigo, Spain 12
‡ Present address: Department of Biochemistry, Faculty of Natural, Exact Sciences and 13
Technology, University of Panama, Panama City, Panama 14
15
*
Corresponding author: Jara Pérez-Jiménez. Present address: Department of 16
Metabolism and Nutrition, Institute of Food Science, Technology and Nutrition 17
(ICTAN-CSIC), Jose Antonio Novais 10, 28040, Madrid, Spain. E-mail: 18 [email protected] 19 20 21 22 23
List of abbreviations used 24 EC: (epi)catechin 25 EGC: (epi)gallocatechin 26
Gluc: glucuronyl group 27
GSE: grape seed extract 28
HFHS: high-fat high-sucrose diet 29
Me: methyl group 30
MetS: metabolic syndrome 31
MRM: multiple reaction monitoring 32 MS: mass spectrometry 33 PA: proanthocyanidin 34 STD: standard 35
Sulf: sulfate group 36 37 38 39 40 41 42
Abstract
43
Purpose. Polyphenol metabolites are key mediators of the biological activities of
44
polyphenols. This study aimed to evaluate the long-term effects of a fat high-45
sucrose (HFHS) diet on the metabolism of proanthocyanidins (PAs) from grape seed 46
extract (GSE). 47
Methods. Adult female Wistar Kyoto rats were fed a standard (STD) or HFHS diet
48
supplemented or not with GSE for 16 weeks. PA metabolites were determined by 49
targeted HPLC-MS/MS analysis. 50
Results. A lower concentration of total microbial-derived PA metabolites was present in
51
urine and the aqueous fraction of faeces in the HFHS + GSE group than in the STD + 52
GSE group. In contrast, a tendency towards the formation of conjugated (epi)catechin 53
metabolites in the HFHS + GSE group was observed. 54
Conclusions. These results show that a HFHS diet significantly modifies PA
55
metabolism, probably via: i) a shift in microbial communities not counteracted by the 56
polyphenols themselves; and ii) an up-regulation of hepatic enzymes. 57
Keywords: Polyphenols, proanthocyanidins, high-fat high-sucrose diet, bioavailability,
58 metabolites 59 60 61 62 63
1. Introduction
65
Metabolic syndrome (MetS) is a cluster of risk factors (abdominal obesity, 66
hypertension, hyperglycaemia, hypertriglyceridaemia) that increases the risk of 67
developing type 2 diabetes or cardiovascular diseases [1]. MetS is increasingly 68
becoming a public health problem, affecting some 20%-30% of the population in 69
developed countries [2]. MetS has been shown to result from factors that are common in 70
current Western lifestyles: sedentariness and unhealthy dietary patterns including an 71
excess of fat and simple carbohydrates, i.e., high-fat high-sucrose (HFHS) diets. The 72
metabolic alterations caused by a HFHS dietary pattern have been thoroughly studied in 73
animal models, showing that it triggers insulin resistance, hyperinsulinaemia, 74
hyperlipidaemia, elevated blood pressure, hepatic steatosis and both endothelial-75
dependent and endothelial-independent arterial dysfunction, among other effects [3-5]. 76
HFHS diets have been used in several animal models to evaluate the potential role of 77
different bioactive food compounds in the modulation of MetS; for instance, a HFHS 78
diet has been supplemented with ω-3 polyunsaturated fatty acids of marine origin [6], 79
the iminosugar D-fagomine [7] or with polyphenols [8].
80
Proanthocyanidins (PAs) constitute a class of polyphenols; a broad group of dietary 81
phytochemicals. The members of this class range from dimers to high-molecular-weight 82
polymers of different constituent flavanol units and are notably present in certain 83
foodstuffs such as cocoa, grapes and nuts [9]. In recent years, several studies in animal 84
models have shown that PAs may play a beneficial role in modulating MetS through a 85
combination of mechanisms, i.e., direct inhibition of enzymes involved in the 86
metabolism of carbohydrates, improvement in insulin sensitivity, repression of intestinal 87
lipid absorption, activation of endogenous antioxidant systems and reduction of the 88
overexpression of certain cytokines [10-14]. A key factor in the health effects of 89
polyphenols is their metabolic fate since, once ingested, they are extensively 90
transformed by phase I and phase II enzymes, as well as by the gut microbiota; PA-91
derived metabolites may ultimately be responsible for the biological effects of PAs [15-92
16]. Other components present in the diet, e.g., milk or oil, may affect the 93
bioavailability of polyphenols [17-18]. Other physiological aspects, such as age, do not 94
seem to play a relevant role in the metabolism of PAs [19]. Therefore, to properly 95
ascertain the role of supplemented polyphenols, the effect of the overall diet on the 96
profile and amount of potentially active circulating metabolites must be evaluated. 97
Several studies in animal models have supplemented HFHS diets with different 98
polyphenols in order to determine how they modulate MetS [20-22]. However, the 99
levels of polyphenol-derived metabolites after a HFHS diet were not assessed. Also, the 100
effect of combined supplementation with polyphenols and a probiotic on circulating 101
phenolic metabolites was evaluated in animals fed a HFHS diet [23], but no comparison 102
was provided of the effects of this supplementation on animals fed a standard (STD) 103
diet. 104
Therefore, the aim of this study was to compare the levels of metabolites derived from 105
grape PAs in rats fed a HFHS diet with those in rats fed a STD diet; which may provide 106
useful information for understanding the reported effects of the addition of polyphenols 107
to HFHS diets. 108
2. Materials and methods
109
2.1 Chemicals and reagents 110
The STD diet, Global 2014, and HFHS diet, TD 08811, were from Teklad Global 2014 111
(Harlan Teklad Inc., Indianapolis, IN, USA). Fine Grajfnol® powder 98% (grape seed 112
extract; GSE) from grape seed was from JF-Natural Product (Tianjin, China). 113
According to the manufacturer, this extract contained 95% PAs (UV) of which 60% was 114
B2 procyanidin dimer (HPLC), with a mean degree of polymerization of 2. So the 115
extract contained mainly dimmers, with some amounts of monomers and trimers. Ash 116
content was 1.5% and loss on drying was 5.0%. Porcine gelatin type A 240/260 was 117
from Juncà (Girona, Spain) and soybean lecithin Topcithin 50 from Cargill (Barcelona, 118
Spain). Organic unrefined soybean oil (first cold pressing) was from Clearspring Ltd. 119
(London, UK). 120
Ketamine chlorhydrate was purchased from Merial Laboratorios (Barcelona, Spain) and 121
xylacine from Química Farmacéutica (Barcelona, Spain). Standards of (−)-(epi)catechin 122
(EC) (≥ 98%), (−)-(epi)gallocatechin (EGC) (≥ 95%), 3-hydroxyphenylacetic acid (≥ 123
99%), 4-hydroxyphenylacetic acid (≥ 98%), 3,4-dihydroxyphenylacetic acid (≥ 98%), 3- 124
hydroxybenzoic acid (≥ 99%), 4-hydroxybenzoic acid (≥ 99%), homovanillic acid (≥ 125
98%), vanillic acid (≥ 97%), caffeic acid (≥ 98%), 3,4-dihydroxyphenylpropionic acid 126
(≥ 98%), 3-(4-hydroxyphenyl)propionic acid (≥ 98%), 3,4-dihydroxybenzoic acid (≥ 127
97%), benzoic acid (≥ 99%), hippuric acid (≥ 98%), ferulic acid (≥ 99%), isoferulic acid 128
(≥ 97%), p-coumaric acid (≥ 98%), m-coumaric acid (≥ 98%), gallic acid (≥ 97%), 129
enterodiol (≥ 95%), phenylacetic acid (≥ 99%), taxifolin (≥ 85%), and tert-130
butylhydroquinone and formic acid (analytical grade) were obtained from Sigma 131
Chemical (St Louis, MO, USA). Methanol (analytical grade) and hydrochloric acid (≥ 132
85%) were from Panreac (Castellar del Vallès, Spain). Acetonitrile (HPLC grade) was 133
obtained from Merck (Darmstadt, Germany). Water for the assay solutions was obtained 134
using a Milli-Q water purification system (Millipore Corporation, Billerica, MA, USA). 135
2.2 Animals 136
A total of twenty female Wistar Kyoto (WKY) rats (Janvier, Le Genest-St-Isle, France), 137
aged 8-9 weeks were housed in cages (n = 2-3/cage) with a 12 h light/12 h dark cycle, at 138
22ºC ± 2ºC and a relative humidity of 50% ± 10%. All the procedures adhered strictly to 139
the European Union guidelines for the care and management of laboratory animals, and 140
were approved by the CSIC Bioethical Issues Subcommittee (ref. AGL2009-12 374-141
C03-03). Thus they were performed in accordance with the ethical standards laid down 142
in the 1964 Declaration of Helsinki and its later amendments. 143
2.3 Experimental design 144
The rats were randomly divided into four groups, each (n = 5) fed a different diet: 145
control (STD diet); HFHS diet; STD diet supplemented with GSE (STD + GSE); HFHS 146
diet supplemented with GSE (HFHS + GSE). The animals were given access to feed 147
and water ad libitum. The composition of each diet is provided in Table 1. 148
The diets were prepared in-house and pelletized by lyophilization. To prevent oxidation 149
and contamination by fungi, the dry pellets were vacuum packed and stored at 4ºC until 150
used. To guarantee the proper mixture of the different components and an adequate 151
consistency of the final pellet, soybean lecithin and porcine gelatin were added. tert-152
Butylhydroxiquinone was added as an antioxidant. 153
The animals received water and the pelleted feed for 18 weeks after being randomly 154
assigned to the four dietary groups. Between weeks 14 and 16 of the experiment, the 155
rats were placed in metabolic cages for urine and faeces collection, and deprived of food 156
for 24 h. 157
2.4 Sample processing 158
The biological samples were prepared according to previously described procedures for 159
the extraction of phenolic metabolites [24-26]. On collection, urine samples were 160
acidified with HCl (1 mM, 5 μL) then urine and faeces were frozen in liquid nitrogen 161
and stored at −80ºC. For analysis, the whole urine samples were freeze dried and re-162
suspended in 1 mL of acid water (water acidified to pH 3 with formic acid). Then, 163
taxifolin (100 μL of a 50 ppm solution) was added to each sample as an internal 164
standard, to obtain a final concentration of 5 ppm. The samples were then subjected to 165
solid-phase extraction in Oasis HLB (60 mg) cartridges from Waters Corporation 166
(Mildford, MA, USA). The cartridges were activated with methanol (1 mL) and acid 167
water (2 mL) and the samples loaded. To remove interfering components, the samples 168
were washed with acid water (9 mL) and then the phenolic compounds were eluted with 169
methanol (1 mL). The eluate was evaporated under nitrogen and the residue 170
reconstituted with 500 μL of the initial HPLC mobile phase ([A], see below). The 171
temperature of evaporation was kept under 37ºC to avoid deterioration of the phenolic 172
compounds. The samples were filtered through a polytetrafluoroethylene 0.45 μm 173
membrane from Waters Corp. into amber vials for HPLC-MS/MS analysis. 174
Faeces samples were re-suspended in acid water (1:1 w/w) and homogenized using a 175
vortex. Then, after adding the internal standard (taxifolin, 5 ppm) the mixtures were 176
centrifuged (10000 g, 10 min at 4ºC), and the supernatant was freeze dried and re-177
suspended in 1 mL of acid water and homogenized using a vortex, and later subjected to 178
SPE and the workup process as described for the urine samples. 179
2.5 HPLC-ESI-MS/MS analysis of polyphenol metabolites 180
An Applied Biosystems (PE Sciex, Concord, Ontario, Canada) API 3000 triple 181
quadrupole mass spectrometer with a TurboIon spray source was used in negative mode 182
to obtain MS and MS/MS data, according to procedures described previously [24-26]. 183
Liquid chromatography separations were performed using an Agilent 1100 series liquid 184
chromatograph system (Agilent, Waldbronn, Germany) equipped with a Phenomenex 185
(Torrance, CA, USA) Luna C18 (50 x 2.0 mm i.d.) 3.0 μm particle size column and a 186
Phenomenex Securityguard C18 (4 x 2.0 mm i.d.) column. Gradient elution was 187
performed with a binary system consisting of: [A] 0.1% aqueous formic acid and [B] 188
0.1% formic acid in CH3CN. An increasing linear gradient (v/v) of [B] was used,
189
[t(min), % B]: 0,8; 10,23; 15,50; 20,50; 21,100; followed by a re-equilibration step. 190
Each metabolite in the urine samples was first identified by multiple reaction 191
monitoring (MRM) of the transitions of the putative metabolites using a dwell time of 192
100 ms and then confirmed either by comparison with a standard when available, repeat 193
MRM with a second characteristic transition and posterior comparison of the results 194
with the retention time obtained in the first MRM, or neutral-loss and product ion scan 195
experiments. The cycle time used was 2 s. The list of metabolites to be searched for was 196
compiled from the literature on the bioavailability of grape polyphenols [24-27]. 197
Analyst 1.4.2 software from AB Sciex was used for data acquisition and processing. 198
Calibration curves for each metabolite were plotted using between 4 and 11 standards at 199
different concentrations (ranging from 0.001 to 60 ppm). The concentrations obtained 200
from the calibration curves were further corrected by the internal standard. When no 201
commercial standard was available, the metabolites were quantified using a structurally 202
related compound. The standard may still show a different response from that of the 203
metabolite, so this method cannot be considered to provide proper quantification and 204
should therefore be used mainly for comparative purposes. Details of the MRM 205
transitions used, the conditions of the MS experiments, the standards used and the 206
strategy employed for the identification of each metabolite (comparison with 207
commercial standard or analysis of MS/MS fragmentation pattern) are provided in 208
Table S1.
209
2.6 Statistics 210
Results are expressed as mean concentrations (µM) with standard error of the mean 211
(SEM). Also, to facilitate comparisons between groups, the values corresponding to the 212
HFHS, STD + GSE and HFHS + GSE groups were divided by those of the STD group, 213
to obtain the relative incremental factor or x-fold increase. The non-parametric Kruskal-214
Wallis and Mann-Whitney U tests were applied to analyse significant differences (P < 215
0.05) between groups. The Kruskal-Wallis test was applied to determine any significant 216
difference between the treatments and, if any were detected, the Mann-Whitney U test 217
was used to compare all the different pairs of the treatments. The SPSS IBM 19 package 218
for Windows was used throughout. 219
3. Results
220
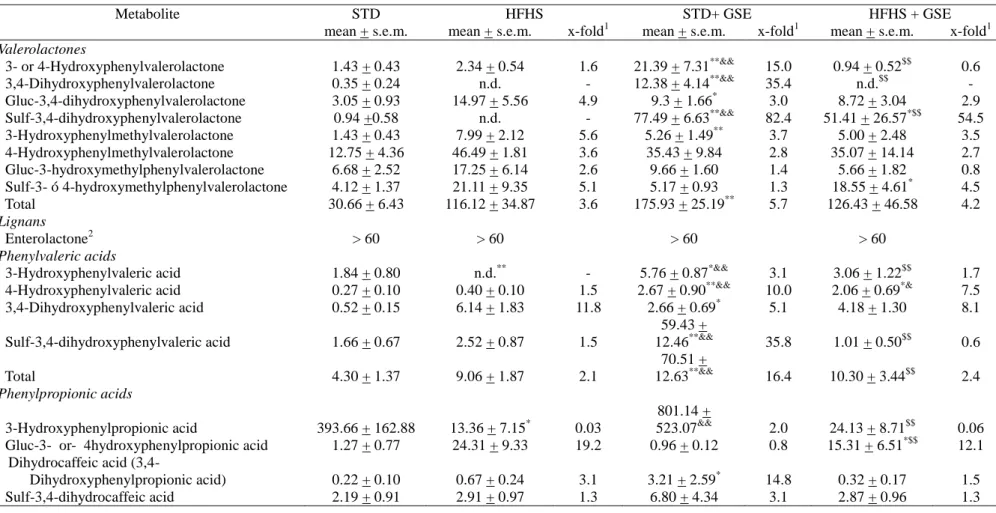
3.1 Microbial-derived metabolites in urine 221
Forty-eight transitions, corresponding to microbial metabolites reported to be formed 222
during the intestinal fermentation of PAs (25) were searched for in the samples. Table 2 223
shows the concentration data for the metabolites detected, as well as the x-fold 224
incremental factors compared to the STD group. 225
As expected, in most cases the metabolite concentrations in the STD + GSE group were 226
significantly higher than in the STD control and HFHS groups. Meanwhile, the 227
concentrations of PA metabolites when the high-dense-energy diet was supplemented 228
with GSE (HFHS + GSE group) were significantly lower than those recorded for the 229
STD + GSE group. This was observed for metabolites belonging to all the steps along 230
the PA fermentation pathways (valerolactones, lignans, phenylvaleric acids, 231
phenylpropionic acids, phenylacetic acids, benzoic acids, cinnamic acids and 232
glyccinated benzoic acids), and was particularly marked for phenylvaleric acids and 233
phenylpropionic acids. The total concentrations of metabolites belonging to these two 234
classes in the HFHS + GSE group were seven-fold and nearly twenty-fold lower, 235
respectively, than in the STD + GSE group. 236
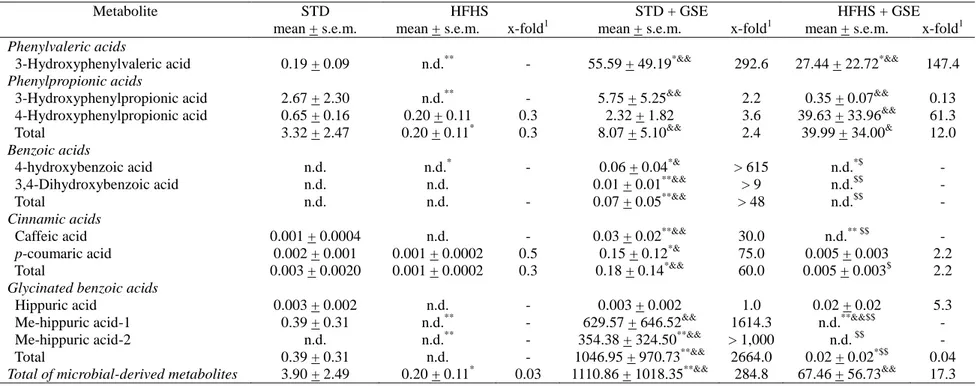
3.2 Microbial-derived metabolites in faeces 237
Ten microbial-derived metabolites were identified in faeces; Table 3 shows the 238
concentration data of the metabolites and the x-fold incremental factors compared to the 239
STD diet. The same tendencies as observed for microbial-derived metabolites in urine 240
were found in faeces: a) there was a significant increase in the overall concentration of 241
these compounds in the STD + GSE group, compared to the non-supplemented groups; 242
b) the formation of microbial-derived metabolites was lower in the HFHS + GSE group. 243
Thus, for most of the compounds detected, the concentrations in the HFHS + GSE 244
group were significantly lower than in the STD + GSE group. 245
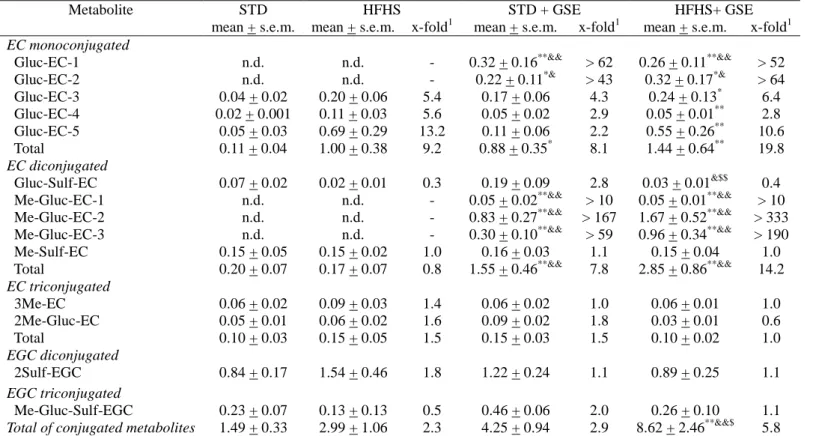
3.3 Conjugated metabolites of (epi)catechin and (epi)gallocatechin in urine 246
A total of 39 transitions were searched for in urine, corresponding to monoconjugated, 247
diconjugated and triconjugated (derived from the combination of methylated or Me, 248
sulfated or Sulf and glucuronidated or Gluc forms) metabolites of EC and EGC. Among 249
them, 15 metabolites were detected in the samples: 5 monoconjugated (EC 250
glucuronidated in different positions), 7 diconjugated (five of EC and two of EGC) and 251
three triconjugated (two of EC and one of EGC) (Table 4). They were identified using 252
further MRM or their MS/MS fragmentation patterns (Table S1). 253
Five EC monoglucuronides were detected; one exhibited its highest concentrations in 254
the STD + GSE group, while three others were detected at their highest concentrations 255
in the HFHS + GSE group. With regards to the diconjugated EC metabolites, a tendency 256
towards significantly higher concentrations in the HFHS + GSE group than in the STD 257
+ GSE group was observed. No significant difference was observed between the groups 258
for either EC triconjugated metabolites or EGC conjugated metabolites. Total excretion 259
of conjugated metabolites in urine was significantly higher in the HFHS + GSE group 260
than in the other three groups. 261
4. Discussion
262
In this study, we explored the effects of a HFHS diet on the metabolic fate of 263
supplemented grape PAs, compared to a STD diet with or without this supplementation. 264
Much effort has been devoted to properly characterizing the transformation of PAs after 265
their intake, based on animal studies, in which they were fed a STD diet, or in human 266
studies, involving either acute PA intake or a controlled and balanced diet [27]. 267
However, since Western diets typically present an excess of fat and simple 268
carbohydrates with respect to health recommendations, and it is known that other 269
dietary components may affect the bioavailability of polyphenols, the potential effect of 270
this dietary pattern on the transformation of polyphenols needs to be evaluated. 271
Specifically, we determined here the levels of PA-derived metabolites after 272
supplementing rats on a HFHS diet for a period of 16 weeks; representative of long-273
term adherence to a high-energy-dense diet. 274
Overall, the profiles of metabolites detected were similar to those previously reported in 275
urine and faeces after supplementation with grape PAs [24-25], and they were within 276
the same ranges as those reported in studies with similar supplementation over shorter 277
periods [28]. Regarding the apparently paradoxical detection of valerolactones in the 278
HFHS group which was fed a synthetic diet that did not contain polyphenols, it should 279
be remarked that several studies in humans have found basal concentrations of these 280
compounds after as long as 72 h of a polyphenol-free diet [26,29], despite the fact that 281
their renal excretion takes place 8-24 h after intake [30-31]. This seems to indicate that, 282
although PAs are the main precursors of valerolactones [26], a minor fraction of these 283
metabolites may be originated from other precursors, as proposed in the Human 284
Metabolome Database [32]. 285
The most remarkable effect we observed was that many microbial metabolites were 286
significantly decreased in the HFHS-GSE group, as compared to the STD-GSE group, 287
in both urine and the aqueous fraction of faeces- representative of those in contact with 288
the intestinal epithelium [33]. Therefore, the high-energy-dense diet reduces the amount 289
of polyphenol metabolites bioavailable and bioaccessible in the gut. Overall, this is 290
probably due more to a decrease in their formation more than in their absorption, since 291
the same tendency was observed in urine (post-absorption) that in faeces (not absorbed). 292
Nevertheless, for some specific compounds, such as 4-hydroxyphenylpropionic acid, a 293
decrease in their absorption should not be discarded, since the HFHS-GSE group 294
showed the highest concentration values in the faeces. The present results may have 295
implications for the potential beneficial effects of GSE supplementation when following 296
a HFHS diet, since increasing evidence shows that the microbial metabolites of 297
polyphenols play a key role in their health-related effects [16]. Along these lines, it was 298
recently reported that 3,4-dihydroxybenzoic acid (one of the compounds whose 299
circulation was found to be reduced when following the HFHS diet in this study) has the 300
capacity to activate components within the insulin signalling pathway [34]. Similarly, 301
the circulating levels of urolithin A glucuronide, a microbial metabolite of ellagitannins, 302
another class of polyphenols, were inversely associated with impaired glycaemic control 303
[35]. 304
Another important implication of the effects we observed in the microbial 305
transformation of PAs when following a HFHS diet are the modifications to the 306
microbiota responsible for that very transformation. We previously reported that a 307
HFHS diet induces a shift in bacterial species towards a higher prevalence of 308
Enterobacteriales, including Escherichia coli, probably related to weight gain in rats 309
[36]. Moreover, in both rodents and humans, a shift towards lower values of the ratio 310
Bacteroidetes/Firmicutes, with a loss of diversity in rodents, has been related with a fat 311
phenotype [37-38]; although this has not been convincingly confirmed and some 312
authors report contradictory results in humans [39]. Information on the bacterial species 313
involved in the transformation of polyphenols is still limited [40], as is overall 314
knowledge of the two-way interaction polyphenols–gut microbiota [41]. However, it 315
seems plausible that the modifications to the microbiota caused by a HFHS diet 316
selectively affect species capable of transforming polyphenols. At the same time, 317
polyphenols may be capable of modifying the composition of gut microbiota, as 318
suggested by the increase in the population of Bifidobacterium and decrease in 319
Enterobacteriales after the supplementation of healthy humans with PA-rich GSE [42]. 320
Opposite effects on the same bacterial types have also been attributed to high-energy-321
dense diets and obesity in rodents [43] and humans [44]. GSE might counteract a 322
putative decrease in PA-processing bacteria caused by a HFHS diet, but our results 323
suggest that this is not the case as the concentration of microbial-derived metabolites 324
was lower in the HFHS + GSE group than in the STD + GSE group- nevertheless, it 325
kept higher than in the HFHS group. Similarly, supplementation of a HFHS diet with 326
resveratrol did not counteract the dysbiosis triggered by a HFHS diet; while, in contrast, 327
quercetin supplementation did compensate for the diet-induced changes. These results 328
suggest differential effects depending on the type of polyphenol [22]. Interestingly, 329
when animals fed a HFHS diet received a combined supplementation with cranberry 330
polyphenols and a probiotic, the latter increased the circulation of phenolic metabolites 331
[23]. 332
Additionally, a tendency towards increased formation of conjugated EC metabolites in 333
the HFHS + GSE group was observed. This suggests higher activity of the detoxifying 334
enzymes in enterocytes and liver. It has been reported that the activity of the liver 335
cytochrome P450 2E1 is increased during non-alcoholic steatohepatitis [45]; a 336
pathology linked to high-fat diets. It has also been reported that the hepatic expression 337
of uridine 5’-diphosphate glucuronosyltransferase (the enzyme responsible for the 338
glucuronidation of polyphenols) is up-regulated in male rats fed a HFHS diet, which is 339
related, among other things, to increased expression of the proliferator-activated 340
receptor α (PPARα), which appears when consuming such a diet [46]. Although those 341
authors did not find the same effects in female rats, our results indirectly seem to 342
indicate a similar up-regulation of this enzyme or those involved in the sulfation or 343
methylation of EC after long-term exposure to a HFHS diet. Another possible 344
explanation for the increase in EC conjugates would be delayed exposure to phase II 345
enzymes associated with longer digestion times in animals fed a HFHS diet. 346
The dose used in this study (30 mg PA/kg body weight of rat) would be equivalent to a 347
daily dose of 4.9 mg/kg body weight in humans [47], i.e., 340 mg/d for a 70 kg adult. 348
Since median daily polyphenol intake in humans is spread over a wide range, from 349
about 150 to nearly 500 mg/p/day [48], significantly large subpopulations consume 350
more polyphenols than the amount equivalent to the dose used in the present study. As 351
no adverse effects have ever been reported, this dose could certainly be considered safe. 352
Indeed, toxicological studies in rats report no adverse effect at doses much higher than 353
that used in this study [49]. Similar doses of GSE have been shown to have beneficial 354
effects on variables related to metabolic syndrome, such as lipidaemia—in rats and 355
humans—or insulin metabolism—in rats [10,12]. 356
This study has some limitations. First, a higher number of animals would have 357
strengthened the statistical significance of the differences detected in some metabolites. 358
However, we consider that the resulting lack of significance in some of the observations 359
does not invalidate our overall conclusions. Second, due to the limited number of 360
commercial standards of PA metabolites that are currently available, the results had to 361
be expressed as equivalents of other metabolites; thus, the values provided here should 362
only be used for comparative purposes. 363
In summary, a HFHS diet significantly decreased the production of microbial-derived 364
PA metabolites in GSE-supplemented rats, with respect to PA metabolism in animals 365
fed the STD diet. At the same time, an increase in conjugated EC metabolites was 366
observed in the HFHS group; probably due to up-regulation of hepatic enzymes. Our 367
results seem to indicate a shift in the microbial populations triggered by a HFHS diet 368
that is not reversed by the polyphenols in GSE. This effect should be further studied- 369
nevertheless, the concentrations of microbial-derived PA metabolites kept higher in the 370
HFHS + GSE group than in the HFHS group. Since microbial metabolites seem to be 371
key mediators of the biological activities of polyphenols, a decrease in their formation 372
when following a HFHS diet would presumably affect the health-related properties of 373
polyphenols. 374
Acknowledgements
375
Language revision by Christopher Evans is appreciated. 376
This research was supported by the Spanish Ministry of Science and Innovation (grants: 377
AGL2009-12374-C03-01, -02 and -03; and AGL2013-49079-C2-1, 2 and -R, and 378
through a doctoral fellowship to L.M.). The Panamanian Government 379
(SENACYT/IFARHU) awarded a graduate fellowship to E.M.-T. The ISCIII is 380
acknowledged for a “Sara Borrell” postdoctoral contract to J.P.-J. (CD09/00068). The 381
funding sources did not have any role in the study design; in the collection, analysis and 382
interpretation of data; in the writing of the report; and in the decision to submit the 383
article for publication. 384
Conflict of interest
385
The authors declare that they have no conflict of interest. 386
References
387
[1] Alberti KGMM, Eckel RH, Grundy SM, Zimmet PZ, Cleeman JI, Donato KA, 388
Fruchart JC, James PT, Loria CM, Smith SC (2009) Harmonizing the metabolic 389
syndrome: A joint interim statement of the international diabetes federation task 390
force on epidemiology and prevention; National heart, lung, and blood institute; 391
American heart association; World heart federation; International atherosclerosis 392
society; and international association for the study of obesity. Circul 120: 1640-45. 393
[2] Grundy SM. (2008) Metabolic syndrome pandemic. Arterioscl Thromb Vascular 394
Biol 28: 629-36. 395
[3] Bourgoin F, Bachelard H, Badeau M, Melançon S, Pitre M, Larivière R, Nadeau A 396
(2008) Endothelial and vascular dysfunctions and insulin resistance in rats fed a 397
high-fat, high-sucrose diet. Am J Physiol Heart Circul Physiol 295: 1044-55. 398
[4] Ishimoto T, Lanspa MA, Rivard CJ, Roncal-Jiménez CA, Orlicky DJ, Cicerchi C, 399
McMahan RH, Abdelmalek MF, Rosen HR, Jackman MR et al. (2013) High-fat and 400
high-sucrose (western) diet induces steatohepatitis that is dependent on fructokinase. 401
Hepatol 58: 1632-43. 402
[5] Naderali EK, Williams G (2003) Prolonged endothelial-dependent and -independent 403
arterial dysfunction induced in the rat by short-term feeding with a fat, high-404
sucrose diet. Atheroscl166: 253-59. 405
[6] Sato A, Kawano H, Notsu T, Ohta M, Nakakuki M, Mizuguchi K, Itoh M, Suganami 406
T, Ogawa Y (2010) Antiobesity effect of eicosapentaenoic acid in high-fat/high-407
sucrose diet-induced obesity: Importance of hepatic lipogenesis. Diabetes 59: 2495-408
2504. 409
[7] Molinar-Toribio E, Pérez-Jiménez J, Ramos-Romero S, Gómez L, Taltavull N, 410
Nogués MR, Adeva A, Jáuregui O, Joglar J, Clapés P et al. (2015) D-fagomine 411
attenuates metabolic alterations induced by a high-energy-dense diet in rats. Food 412
Function 6: 2614-19. 413
[8] Mattison JA, Wang M, Bernier M, Zhang J, Park SS, Maudsley S, Ann SS, 414
Santhanam L, Martin B, Faulkners S et al. (2014) Resveratrol prevents high 415
fat/sucrose diet-induced central arterial wall inflammation and stiffening in 416
nonhuman primates. Cell Metabolism 20: 183-90. 417
[9] Serrano J, Puupponen-Pimia R, Dauer A, Aura AM, Saura-Calixto F (2009) 418
Tannins: Current knowledge of food sources, intake, bioavailability and biological 419
effects. Molec Nutr Food Res 53: 310-29. 420
[10] Bladé C, Arola L, Salvadó MJ (2010) Hypolipidemic effects of proanthocyanidins 421
and their underlying biochemical and molecular mechanisms. Molec Nutr Food Res 422
54: 37-59. 423
[11] Barrett A, Ndou T, Hughey CA, Straut C, Howell A, Dai Z, Zaletunc G (2013) 424
Inhibition of α-amylase and glucoamylase by tannins extracted from cocoa, 425
pomegranates, cranberries, and grapes. J Agric Food Chem 61: 1477-86. 426
[12] Castell-Auví A, Cedó L, Pallarès V, Blay MT, Pinent M, Motilva MJ, García-427
Vallés S, Pujadas G, Maechler P, Ardévol A (2012) Procyanidins modify insulinemia 428
by affecting insulin production and degradation. J Nutr Biochem 23: 1565-72. 429
[13] Fraga CG, Galleano M, Verstraeten SV, Oteiza PI (2010) Basic biochemical 430
mechanisms behind the health benefits of polyphenols. Molec Aspects Medicine 31: 431
435-45. 432
[14] Pan MH, Lai CS, Ho CT (2010) Anti-inflammatory activities of natural flavonoids. 433
Food Function 1: 15-31. 434
[15] Rodríguez-Mateos A, Vauzour D, Krueger CG, Shanmuganayagam D, Reed J, 435
Calani L (2014) Bioavailability, bioactivity and impact on health of dietary 436
flavonoids and related compounds: an update. Archives Toxicol 88: 1803-53. 437
[16] Williamson G, Clifford MN (2010) Colonic metabolites of berry polyphenols: the 438
missing link to their biological activity? Br J Nutr 104: 48-66. 439
[17] Urpí-Sardá M, Llorach R, Khan N, Monagas M, Rotches-Ribalta M, Lamuela-440
Raventós RM, Estruch R, Tinahones FJ, Andrés-Lacueva C (2010) Effect of milk 441
on the urinary excretion of microbial phenolic acids after cocoa powder 442
consumption in humans. J Agric Food Chem 58: 4706-11. 443
[18] Tulipani S, Martínez-Huélamo M, Rotchés M, Estruch R, Escribano E, Andrés-444
Lacueva C, Illán M, Lamuela-Raventós RM (2012) Oil matrix effects on plasma 445
exposure and urinary excretion of phenolic compounds from tomato sauces: 446
Evidence from a human pilot study. Food Chem 30: 581-90. 447
[19] Rodríguez-Mateos A, Cifuentes-Gómez T, González-Salvador I, Ottaviani JI, 448
Schroeter H, Kelm M, Heiss C, Spencer JPE (2015) Influence of age on the 449
absorption, metabolism, and excretion of cocoa flavanols in healthy subjects. Molec 450
Nutr Food Res 59: 1504-12. 451
[20] Aoun M, Michel F, Fouret G, Jullien M, Wrutniak-Cabello C, Ramos J, Cristol JP, 452
Coudray C, Carbonneau MA, Feillet-Coudray C (2010) A polyphenol extract 453
modifies quantity but not quality of liver fatty acid content in high-fat-high-sucrose 454
diet-fed rats: Possible implication of the sirtuin pathway. Br J Nutr 104: 1760-70. 455
[21] Heber D, Zhang Y, Yang J, Ma JE, Henning SM, Li Z (2014) Green tea, black tea, 456
and oolong tea polyphenols reduce visceral fat and inflammation in mice fed high-457
fat, high-sucrose obesogenic diets. J Nutr 144: 1385-93. 458
[22] Etxebarría L, Arias N, Boqué N, Macarulla MT, Portillo MP, Martínez JA, Milagro 459
FI (2015) Reshaping faecal gut microbiota composition by the intake of trans-460
resveratrol and quercetin in high-fat sucrose diet-fed rats. J Nutr Biochem 26: 651-461
60. 462
[23] Dudonné S, Varin TV, Anhê FF, Dubé P, Roy D, Pilon G, Marette A, Levy E, 463
Jacquot C, Urdaci M et al. (2015) Modulatory effects of a cranberry extract co-464
supplementation with Bacillus subtilis CU1 probiotic on phenolic compounds 465
bioavailability and gut microbiota composition in high-fat diet-fed mice. 466
PharmaNutrition 3: 89-100. 467
[24] Touriño S, Fuguet E, Vinardell MP, Cascante M, Torres JL (2009) Phenolic 468
metabolites of grape antioxidant dietary fiber in rat urine. J Agric Food Chem 57: 469
11418–11426. 470
[25] Touriño S, Pérez-Jiménez J, Mateos-Martín ML, Fuguet E, Vinardell MP, 471
Cascante M, Torres JL (2011) Metabolites in contact with the rat digestive tract 472
after ingestion of a phenolic-rich dietary fiber matrix. J Agric Food Chem 59: 473
5955–5963. 474
[26] Urpí-Sardá M, Garrido I, Monagas M, Gómez-Cordovés C, Medina-Remón A, 475
Andrés-Lacueva C (2009) Profile of plasma and urine metabolites after the intake 476
of almond [Prunus dulcis (Mill.) D.A. Webb] polyphenols in humans. J Agric Food 477
Chem 57: 10134–10142. 478
[27] Monagas M, Urpí-Sardá M, Sánchez-Patán F, Llorach R, Garrido I, Gómez-479
Cordovés C, Andrés-Lacueva C, Bartolomé B (2010) Insights into the metabolism 480
and microbial transformation of dietary flavan-3ols and the bioactivity of their 481
metabolites. Food Function1: 233-53. 482
[28] Choy YY, Quifer-Rada P, Holstege DM, Frese SA, Calvert CA, Mills DA, 483
Lamuela-Raventós RM, Waterhouse AL (2014) Phenolic metabolites and 484
substancial microbiome changes in pig feces by ingesting grape seed 485
proanthocyanidins. Food Function 5: 2298-308. 486
[29] Vitaglione p, Barone Lumaga R, Ferracane R, Sellitto S, Morelló JR, Requnat 487
Miranda J, Shimoni E, Fogliano V (2012) Human bioavailability of flavanols and 488
phenolic acids from cocoa-nut creams enriched with free or microencapsulated 489
cocoa polyphenols. Br J Nutr 28: 1832-43. 490
[30] Li C, Lee MJ, Sheng S, Meng X, Prabhu S, Winnik B, Huang B, Chung JY, Yan S, 491
Ho CT et al. (2000) Structural identification of two metabolites of catechins and 492
their kinetics in human urine and blood after tea ingestion. Chem Res Toxicol 13: 493
177-84. 494
[31] Meng X, Sang S, Zhu N, Lu H, Sheng S, Lee MJ, Ho CT, Yang CS (2002) 495
Identification and characterization of methylated and ring-fission metabolites of 496
tea catechins formed in humans, mice, and rats. Chem Res Toxicol 15: 1042-50. 497
[32] Wishart D, Tzur D, Knox C, Eisner R, Guo AC, Young N, Cheng D, Jewell K, 498
Arndt D, Sawhney S et al. (2007) HMDB: The Human Metabolome Database. 499
Nucleic Acid Res 35: 521-26. 500
[33] Gill CIR, McDougall CJ, Glidewell S, Stewart D, Shen Q, Tuohy K, Dobbin A, 501
Boyd D, Brown D, Haldar S et al. (2010) Profiling of phenols in human fecal water 502
after raspberry supplementation. J Agric Food Chem 58: 10389-95. 503
[34] Scazzocchio B, Vari R, Filesi C, Del Gaudio I, D’Archivio M, Santangelo C, 504
Iacovelli A, Galvano F, Pluchinotta FR, Gioannini C et al. (2015) Protocatechuic 505
acid activates key component of insulin signalling pathway mimicking insulin 506
activity. Molec Nutr Food Res 59: 1472-81. 507
[35] Mora-Cubillos X, Tulipani S, García-Aloy M, Bulló M, Tinahones FJ, Andrés-508
Lacueva C (2015) Plasma metabolomics biomarkers of mixed nuts exposure 509
inversely correlate with severity of metabolic syndrome. Molec Nutr Food Res 59: 510
2480-90. 511
[36] Ramos-Romero S, Molinar-Toribio E, Gómez L, Pérez-Jiménez J, Casado M, 512
Clapés P, Piña B, Torres JL (2014) Effect of d-fagomine on excreted enterobacteria 513
and weight gain in rats fed a high-fat high-sucrose diet. Obesity 2: 976-79. 514
[37] Turnbaugh PJ, Ley RE, Mahowald MS, Magrini V, Mardis ER, Gordon JI (2006) 515
An obesity-associated gut microbiome with increased capacity for energy harvest. 516
Nature 444: 1027-1131. 517
[38] Turnbaugh PJ, Hamady M, Yatsunenko T, Cantarel BL, Duncan A, Ley RE, Sogin, 518
ML, Jones WJ, Roe BA Affourtit JP et al. (2009) A core gut microbiome in obese 519
and lean twins. Nature 457: 480-84. 520
[39] Schwiertz A, Taras D, Schafer K, Beijer S, Bos NA, Donus C (2010) Microbiota 521
and SCFA in lean and overweight healthy subjects. Obesity 18: 190-95 522
[40] Selma MV, Espín CJ, Tomás-Barberán FA (2009) Interaction between phenoliccs 523
and gut microbiota: role in human health. J Agric Food Chem 57: 6485-501. 524
[41] Dueñas M, Cueva C, Muñoz-González I, Jiménez-Girón A, Sánchez-Patán F, 525
Santos-Buelga C, Moreno-Arribas C, Bartolomé B (2015) Studies on modulation of 526
gut microbiota by wine polyphenols: from isolated cultures to omic approaches. 527
Antioxidants 4: 1-21. 528
[42] Yamakoshi J, Tokutake S, Kikuchi M, Kubota Y, Konishi Y, Mitsuoka T (2001) 529
Effect of proanthocyanidin-rich extract from grape seeds on human fecal flora and 530
fecal odor. Microbiol Ecol Health Dis13: 25-31. 531
[43] De La Serre CB, Ellis CL, Lee J, Hartman AL, Rutledge JC, Raybould HE (2010) 532
Propensity to high-fat diet-induced obesity in rats is associated with changes in 533
the gut microbiota and gut inflammation. Am J Physiol Gastrointestinal Liver 534
Physiol 299: 440-448. 535
[44] Brinkworth GD, Noakes M, Clifton PM, Bird AR (2009) Comparative effects of 536
very low-carbohydrate, high-fat and high-carbohydrate, low-fat weight-loss diets on 537
bowel habit and faecal short-chain fatty acids and bacterial populations. Br J Nutr 538
101: 1493-502. 539
[45] Weltman MD, Farrell GC, Hall P, Ingelman-Sundberg M, Liddle C (1998) Hepatic 540
cytochrome p450 2E1 is increased in patients with nonalcoholic steatohepatitis. 541
Hepatol 27: 128-33. 542
[46] Osabe M, Sugatani J, Fukuyama T, Ikushiro S, Ikari A, Miwa M (2008) Expression 543
of hepatic UDP-glucuronosyltransferase 1A1 and 1A6 correlated with increased 544
expression of the nuclear constitutive androstane receptor and peroxisome 545
proliferator-activated receptor alpha in male rats fed a high-fat and high-sucrose 546
diet. Drug Metabolism Disposition 36: 294-302. 547
[47] Reagan-Shaw S, Nihal M, Ahmad N. (2008) Dose translation from animal to 548
human studies revisited. Faseb J 22:259-61. 549
[48] Knaze V, Zamora-Ros R, Luján-Barroso L, Romieu I, Scalbert A, Slimani N, Riboli 550
E, Van Rossum CTM, Bueno-de-Mesquita HB, Trichopulou A. et al. (2012) Intake 551
estimation of total and individual flavan-3-ols, proanthocyanidins and theaflavins, 552
their food sources and determinants in the European Prospective Investigation into 553
Cancer and Nutrition (EPIC) study. Br J Nutr 28: 1095-108. 554
[49] Yamakoshi J, Saito M, Kataoka S, Kikuchi M. (2012) Safety evaluation of 555
proanthocyanidin-rich extract from grape seeds. Food Chem Toxicol 40: 599-607. 556
TABLES Table 1. Composition of experimental diets
Diet STD HFHS STD-GSE HFHS-GSE Ingredients (g) Flour 1000.01 1000.02 1000.01 1000.02 TBHQ 0.08 0.08 0.08 0.08 Porcine gelatin 25.0 25.0 25.0 25.0 Soybean lecithin 6.0 22.0 6.0 22.0 Soybean oil 17.4 22.0 17.4 22.0 Grajfnol®3 - - 0.88 1.09 Macronutrients4 Protein (% by weight) 16.0 20.9 16.0 20.9 Carbohydrate (% by weight) 66.8 47.4 66.8 47.4 Fat (% by weight) 6.0 25.6 6.0 25.6
Energy from protein (%) 16.5 16.5 16.5 16.5
Energy from carbohydrate (%) 69.4 37.7 69.4 37.7
Energy from fat (%) 14.1 45.8 14.1 45.8
Total energy density (Kcal/g )7 3.9 5.1 3.9 5.1
1 Standard flour (Teklad Global 2014), containing wheat middlings, ground wheat, ground corn, corn gluten meal, calcium carbonate, soybean oil, dicalcium phosphate, iodized salt, L-lysine, vitamin E acetate, DL-methionine, magnesium oxide, choline chloride, manganous oxide, ferrous sulfate, menadione sodium bisulfite complex (source of vitamin K activity), zinc oxide, copper sulfate, niacin, calcium pantothenate, calcium iodate, pyridoxine hydrochloride, riboflavin, thiamin mononitrate, vitamin A acetate, vitamin B12 supplement, folic acid, cobalt carbonate, biotin and vitamin D3 supplement. 2 High-fat high-sucrose diet (Tekland TD 08811), containing sucrose, anhydrous milkfat, casein, maltodextrin, corn starch, cellulose, mineral mix AIN-93G-MX, soybean oil, vitamin mix AIN-93G-VX, L-cystine, choline, bitartrate, green food colour, tert-butylhydroquinone
3
Grajfnol® dose was adjusteded to provide a daily proanthocyanidin dose of 30 mg/kg body weight (body weight was higher in rats following a HFHS diet).
4 Energy density is estimated as metabolizable energy based on the Atwater factors, assigning 4kcal/g to protein, 9kcal/g to fat, and 4kcal/g to carbohydrate, including dietary fiber.
Table 2. Microbial-derived proanthocyanidin metabolites in urine from rats fed a standard (STD) diet or a high-fat high-sucrose (HFHS) diet
without or with grape seed extract (GSE). Results expressed as µM, after quantification with structurally similar commercial standards (seeTable
S1).
Metabolite STD HFHS STD+ GSE HFHS + GSE
mean + s.e.m. mean + s.e.m. x-fold1 mean + s.e.m. x-fold1 mean + s.e.m. x-fold1
Valerolactones 3- or 4-Hydroxyphenylvalerolactone 1.43 + 0.43 2.34 + 0.54 1.6 21.39 + 7.31**&& 15.0 0.94 + 0.52$$ 0.6 3,4-Dihydroxyphenylvalerolactone 0.35 + 0.24 n.d. - 12.38 + 4.14**&& 35.4 n.d.$$ - Gluc-3,4-dihydroxyphenylvalerolactone 3.05 + 0.93 14.97 + 5.56 4.9 9.3 + 1.66* 3.0 8.72 + 3.04 2.9 Sulf-3,4-dihydroxyphenylvalerolactone 0.94 +0.58 n.d. - 77.49 + 6.63**&& 82.4 51.41 + 26.57*$$ 54.5 3-Hydroxyphenylmethylvalerolactone 1.43 + 0.43 7.99 + 2.12 5.6 5.26 + 1.49** 3.7 5.00 + 2.48 3.5 4-Hydroxyphenylmethylvalerolactone 12.75 + 4.36 46.49 + 1.81 3.6 35.43 + 9.84 2.8 35.07 + 14.14 2.7 Gluc-3-hydroxymethylphenylvalerolactone 6.68 + 2.52 17.25 + 6.14 2.6 9.66 + 1.60 1.4 5.66 + 1.82 0.8 Sulf-3- ó 4-hydroxymethylphenylvalerolactone 4.12 + 1.37 21.11 + 9.35 5.1 5.17 + 0.93 1.3 18.55 + 4.61* 4.5 Total 30.66 + 6.43 116.12 + 34.87 3.6 175.93 + 25.19** 5.7 126.43 + 46.58 4.2 Lignans Enterolactone2 > 60 > 60 > 60 > 60 Phenylvaleric acids
3-Hydroxyphenylvaleric acid 1.84 + 0.80 n.d.** - 5.76 + 0.87*&& 3.1 3.06 + 1.22$$ 1.7 4-Hydroxyphenylvaleric acid 0.27 + 0.10 0.40 + 0.10 1.5 2.67 + 0.90**&& 10.0 2.06 + 0.69*& 7.5 3,4-Dihydroxyphenylvaleric acid 0.52 + 0.15 6.14 + 1.83 11.8 2.66 + 0.69* 5.1 4.18 + 1.30 8.1 Sulf-3,4-dihydroxyphenylvaleric acid 1.66 + 0.67 2.52 + 0.87 1.5 59.43 + 12.46**&& 35.8 1.01 + 0.50$$ 0.6 Total 4.30 + 1.37 9.06 + 1.87 2.1 70.51 + 12.63**&& 16.4 10.30 + 3.44$$ 2.4 Phenylpropionic acids 3-Hydroxyphenylpropionic acid 393.66 + 162.88 13.36 + 7.15* 0.03 801.14 + 523.07&& 2.0 24.13 + 8.71$$ 0.06 Gluc-3- or- 4hydroxyphenylpropionic acid 1.27 + 0.77 24.31 + 9.33 19.2 0.96 + 0.12 0.8 15.31 + 6.51*$$ 12.1
Dihydrocaffeic acid (3,4-
Dihydroxyphenylpropionic acid) 0.22 + 0.10 0.67 + 0.24 3.1 3.21 + 2.59* 14.8 0.32 + 0.17 1.5 Sulf-3,4-dihydrocaffeic acid 2.19 + 0.91 2.91 + 0.97 1.3 6.80 + 4.34 3.1 2.87 + 0.96 1.3
Total 397.34 + 163.18 41.25 + 8.72 0.1
815.12 +
530.01&& 2.1 42.63 + 15.65$$ 0.1
Phenylacetic acids
3-Hydroxyphenylacetic acid 3.74 + 1.40 4.71 + 1.57 1.3 24.10 + 3.79**&& 6.4 7.23 + 3.11$ 1.9 4-Hydroxyphenylacetic acid 3.62 + 1.40 80.49 + 20.14 22.3 102.44 + 17.61**&& 28.3 37.99 + 17.26$ 10.5 3,4-Dihydroxyphenylacetic acid 0.05 + 0.02 0.56 + 0.22 10.9 0.58 + 0.28** 11.6 0.35 + 0.16 6.8 Sulf-3,4-dihydroxyphenylacetic acid 0.46 + 0.26 0.76 + 0.30 1.6 0.47 + 0.11 1.0 0.53 + 0.18 1.1 Total 7.87 + 2.74 86.51 + 21.92** 11.0 127.6 + 16.2** 16.2 46.09 + 20.49$ 5.8 Benzoic acids 4-hydroxybenzoic acid 0.82 + 0.33 4.40 + 1.13 5.3 3.60 + 1.13* 4.4 2.06 + 0.57 2.5 3,4-Dihydroxybenzoic acid 0.02 + 0.01 0.10 + 0.03 4.7 1.20 + 0.55**&& 56.9 0.04 + 0.02$$ 2.0 Gluc-3-hydroxybenzoic acid 0.01 + 0.01 0.005 + 0.002 0.4 0.15 + 0.07**&& 10.6 0.003 + 0.002$$ 0.3 Gluc-4-hydroxybenzoic acid n.d. 0.04 + 0.02** > 31 0.02 + 0.005* > 7 0.01 + 0.01 > 10 Sulf-3,4-dihydroxybenzoic acid 0.39 + 0.12 2.43 + 0.68 5.0 3.90 + 2.12** 5.1 1.82 + 0.72 3.8 Sulf-vanillic-acid 19.43 + 3.83 12.04 + 3.92 0.6 25.92 + 4.41 1.3 9.98 + 3.60$ 0.5
Total 20.68 + 3.57 19.01 + 5.17 0.9 34.79 + 1.70 1.7 13.92 + 4.53 0.7
Cinnamic acids
Caffeic acid 0.06 + 0.03 n.d.* - 0.17 + 0.10&& 3.0 n.d.*$$ -
m-coumaric acid 6.92 + 3.26 0.37 + 0.12* 0.05 13.96 + 1.74&& 2.0 3.73 + 1.11&&$$ 0.5 p-coumaric acid 1.43 + 0.53 0.16 + 0.04 0.1 1.86 + 0.53&& 1.3 0.10 + 0.04$$ 0.07 Sulf-coumaric acid-1 n.d. 0.38 + 0.16** > 38 0.79 + 0.27** > 790 0.14 + 0.13* > 14 Sulf-coumaric acid-2 0.002 + 0.001 0.35 + 0.15** 169.3 0.75 + 0.24** 375.0 0.08 + 0.08$ 38.0
Ferulic acid 0.91 + 0.37 n.d.** - 1.14 + 0.43&& 1.2 n.d.**$$ -
Total 9.31 + 3.90 1.26 + 0.33 0.1 18.68 + 2.00&& 2.0 4.05 + 1.27&$$ 0.4
Glycinated benzoic acids
Hippuric acid 2.85 + 1.05 167.85 + 73.30** 58.9 125.18 + 73.97 43.9 105.48 + 75.36 37.0 Hydroxyhippuric acid 0.02 + 0.02 0.22 + 0.07* 12.7 0.96 + 0.20**&& 48.0 0.12 + 0.06$$ 7.2 Me-hippuric acid-1 0.01 + 0.01 0.33 + 0.13** 37.3 5.32 + 2.02** 532.0 0.13 + 0.12 14.3 Me-hippuric acid-2 0.17 + 0.07 n.d.** - 0.79 + 0.42&& 4.6 n.d. **$$ - Total 3.05 + 1.10 168.40 + 73.41** 55.3 132.25 + 74.10* 43.4 105.73 + 75.51 34.7
Total of microbial-derived metabolites3 473.21 + 174.23 441.61 + 123.04 0.9 1375.03 + 534.83 2.9 355.49 + 164.69 0.7 n.d., non-detected; Gluc, glucuronide; Me, methyl; Sulf, sulfated
1 Values generated by dividing metabolite concentration by the concentration of the same metabolite in the STD group. When the compound was n.d. in the STD group, the limit of detection was used to calculate x-fold value.
2 Enterolactone occurred in all groups at concentrations above the highest point in the calibration curve..
3 Enterolactone was not included in the calculation of the total microbial metabolites because its actual concentration could not be determined.
* P < 0.05 vs STD group. **P< 0.01 vs STD group. & P < 0.05 vs HFHS group. && P< 0.01 vs HFHS group. $ P < 0.05 vs STD + GSE group. $$ P < 0.01 vs STD + GSE group. Comparisons were performed using the Kruskal-Wallis and Mann-Whitney U tests
Table 3. Microbial-derived proanthocyanidin metabolites in faeces from rats fed a standard (STD) diet or a high-fat high-sucrose (HFHS) diet
without or with grape seed extract (GSE). Results expressed as µmol/g dried faeces, after quantification with structurally similar commercial standards (see Table S1).
Metabolite STD HFHS STD + GSE HFHS + GSE
mean + s.e.m. mean + s.e.m. x-fold1 mean + s.e.m. x-fold1 mean + s.e.m. x-fold1
Phenylvaleric acids
3-Hydroxyphenylvaleric acid 0.19 + 0.09 n.d.** - 55.59 + 49.19*&& 292.6 27.44 + 22.72*&& 147.4
Phenylpropionic acids
3-Hydroxyphenylpropionic acid 2.67 + 2.30 n.d.** - 5.75 + 5.25&& 2.2 0.35 + 0.07&& 0.13 4-Hydroxyphenylpropionic acid 0.65 + 0.16 0.20 + 0.11 0.3 2.32 + 1.82 3.6 39.63 + 33.96&& 61.3 Total 3.32 + 2.47 0.20 + 0.11* 0.3 8.07 + 5.10&& 2.4 39.99 + 34.00& 12.0
Benzoic acids
4-hydroxybenzoic acid n.d. n.d.* - 0.06 + 0.04*& > 615 n.d.*$ -
3,4-Dihydroxybenzoic acid n.d. n.d. 0.01 + 0.01**&& > 9 n.d.$$ -
Total n.d. n.d. - 0.07 + 0.05**&& > 48 n.d.$$ -
Cinnamic acids
Caffeic acid 0.001 + 0.0004 n.d. - 0.03 + 0.02**&& 30.0 n.d.** $$ - p-coumaric acid 0.002 + 0.001 0.001 + 0.0002 0.5 0.15 + 0.12*& 75.0 0.005 + 0.003 2.2 Total 0.003 + 0.0020 0.001 + 0.0002 0.3 0.18 + 0.14*&& 60.0 0.005 + 0.003$ 2.2
Glycinated benzoic acids
Hippuric acid 0.003 + 0.002 n.d. - 0.003 + 0.002 1.0 0.02 + 0.02 5.3
Me-hippuric acid-1 0.39 + 0.31 n.d.** - 629.57 + 646.52&& 1614.3 n.d.**&&$$ - Me-hippuric acid-2 n.d. n.d.** - 354.38 + 324.50**&& > 1,000 n.d. $$ - Total 0.39 + 0.31 n.d. - 1046.95 + 970.73**&& 2664.0 0.02 + 0.02*$$ 0.04
Total of microbial-derived metabolites 3.90 + 2.49 0.20 + 0.11* 0.03 1110.86 + 1018.35**&& 284.8 67.46 + 56.73&& 17.3 n.d., non-detected; Gluc, glucuronide; Me, methyl; Sulf, sulphated
1 Values generated by dividing metabolite concentration by the concentration of the same metabolite in the STD group . When the compound was n.d. in the STD group, the limit of detection was used to calculate the x-fold value.
*
P < 0.05 vs STD group. **P< 0.01 vs STD group. & P < 0.05 vs HFHS group. && P< 0.01 vs HFHS group. $ P < 0.05 vs STD + GSE group. $$ P < 0.01 vs STD + GSE group. Comparisons were performed using the Kruskal-Wallis and Mann-Whitney U tests
Table 4. (Epi)catechin and (epi)gallocatechin conjugated metabolites in urine from rats fed a standard (STD) diet or a high-fat high-sucrose
(HFHS) diet without or with grape seed extract (GSE). Results expressed as µM, after quantification with structurally similar commercial standard (seeTable S1).
Metabolite STD HFHS STD + GSE HFHS+ GSE
mean + s.e.m. mean + s.e.m. x-fold1 mean + s.e.m. x-fold1 mean + s.e.m. x-fold1
EC monoconjugated
Gluc-EC-1 n.d. n.d. - 0.32 + 0.16**&& > 62 0.26 + 0.11**&& > 52 Gluc-EC-2 n.d. n.d. - 0.22 + 0.11*& > 43 0.32 + 0.17*& > 64 Gluc-EC-3 0.04 + 0.02 0.20 + 0.06 5.4 0.17 + 0.06 4.3 0.24 + 0.13* 6.4 Gluc-EC-4 0.02 + 0.001 0.11 + 0.03 5.6 0.05 + 0.02 2.9 0.05 + 0.01** 2.8 Gluc-EC-5 0.05 + 0.03 0.69 + 0.29 13.2 0.11 + 0.06 2.2 0.55 + 0.26** 10.6 Total 0.11 + 0.04 1.00 + 0.38 9.2 0.88 + 0.35* 8.1 1.44 + 0.64** 19.8 EC diconjugated Gluc-Sulf-EC 0.07 + 0.02 0.02 + 0.01 0.3 0.19 + 0.09 2.8 0.03 + 0.01&$$ 0.4 Me-Gluc-EC-1 n.d. n.d. - 0.05 + 0.02**&& > 10 0.05 + 0.01**&& > 10 Me-Gluc-EC-2 n.d. n.d. - 0.83 + 0.27**&& > 167 1.67 + 0.52**&& > 333 Me-Gluc-EC-3 n.d. n.d. - 0.30 + 0.10**&& > 59 0.96 + 0.34**&& > 190 Me-Sulf-EC 0.15 + 0.05 0.15 + 0.02 1.0 0.16 + 0.03 1.1 0.15 + 0.04 1.0 Total 0.20 + 0.07 0.17 + 0.07 0.8 1.55 + 0.46**&& 7.8 2.85 + 0.86**&& 14.2
EC triconjugated 3Me-EC 0.06 + 0.02 0.09 + 0.03 1.4 0.06 + 0.02 1.0 0.06 + 0.01 1.0 2Me-Gluc-EC 0.05 + 0.01 0.06 + 0.02 1.6 0.09 + 0.02 1.8 0.03 + 0.01 0.6 Total 0.10 + 0.03 0.15 + 0.05 1.5 0.15 + 0.03 1.5 0.10 + 0.02 1.0 EGC diconjugated 2Sulf-EGC 0.84 + 0.17 1.54 + 0.46 1.8 1.22 + 0.24 1.1 0.89 + 0.25 1.1 EGC triconjugated Me-Gluc-Sulf-EGC 0.23 + 0.07 0.13 + 0.13 0.5 0.46 + 0.06 2.0 0.26 + 0.10 1.1
Total of conjugated metabolites 1.49 + 0.33 2.99 + 1.06 2.3 4.25 + 0.94 2.9 8.62 + 2.46**&&$ 5.8 n.d., non-detected; Gluc, glucuronide; Me, methyl; Sulf, sulphated
1 Values generated by dividing metabolite concentration by the concentration of the same metabolite in the STD group . When the compound was n.d. in the STD group, the limit of detection was used to calculate the x-fold value.
* P < 0.05 vs STD group. **P< 0.01 vs STD group. & P < 0.05 vs HFHS group. && P< 0.01 vs HFHS group. $ P < 0.05 vs STD + GSE group. $$ P < 0.01 vs STD + GSE group. Comparisons were performed using the Kruskal-Wallis and Mann-Whitney U tests