Sapienza University of Rome
Department of Biochemical Sciences “A. Rossi Fanelli”
Identification, analysis and inference of point
mutations associated to drug resistance in bacteria:
a lesson learnt from the resistance of Streptococcus
pneumoniae to quinolones
David Sasah Staid
XXXIII cycle
PhD Programme in Biochemistry
Tutor
Supervisor
Abstract
Antibiotic resistance is one of the biggest public health challenges of our time. Bacterial chemoresistance is the
phenomenon whereby bacteria develop the ability to survive and multiply in the presence of an antibacterial drug; the expression of a resistant phenotype may be due to three fundamental
mechanisms, including the expression of enzymes that inactivate the antibacterial drug, changes in the membrane permeability to antibiotics and the onset of point mutations causing the physical-chemical alteration of the antimicrobial targets. In recent decades, new antibiotic resistance mechanisms have emerged and are spreading globally, threatening human health and the ability to fight the most common infectious diseases.
Quinolones, a novel class of antibiotics that bind bacterial topoisomerases and inhibit cell replication, have been important in limiting the spread of penicillin- and macrolides-resistant Streptococcus pneumoniae. However, alarmingly, resistance to quinolones is spreading recently. Resistance is caused by the appearance of point mutations in the bacterial topoisomerase and gyrase. Some mutations are well known, but some are not and the information about known molecular mechanisms causing resistance is sparse and not systematically collected and organised. This means that it cannot be used to infer new
they may affect the drug binding. The lack of structured, organized, and reusable information about point mutations associated with antibiotic resistance represents a critical issue and is a common pattern in the field.
Here, we present a structural analysis of point mutations involved in the resistance to quinolones affecting the gyrase and
topoisomerase genes in Streptococcus pneumoniae. Results, extended to other bacterial species, have
been collected in a database, Quinores3D db, and can now be used – through a web server, Quinores3D finder - to analyze both known and yet unknown mutations occurring in bacterial
topoisomerases and gyrases. The development, testing and deployment of Quinores3D db and Quinores3D finder are further results of this PhD thesis.
Furthermore, structural data about point mutations associated with antibiotic resistance were used to train, test and validate a machine learning algorithm for the inference of still unknown mutations potentially involved in bacterial resistance to quinolone. As the performance of the algorithm, measured in terms of accuracy, sensitivity and specificity, is very promising, we plan to incorporate it in the web server to allow users to predict new mutations associated with bacterial resistance to quinolones.
Index
1. Introduction ... 7
1.1. A brief history of antibiotics ... 7
1.2. Antibiotics: classes and mechanism of action ... 9
1.3. Quinolones and fluoroquinolones ... 12
1.3.1. Quinolones target: DNA gyrase and topoisomerase IV ... 14
1.3.2. Structure of topoisomerase II enzymes ... 15
1.4. The antibiotic resistance ... 20
1.5. Mechanisms of quinolone resistance ... 22
1.5.1. Plasmid-mediated quinolone resistance (PMQR) ... 23
1.5.2. Reduced drug accumulation ... 23
1.5.3. Mutations within the QRDRs ... 24
1.6. Bioinformatics resources to fight antimicrobial resistance ... 25
1.6.1. The Comprehensive Antibiotic Resistance Database ... 28
1.6.2. PointFinder tool and database ... 29
1.7. Structural analysis of point mutations ... 30
1.9. Machine learning ... 33
1.9.1. Common ML algorithms employed in bioinformatics ... 35
1.9.5. Evaluation methods ... 41
2. Aim of the thesis ... 43
3. Materials and methods... 45
3.1. Topoisomerase and gyrase sequences ... 45
3.2. Pairwise and multiple sequence alignment ... 46
3.3. Homology modelling protocol ... 47
3.4. Structural analysis ... 50
3.4.3. Relative solvent accessible surface analysis... 52
3.4.4. Protein structure visualization and analysis ... 52
3.5. Primer design ... 53
3.6. Annotation of mutations and information retrieval ... 53
3.7. Web server technical specification ... 55
3.8. Data analysis and code scripting ... 56
3.9. Application of information theory on sequence analysis ... 57
3.10. Machine learning ... 57
3.10.1. Feature encoding for the predictor model ... 58
3.10.2. K-means clustering ... 59
3.10.3. Training, validation and test set ... 59
3.10.5. Metrics and statistical tests ... 61
4. Results ... 65
4.1. Three-dimensional modelling of topoisomeraseIV and gyrase protein structures ... 65
4.1.1. Topoisomerase IV ParC subunit model: a case study for the homology modelling procedure ... 66
4.2. Point mutation characterization and structural analysis ... 68
4.3. Quinores3D: a web server for the structural analysis of the molecular mechanisms of resistance to quinolones ... 69
4.3.1. Quinores3D db ... 70
4.3.2. Quinores3D finder ... 77
4.3.3. Quinores3D primers. ... 83
4.4. Analysis of point mutations associated with quinolone resistance ... 84
4.5. Cluster analysis of mutations associated with bacterial AR ... 87
4.5.1. Cluster I_III characterization ... 90
4.5.1.1. Characterization of the ParC 83 / GyrA 85 position ... 93
4.5.1.2. Characterization of the ParE 435 / Gyrb 435 position ... 98 4.5.1.3. Characterization of the ParE/GyrB 475 and ParE/ GyrB 474 positions
4.5.1.4. Characterization of the ParC 78 position ... 106
4.5.2. Cluster II characterization ... 108
4.5.3. Cluster IV characterization ... 110
4.5.4. Cluster V characterization... 112
4.5.4.1. Characterization of the ParC 79/ GyrA 81 position ... 117
4.6. Semi-automatized pipeline for the identification of point mutations in S. pneumoniae ... 120
4.7. Quinores3D_pred: machine learning algorithms for the prediction of point mutations ... 121
4.7.1. Training, test and validation set ... 122
4.7.2. Feature extraction ... 124
5. Conclusions ... 132
7
1. Introduction
1.1.
A brief history of antibiotics
The word antibiotic was first used by Selman Waksman in 1941 to describe any small molecule made by a microbe that
antagonizes the growth of other microbes1. Yet, the use of
antimicrobial agents can be dated back to 2000 years ago, when ancient Greeks and Egyptians were used to apply mouldy bread to treat open wounds2.
The development of anti-infective drugs is widely accredited to Paul Erlich, who developed the salvarsan, an arsenic-based pro- drugs to treat the agent of syphilis in 19103. Years later,
Gerhard Domagk at Bayer discovered the sulfonamide prodrug Prontosil, which like other sulfonamides was the first effective broad spectrum antimicrobial still in use today.
The turning point came in 1928 with the discover of penicillin by Alexander Fleming, which started the golden age of natural product antibiotic discovery that peaked in the mid-1950s, especially thanks to the studies of Selman Waksman who discovered numerous antibiotics made by soil-dwelling actinomycetes, including neomycin and streptomycin2.
Figure 1.1. Timeline showing the decade new classes of antibiotic reached the clinic2.
In just over 100 years antibiotics have drastically changed modern medicine and extended the average human lifespan by 23 years, but then, a gradual decline in antibiotic discovery and development and the evolution of drug resistance in many human pathogens has led to the current antimicrobial resistance crisis2.
9
1.2.
Antibiotics: classes and mechanism of action
Antibiotics are kind of antimicrobials commonly used to treat bacterial infections. They can either be produced naturally from other organism or by synthesis, and they act both killing or inhibiting the growth of bacteria4. They
are commonly classified on the basis of their mechanism of action.
1.2.1.
Antibiotics targeting the cell wallBacterial cells are surrounded by a cell wall made of a sugar polymer, the peptidoglycan, which results from the cross-linking of glycan strands by the action of a transglycosidases. The penicillin binding proteins (PBPs) allow the cross-linking between the D-alanyl-D-alanine portion of the peptide chains, which extend from the sugars in the polymers, and form cross-links with glycine residues5.
Drugs like beta-lactam antibiotics and glycopeptides act
inhibiting the cell wall synthesis. Since beta-lactam ring mimics D-alanyl-D-alanine portion, it has been proposed that PBPs interacts with the antibiotic and it is not available for the synthesis of new peptidoglycan, leading to cell wall lysis. Also glycopeptides binds to D-alanyl D-alanine, preventing the binding of the subunit with the PBP.
1.2.2.
Inhibition of protein synthesisThis class is heterogeneous and it includes different compounds able to inhibit protein biosynthesis by targeting the 30S or 50S subunit of the bacterial ribosome, including aminoglycosides, tetracyclines or macrolides. The aminoglycosides (AG) are positively-charged molecules which attach to the outer membrane leading to formation of pores allowing itself to penetrate inside the bacterium. AG's interact with the 16S r-RNA of the 30S subunit near the A site through hydrogen bonds, causing
misreading and premature termination of translation of mRNA. Tetracyclines, such as tetracycline, chlortetracycline,
doxycycline, or minocycline, act upon the conserved sequences of the 16S r-RNA of the 30S ribosomal subunit to prevent binding of t-RNA to the A site, while chloramphenicol interacts with the conserved sequences of the peptidyl transferase cavity of the 23S r-RNA of the 50S subunit, preventing binding of t-RNA to the A site of the ribosome.
Compounds like macrolides, lincosamides, and streptogramins B affect the translocation, by targeting the conserved sequences of the peptidyl transferase center of the 23S r-RNA of the 50S ribosomal subunit.
Oxazolidinones inhibit protein synthesis by binding to 23Sr RNA of the 50S subunit and suppress 70S inhibition and interact with peptidyl-t-RNA.
11
1.2.3.
Folic acid metabolism inhibitorsThere are two types of molecules interfering with the biosynthetic pathway of the folic acid metabolism: sulfonamides and
trimethorprim.. The former inhibit the dihydropteroate synthase in a competitive manner with higher affinity for the enzyme than the natural substrate, p-amino benzoic acid, while the latter inhibits the enzyme dihydrofolate reductase.
1.2.4.
Inhibitors of DNA replicationQuinolones are a group of broad spectrum synthetic antibacterial active against both Gram positive and Gram negative bacteria6,7. They act by inhibiting the activity of two
essential bacterial type II topoisomerases paralogues, DNA gyrase and topoisomerase IV, which are involved in the modulation of the chromosomal supercoiling required for DNA synthesis, transcription and cell division.
Fig 1.2. Class of antibiotics according to their mechanism of action5.
1.3.
Quinolones and fluoroquinolones
The quinolones are a family of antibiotics containing a bicyclic core structure related to the compound 4-quinolone (figure 1.3) . Nowadays four generations of compounds have been developed.
Nalidixic acid is considered as the first quinolone antibiotic, followed in 1962 by a 6-fluoroquinolone synthetized by the Imperial Chemical Industries (ICI)8. Quinolones became a widely
used drug class in the 1980s with the development of a second generation of compounds, the fluoroquinolones, in which the structure was modified with the introduction of a fluorine at the six position and a major ring substituent at position seven7 (figure
13 1.3), resulting in the increase of their activity. The second
generation includes enoxacin, norfloxacin, and ciprofloxacin, which were further modified by the
addition of a piperazine ring to the R7 position and addition of a cyclopropyl group to the R1 position (figure 1.3). This
combination made ciprofloxacin the first choice used against Pseudomonas aeruginosa today.
The third-generation quinolones are commonly used in the treatment of community-acquired pneumonia, acute sinusitis and acute exacerbations of chronic bronchitis. They include
levofloxacin, gatifloxacin, moxifloxacin and sparfloxacin, which are active against gram-positive organisms, like S. pneumoniae, and atypical pathogens such as Mycoplasma pneumoniae and Chlamydia pneumoniae9. These drugs result in the addiction of
several functional groups to the R7 position (alkylated
piperazine), R5 (–NH2, –OH, and –CH3) and R8 (Cl)8 (Figure
1.3).
The fourth generation class added significant antimicrobial activity against anaerobes9 due to the presence of nitrogen at
the R8, while a 2,4 difluorophenyl group at the N position improves the overall potency of the drug8.
Fig.1.3. Structure-activity relationships of quinolones drugs8.
1.3.1. Quinolones target: DNA gyrase and topoisomerase IV
Quinolones act by inhibiting the activity of two essential type II topoisomerases, DNA gyrase and topoisomerase IV, which are involved in the modulation of the chromosomal supercoiling7,8.
DNA gyrase uses the energy of ATP hydrolysis to actively introduce negative supercoils into DNA, relieving the torsional stress that accumulates in front of replication forks and
promoting local melting needed for transcript initiation by RNA polymerase. Topoisomerase IV is only able to relax positive supercoils and its major function is decatenation of the interlocked daughter chromosomes at the end of
15
1.3.2. Structure of topoisomerase II enzymes
The general structure of type II topoisomerases is an A2B2
hetero-tetramer composed of two pairs of identical subunits, GyrA and GyrB for gyrase, ParC and ParE for topoisomerase IV7,10.
The B subunit of E. coli DNA gyrase (GyrB) corresponds to the ParE subunit topoisomerase IV and to the N-terminal half of the eukaryotic enzymes, whereas the gyrase A subunit (GyrA) aligns with the ParC subunit and the C- terminal half of the eukaryotic enzymes12.
Fig 1.4. Sequence comparisons of topoisomerase IV and DNA gyrase8.
We can see that ParC and GyrA subunits consist of an N-terminal part, comprising a winged-helix domain (WHD), a tower domain, and a C- terminal beta-pinwheel domains (CTD) (figure 1.5, region coloured in green, blue, and purple). These domains bind to DNA and promote DNA
The N-terminal and C-terminal regions of the highly conserved ParE (GyrB) subunits form the ATPase- and Mg2+-binding-TOPRIM domains, respectively (figure 1.5, yellow and red regions)10. TOPRIM domains bind with the WHDs region,
forming the tetramer.
Fig 1.5. (A) Molecular structure of a bacterial topoisomerase II enzyme in complex with DNA (light green). Protein is colored according to the different domains15.
The main function of topoisomerases II is the formation of a transient DNA break involving a covalent-enzyme DNA intermediate named the ‘cleavage complex’10.
17 It has been proposed that the enzyme acts as a protein clamp
that captures DNA as described in detail in Figure 1.6.
Fig.1.6. Proposed model for topoisomerase II mechanism of DNA capture and transport10. The protein, in its open
conformation (the ‘open clamp’) binds the G- DNA (1-2). Binding of the ATP leads to dimerization of ATPase domains resulting in the closing of the N-gate and capturing of the T-DNA(3-6). The DNA T-segment moves through the opened DNA gate, then the G-segment is resealed and the C-gate is opened, leading to the release of the T-Segment(7-10). The closure of the C-gate and release of ADP opens the N-gate, converting the closed conformation to the open conformation, ready for another cycle(11-14).
1.3.3.
Mode of action of quinolones drugsQuinolones interfere with the topoisomerase II mechanism by reversibly binding to the cleavage complexes at the enzyme–DNA interface in the cleavage–ligation active site7,8,16 in a non-covalent
manner8, leading to the formation of a quinolone–topoisomerase–
DNA ternary complex that causes the DNA replication machinery to become arrested at blocked replication forks, resulting in an inhibition of DNA synthesis. Moreover, when the DNA tracking systems collide with these drug–DNA cleavage complexes, permanent chromosome breaks are generated, triggering the DNA stress responses which activates DNA repair enzymes. The effect is bacteriostasis at low concentrations of quinolone or bactericidal activity at lethal concentrations7,8.
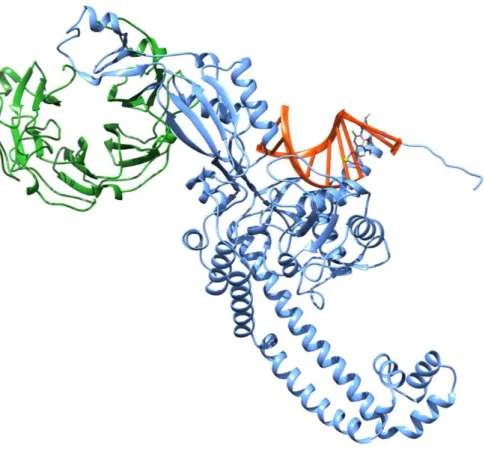
Studies on the X-ray crystal structures of topoisomerase IV/gyrase- drug- DNA complexes from different organisms
19 revealed that quinolone is hemi- intercalated into each DNA
strand and stacked against the DNA bases at the cleavage site (Figure 1.7). The drug molecule in close register to ParC S79/ GyrA S81 and ParC D83/GyrA E85 residues (S. pneumoniae numbering), and with a cluster of two glutamates and an arginine (E474, E475 and R456) on ParE/GyrB subunit16,17. Moreover, the
binding occurs through a water– metal ion bridge, where a noncatalytic Mg2+ ion coordinated with four water molecules forms a bridge for hydrogen bonding between the quinolone and the serine and acidic residues that act as anchor points to the enzyme7,16.
Fig 1.7. Details of binding mode of quinolone compound ACHN-245. Figure modified from the original work of Laponogov et al16.
1.4.
The antibiotic resistance
Antibiotic resistance (AR) is a natural process whereby microorganisms acquire the ability to resist the effects of antimicrobial drugs, due to the selective pressure that results from exposure to these compounds18,19. It is a global public
health threat and it is estimated to cause around 300 million premature deaths by 2050 with a loss of up to $100 trillion to the global economy20.
There are two general strategies for resistance. One comprises mechanisms that transfer resistance vertically from a bacterium to its progeny, for example mutations in gene(s) often associated with the mechanism of action
of the compound, the other includes the acquisition of external genetic determinants of resistance, likely obtained from
intrinsically resistant organisms present in the environment, through horizontal gene transfer like transformation,
conjugation or transduction19,20.
During thousands of years of evolution, bacteria have evolved sophisticated mechanisms of drug resistance to avoid killing by antimicrobial molecules20. These mechanisms include:
21 • modification of the antibiotic molecule, for example by
enzymes (acquired from horizontal gene transfer or synthetized by the bacterium itself) that perform chemical reactions like acetylation, phosphorylation, adenylation or the destruction of the drug: β-
lactamases are able to destroy the amide bond of the β-lactam ring, rendering the antimicrobial ineffective; • modification of the drug permeability. Bacteria have
developed mechanisms to prevent the antibiotic from reaching its intracellular or periplasmic target by decreasing the uptake of the antimicrobial molecule. Permeability modification can be achieved with the expression of efflux pumps which actively extrude the quinolone or passively by increasing the expression of porins;
• target site alterations, for example bacteria can produce proteins like TetM which interacts with the ribosome and remove the tetracycline from its binding site in a GTP-dependent manner, or PBP2a, a PBP that has low affinity for all β-lactams, including penicillins, cephalosporins and carbapenems. But one of the most common
alterations are point mutations of the protein target, like the ones occurring in the rpoB protein which confer resistance to rifamycin, or the well-known point mutations associated with quinolone resistance.
Fig 1.8. Common mechanisms of antibiotic resistance7.
1.5.
Mechanisms of quinolone resistance
The acquisition of quinolone resistance is associated with: plasmid-acquired resistance genes synthesizing either proteins capable of protecting the drug target(s), or drug-modifying enzymes or drug efflux pumps pumps7,8; other chromosomal
mutations lead to reduced drug accumulation by either
decreased uptake or increased efflux; chromosomal mutations that alter the quinolone target enzymes thus decreasing their affinity for the drug.
23
1.5.1. Plasmid-mediated quinolone resistance (PMQR)
This kind of resistance is due to plasmids carrying genes of resistance such as the Qnr, a protein of the pentapeptide repeats family competing with DNA in the binding to the topo IV and gyrase enzymes thus inhibiting the quinolone from entering the cleavage complex and reducing the number of double- stranded breaks on the chromosomes. This results in reduced quinolone toxicity to the chromosomes. Also a derivative of aminoglycoside acetyltransferase is able to acetylate the drug, thereby decreasing the quinolone activity7,8,21. Finally QepA, a plasmid-mediated
efflux pump, is able to decrease susceptibility to hydrophilic fluoroquinolones, especially ciprofloxacin and norfloxacin21.
1.5.2. Reduced drug accumulation
In Gram positive bacteria, quinolone resistance by increased efflux is due to the overexpression of three efflux pumps, NorA, NorB and NorC, causing four to eight fold increase in bacterial resistance to quinolones. In Gram negative organisms, the reduced or loss of expression of porins such as OmpF, OmpC, OmpD and OmpA or, the overexpression of OmpX, a
downregulator of porin expression has been implied in increased antibiotic resistance to quinolones and other drugs21.
1.5.3. Mutations within the QRDRs
The most common mechanism of high-level resistance in different bacteria species is due to mutations occurring in a specific region of the topoisomerase IV/ gyrase subunits, termed the quinolone resistance
determining region (QRDR)21. Mutations in this region result in
amino acid substitutions that structurally change the target protein and the drug-binding affinity of the enzyme7. The most common
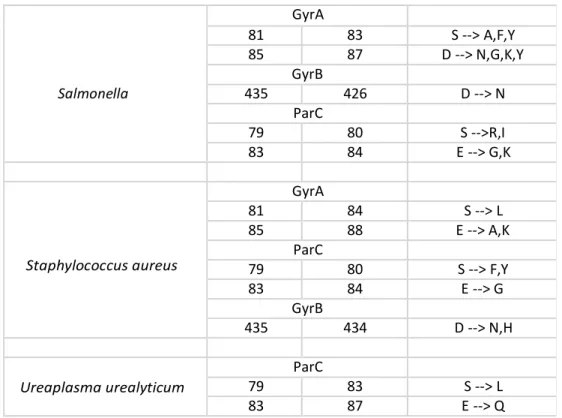
mutations are located on GyrA/ParC subunits and affect serine and acidic residues (aspartic or glutamic acid), Several bacterial species present similar mutations at equivalent positions8. In S.
pneumoniae the replacement of a serine residue in position 79 of ParC with a phenylalanine or tyrosine introduces a bulky amino acid side chain, which interferes allosterically with drug
binding11, while in the substitution in alanine, the non-polar side
chain prevents the interaction with the ligands and/or with the magnesium ion, with the subsequent loss of affinity22.
The additional mutation of the aspartic acid in position 83 of ParC can lead to the disruption of the metal ion water bridge required for the quinolone- protein interaction7,23. Mutations of
acidic residues in the QRDR of GyrB as well as in ParE in E. coli and other species have been shown to confer quinolone resistance, suggesting that they may interfere with charge interactions between drug and target21, for example in E. coli it
25 subunit makes it difficult for a positively charged group of
quinolones to associate with the protein22.
1.6.
Bioinformatics resources to fight antimicrobial
resistance
Given the increasing crisis represented by antimicrobial resistance (AMR), several bioinformatics tools and databases have been developed in order to better understand the
underlying molecular mechanisms24. Improvements in
next-generation sequencing technologies and computational methods are facilitating rapid antimicrobial resistance gene identification and characterization in genomes and metagenomes25.
Bioinformatics approaches can be categorized as those that focus on prediction of AMR, for example identifying the presence of resistance genes, and in those that study the mechanism of resistance, using gene expression profiles, metabolomics, structural analysis and so on24.
Several methods are sequencing – based , in which assemblies, genomic contigs or full gene sequences are annotated for resistance
determinants by comparing them against antimicrobial resistance reference databases, like the software PointFinder24,26.
Other methods avoid genome assembly and directly map reads (or k-mers) to the reference databases using pairwise alignment tools such as Bowtie225.
Also machine learning algorithms have been explored to predict the presence of genes of resistance. For example logistic
regression was implemented to differentiate between vancomycin-susceptible and vancomycin-intermediate Staphylococcus aureus27; Mykrobe predictor uses k-mer
screening to identify resistant SNPs and genes in M. tuberculosis and S. aureus28, while RAST uses AdaBoost classifier and
PATRIC database for resistant genes annotation29, and
DeepARGs is a new tool which uses deep learning to identify resistant genes30 in several different bacteria.
27 Table 1.1. List of different tools developed for the antibiotic
resistance identification. Table modified from the original published by Boolchandani et al25.
Other important resources are public databases collecting information about known genetic determinants of resistance and
Name Accessibility Year Description
Assembly-based tools
Resfinder31 Web and/or standalone 2012 Acquired AR genes
identification
ARG-ANNOT32 Standalone 2014 AR genes identification
RGI30
Web and/or standalone 2015
Predict resistomes, AR genes and poin mutations
ARGs-OAP33
Web and/or standalone 2016
Pipeline for AR genes detection
ARIBA34 Standalone 2017 AR genes identification
PointFinder Web and/or standalone 2018 AR point mutations
identification
NCBI-AMRFinder35 Standalone 2018 AR genes and point
mutations identification
Read-based tools
SRST236 Standalone 2014 Virulence and AR genes
identification
SEAR37
Web and/or standalone
(archived) 2015
Pipeline for AR genes identification
ShortBRED38 Standalone 2015 Protein families profiling
PATRIC29 Web 2016 Genomic analysis of
bacterial pathogens
SSTAR39 Standalone 2016 AR genes predictor
KmerResistance40 Web 2016 Gene identification
GROOT41 Standalone 2018 AR genes
profiling
DeepArgs42 Web 2018 AR genes
identification with machine learning
information from multiple studies that include antimicrobial susceptibility testing. Generalized databases (like CARD or ARDB) deal with mechanism information and cover several classes of antibiotics, while specialized databases focus on a specific compounds or bacterial species, for example Lactamase Engineering Database (LacED) provide information on β-lactamases, or MUBII-TB-DB which provides information on resistance in Mycobacterium tuberculosis25.
1.6.1. The Comprehensive Antibiotic Resistance Database
CARD30 is a curated database which provides nucleotide and
protein sequences of genes of resistance, a resistant SNPs database, and a controlled vocabulary, the Antibiotic Resistance Ontology(ARO). The ARO is organized in three branches: determinant of Antibiotic Resistance (ARO:3000000), antibiotic molecule (ARO:1000003) and mechanism of antibiotic resistance (ARO:1000002)43. Each new AMR determinant is manually
curated by a dedicated team, and the process includes review of the scientific literature, and adding of annotation from external publications. As of September 2019 CARD included 4336 ontology terms, 2923 AMR determinants, 1304 resistant variant mutations and 2648 curated publications.
Moreover, CARD offers its own tool, known as Resistance Gene Identifier (RGI), which predicts AMR genes and mutations from submitted genomes using different tools such as Prodigal
29 included with the AMR detection model30. RGI can detect
functional homologues of antimicrobial resistance proteins and mutations conferring antimicrobial resistance25.
1.6.2. PointFinder tool and database
PointFinder has been developed for the detection of point mutations associated with drug resistance and it is an extension of ResFinder, a well- known web server for the identification of acquired antimicrobial resistance genes.
PointFinder consists of a nucleotide database with reference sequences (nucleotide sequences of genes susceptible to
antibiotics) and a point mutation database containing information on codon positions and substitutions. Given a query sequence, the tool uses BLASTn to match the sequence in the nucleotide
database , then the program goes through each alignment comparing each position for the query (sequence found in input sequence) with the corresponding position in the subject
(database sequence). All mismatches are compared with the point mutation database26 and the variations related with AR are
highlighted.
1.6.3.
NCBI-AMRfinderPlus databaseNCBI-AMRFinderPlus35 is a tool for the identification of
acquired resistance genes using NCBI’s curated AR database and curated collection of Hidden Markov Models (HMMs).
This database derives from the Pathogen Detection Reference Gene Catalog, a non-redundant database of bacterial genes related to antimicrobial resistance. This includes highly curated, AMR-specific genes and proteins from the Bacterial
Antimicrobial Resistance Reference Gene Database (BioProject PRJNA313047) and point mutations35.
1.7.
Structural analysis of point mutations
Amino acid substitution is one of the basic events that can drive evolution, leading to a variety of consequences on protein stability and function44 or interfering with the binding of a drug
to its target. Point mutations in a protein sequence may result in a change or loss of the native structure or the binding site, which in turn may cause a change or loss of function, and ultimately may yield different phenotypes45. These effects depend on various
factors, including the type of protein and the structural context in which it occurs. For these reasons, structural analysis is
necessary to understand and ideally predict the effects of a mutation46.
Amino acid substitutions can have locally repercussions but also long ranges effects. The replacement can introduce unfavorable hydrophilicity or hydrophobicity, or charges shift, or even modify the relative amino acid solvent accessibility47. Moreover
salt bridges and hydrogen bonds can be affected48, like also
31 Eventually, mutations can cause conformational changes
perturbing the energy landscape49 and affect the binding affinity
of the protein to the drug46.
1.8.
Streptococcus pneumoniae as case study
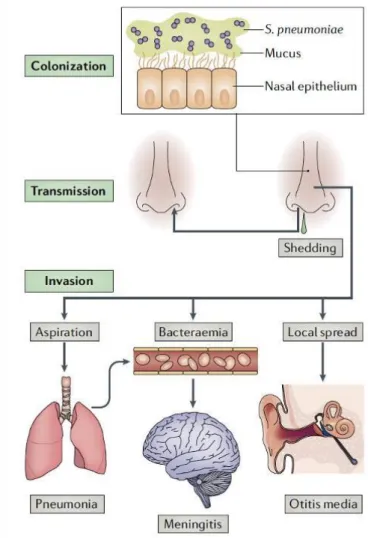
Also known as pneumococcus, this bacterium is a Gram positive, extracellular, opportunistic pathogen, regular common colonizer of the upper respiratory tract50,51. It causes frequent infections
associated with the airways, such as otitis media, sinusitis and bronchitis and it can be spread through airborne transmission51. S.
pneumoniae is found predominantly in the mucus layer overlying the epithelial surface of the upper respiratory tract, pneumolysin induces inflammation which stimulates secretions and increases shedding and bacterial load. In this way pneumococcus is spread in the environment and it can colonize a new host by evading clearance mediated by IgA1( immunoglobulin on mucosal surface) via a pneumococcal zinc metalloprotease ZmpA. Then the bacterium expresses two enzymes,
peptidoglycan-N-acetylglucosamine deacetylase (PgdA) and attenuator of drug resistance (Adr), that modify its peptidoglycan and render it resistant to the lytic effects of lysozyme facilitating colonization are adherence to host cells and tissues, and evasion of clearance by mucociliary flow. Local spread, aspiration or seeding to the bloodstream results in invasive inflammatory diseases51.
According to the World Health Organization (WHO), the bacterium is the fourth most frequent microbial cause of fatal infection, and the most common cause of bacterial pneumonia and
meningitis50. Included as one of 12 priority pathogens, the
continued high burden of disease and rising rates of resistance to penicillin and other antibiotics have renewed interest in
prevention of the pneumococcal infections51.
Fig 1.9. The life cycle of Streptococcus pneumoniae and the pathogenesis of pneumococcal disease51.
33
1.9.
Machine learning
Machine learning (ML) is a branch of artificial intelligence that is able to learn from experience in order to predict future events or scenarios that are unknown to the computer52.
Experience exists in the form of training datasets, which the machine learner uses to build a general mathematical model about that domain.
Nowadays, ML is used in a large number of bioinformatics areas such as genomics, proteomics, microarrays, systems biology, evolution, text mining53,54.
Fig.1.10. Application fields of machine learning in bioinformatics54.
ML algorithms may be broadly classified as Supervised learning, a learning mechanism that infers the underlying relationship between training data and a target variable, minimizing the error for a given set of inputs. The training data comprise feature vectors and a desired output value (the class label).
35
Unsupervised learning algorithms are designed to discover
hidden structures in unlabeled datasets, in which the desired output is unknown. The goal of ML in this case is to hypothesize representations of the input data for efficient decision making, forecasting, and information filtering and clustering52.
There are several steps in the development of a machine learning algorithm:
1) Data collection
2) Preprocessing of data, like formatting, cleaning by removing missing data or by
normalization/standardization, sampling to remove redundancy
3) Transformation of the data specific to the algorithm, for example feature scaling or decomposition
4) Training on the dataset and evaluation on the test set to verify its effectiveness and performance
5) Application of the validated model to perform an actual task of prediction
1.9.1. Common ML algorithms employed in bioinformatics
Several algorithms are widely used in bioinformatics such as logistic regression, support vector machines, classification trees, random forest, and nearest neighbour54. Also deep learning is
being incorporated in vast majority of analysis pipelines, due to the advent of the big data era in biology55.
For example clustering algorithms have been successfully applied to gene expression analysis on sequence data from tumors56. Random Forest has gained popularity and it is
becoming a common standard tool, especially in the context of low-dimensional data57. Databases that store
DNA, RNA, protein sequences and macromolecular structures are growing exponentially. The size and complexity of these data require the use of advanced computational tools, like neural networks58.
1.9.2.
K-means clusteringKnown as Lloyd’s algorithm, the K-means clustering clusters data by separating a set of N samples into K disjoint subsets (or clusters) Sj , each described by the mean 𝜇𝑗. The means are
called ‘centroids’ of the cluster.
𝐾
𝐽 = ∑ ∑ |𝑥𝑛 − 𝜇𝑗|2 𝑗=1 𝑛∈𝑆𝑗
The algorithm consists of a two-step re-estimation process: first data point are assigned to the cluster whose centroid is closest to that point, then each centroid is recalculated to the mean of all points assigned to it. These two steps are repeated until a threshold is reached, such that there is no further change in the assignment of data points. In other words, it is repeated until the centroids do not move significantly52,59.
37 mutations related to antibiotic resistance, in order to identify clusters of mutations with structural commonalities.
1.9.3.
Random forestRandom forest (RF) is a class of methods that use a
classification tree as the base classifier54. As the name suggests,
it consists of a number of individual trees that works as an ensemble: n predictors are combined to solve a classification or estimation problem through averaging52. The basic unit (base or
weak learner) is a binary tree constructed using recursive partitioning scheme and it is typically grown using the
methodology of the Classification and Regression Tree: starting from the root node, the process involves splitting among all the possible splits at each node. The resulting
child nodes are the purest52,60 . RF uses a two-stage
randomization for the growth. Instead of using all the variables to split a three node, the algorithm selects at each node of each tree a random set of variables that are used as candidates to find the best split60.
The RF can be summarized in a set of steps52:
1) From the original dataset n bootstrap samples are selected to construct B trees.
2) For each sample a tree is grown. 3) At each node of the three:
b) Features that provide the best split perform the binary split on that node
c) The next node selects another set of variables and performs the preceding steps
4) Take the majority vote of all the B subtrees.
In simple terms, each individual tree makes a class prediction: the class with the most votes becomes the model’s prediction. Compared with logistic regression, k-means and neural
networks, random forest was the best performing machine learning algorithm on our dataset of structural features of point mutations associated with antibiotic resistance.
1.9.4.
Artificial neural networksArtificial neural networks (ANNs) are algorithms vaguely inspired by biological neural networks61. The basic unit is the
artificial neuron or ‘perceptron’, a classifier that, using a threshold activation function, separates two classes by a linear discrimination function54.
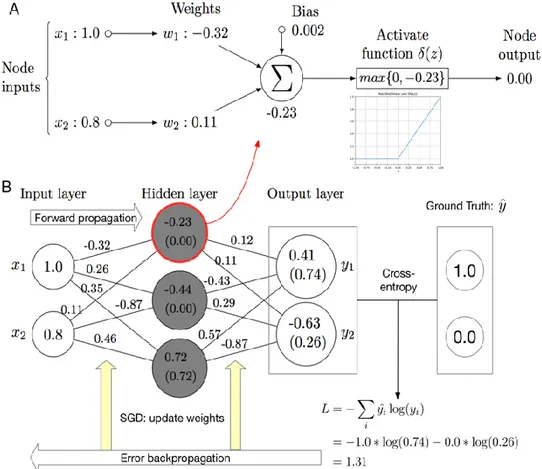
39 Fig 1.11. Figure of an artificial neuron52.
The inputs are connected to the neuron through weighted connections emulating the dendrite’s structure. The summation (Σ), the bias (b), and the activation function (𝜃) play the role of the cell body. The propagation of the output is analogous to the axon in a biological neuron52.
In the ANN, the perceptrons are connected together in consecutive layers. A layer of neurons is a “column” of neurons that operate in parallel, the output of the layer is the vector output, which is formed by the individual outputs of neurons.
In order to perform classification, the ANN is trained with a non- linear function which express the hidden relationship between the features (x) and the label (v), training the parameters (w) and making the model fit the data55. The standard algorithm adopted
is the forward-backward propagation52,54,55. At the beginning the
network is initialized randomly, then the network run and the output is compared with the target value to get the difference (loss or error). Then, the error back-propagation and optimization
help adjust the parameters of the model, making the output as close to the target value
as possible.
The most commonly used activation functions are ReLU for the inner layer and Softmax for the output layer, loss functions are cross-entropy for classification and mean squared error for regression. The optimizers include
stochastic gradient descent (SGD), Momentum, Adam55.
41 input layer, an hidden layer of three neurons and an output
layer55.
We tested ANN on our dataset but random forest proved to be more accurate.
1.9.5. Evaluation methods
A possibility when developing predictive models is that the algorithm is over-fitted on the existing data, resulting in a drastic performance drop when it is applied in practical studies with novel data62. An example evaluation method is
cross-validation, in which all data are used as both
training and test dataset. It is considered as a compromise solution when the number of available samples is very limited62.
In binary predictors there are two classes (0 or 1, True or False, resistant vs susceptible … ) and for each sample in the test set we have a real label and a predicted label. The real label indicates the class the sample really belongs to, while the predicted label is the output of the predictor62. We can count the
outcomes in the form of false positive (FP), true positive (TN), false negative (FN) and true negative (TN) and represent the combinations of predicted and actual values in a table called
Fig 1.13. Confusion matrix, positive and negatives are the two possible classes, TP= outcome is correctly identified as positive, TN= outcome is correctly identified as negative, FP=outcome is incorrectly identified as positive, FN=outcome is incorrectly identified as negative.
43
2. Aim of the thesis
The extensive use (and misuse) of antibiotics has led to the spread of resistant bacterial pathogen strains, causing a severe problem worldwide. Action must be taken quickly in order to stem this situation.
Quinolones are a new class of antibiotics that bind bacterial topoisomerases and inhibit bacterial cell replication. They have been important in limiting the spread of penicillin- and
macrolides-resistant bacteria like Streptococcus pneumoniae. However, alarmingly, resistance to quinolones has recently appeared in S. pneumoniae strains and other bacteria. According to the World Health Organization (WHO), S.
pneumoniae is the fourth most frequent microbial cause of fatal infection, and the most common cause of bacterial pneumonia and meningitis. Due to the threats this bacterium poses especially for the elderly and the children,
S. pneumoniae was chosen as a case study for this work.
This PhD project focuses on characterizing the molecular mechanisms of the resistance to quinolones caused by the appearance of point mutations, and in using this information to develop bioinformatics tools for both the analysis and the
inference of point mutations associated with antibiotic resistance (AR). In this thesis, for brevity, we will refer to point mutations associated with AR as “resistant mutations” and to residue types
appearing in reference or susceptible sequences as “wild-type residues” or “susceptible residues”.
Specifically, the aim of this thesis consists in:
1. performing a sequence and structural analysis of the mutations involved in the resistance to quinolones in Streptococcus pneumoniae and in
other bacterial species. Since quinolones bind to the gyrase and topoisomerase enzymes involved in DNA replication, these enzymes were studied in detail, their three-dimensional structure was modelled where needed and “resistant mutations” were mapped onto the structure;
2. developing and testing machine learning methods for the detection and prediction of mutations involved in antibiotic resistance;
3. developing and deploying a database collecting structural information on point mutations associated with resistance to quinolones;
4. developing, testing and deploying a web server for the structural
analysis, characterization and visualization of variants detected in sequence positions associated with quinolone
45
3. Materials and methods
3.1.
Topoisomerase and gyrase sequences
Reference nucleotide sequences for the non-pathogenic S. pneumoniae R6 strain were retrieved from the NCBI nucleotide database63 with the following accession IDs:
NC_003098.1:752241-754721 for the parc gene, NC_003098.1:749887-751830 for pare,
NC_003098.1:c1097931-1095463 for gyra, NC_003098.1:715818-717764 for gyrb.
Reference protein sequences for S. pneumoniae R6 strain were retrieved from the NCBI protein database63with the following accession IDs: NP_358351.1 for ParC, NP_358350.1 for ParE, NP_358692.1 for GyrA, NP_358309.1 for GyrB. Protein sequences associated with quinolone resistance of other bacteria (see table 4.1) were obtained from CARD ‘model variants’ database30 and redundant sequences were removed. Susceptible
sequences were obtained from UniprotKB-Swiss-Prot using the proteins name (‘GyrA’,’ParC’,’GyrB’,’ParE’) as keywords and selecting only proteins from bacteria. Records with the keyword ‘antibiotic resistance’ and ‘quinolone’ were added to the CARD resistant sequences. Among the susceptible sequences, we chose the topoisomerase IV and gyrase subunits of the organisms analysed as reference sequences from which we extracted the susceptible amino acids. When it was not possible to retrieve the
wild-type reference sequence for a given bacterium from UniprotKB-SwissProt, the reference susceptible sequence deposited in CARD was used. We collected all the sequences with the point mutations causative of drug resistance from CARD , but we noticed that for some variations, the
corresponding resistant protein sequence with the mutation was not present in the database. For this reason, we mutagenized in silico the susceptible reference sequence from UniprotKB-SwissProt, replacing the wild type amino acid with the resistant variant.
3.2.
Pairwise and multiple sequence alignment
The Blast suite (https://blast.ncbi.nlm.nih.gov/Blast.cgi)64 was
used to perform several tasks. MakeblastDB was utilized to generate the Blast reference nucleotide and protein databases for the topoisomerase IV and gyrase proteins. Blastx was
implemented in the Quinores 3D web server to translate the nucleotide query sequence into the corresponding amino acid sequence using the Bacterial, Archaeal and Plant Plastid genetic code. Blastp also was incorporated into the Quinores3D web server and in Quinores3D_pred to perform pairwise alignment between the protein query sequence and the reference sequence. Multiple sequence alignments of resistant (MSAs) and
susceptible sequences were carried out using Muscle 3.8.31 tool65 and Clustal Omega web server
47 software was also installed in the web server to run MSA
using the user’s input sequence and the susceptible reference on the fly.
For the interpretation of the alignments, we used the Jalview version 2 software, a free program for multiple sequence alignment editing, visualization and analysis67. MSAs were
represented with the Clustal color scheme, which highlights amino acids according to their properties (e.g. hydrophobic residues are shown in blue, positively charged in red, polar in green). Also, from Jalview we annotated the amino acid property conservation (measurement of the conservation of
physicochemical properties in a MSA column) and the alignment quality.
Since Jalview cannot be embedded in an HTML page, in order to show pairwise alignments and MSAs generated by
Quinores3D, we incorporated a Javascript sequence alignment viewer, JSAV68, in the HTML output page. The sequence
numbering of the reference is shown above the alignment, conserved residues are represented as dots, and mutations using 1-letter code (Figure 4.7 A).
3.3.
Homology modelling protocol
No experimentally determined structures comprising the whole protein are available neither for the S. pneumoniae
separate homology models were built for the subunits ParC, ParE, GyrA and GyrB. Homology modelling was performed with the software MODELLER v9.2369 and templates’
searching was carried out with the HHpred70 server.
Protein sequences were downloaded from the NCBI with IDs NP_358351.1 for ParC, NP_358350.1 for ParE, NP_358692.1 for GyrA, NP_358309.1 for GyrB.
These sequences were submitted to the HHpred server to search for three – dimensional protein structures in Protein Data Bank (PDB)71 to be used as templates. Yet, full
homologous protein structures are not present in PDB from other bacteria. We chose to generate a multi-template model for each subunit, including a template covering the N-terminal and one the C- terminal regions. From the HHpred output, templates were chosen taking into consideration first the structures with lowest Evalue, and then among them the structures with the best resolution.
For GyrA the experimentally determined 3D structure PDB 4Z2C (chain A, resolution 3.19 Å) and 1SUU72 (resolution 1.75
Å) were chosen as templates for the N-terminal and C- terminal, respectively; for GyrB, 4Z2C (chain C) and 3ZKB73 (resolution
2.90 Å, chain I); for the ParC subunit of
topoisomerase IV PDB 3RAE74 (chain B, resolution 2.90 Å), PDB
1ZVU (resolution 3 Å) and 1WP575 (resolution 1.79) were chosen
49 respectively, while for ParE 3RAE chain C and 5J5P76 (resolution
1.97 Å, chain B).
To run MODELLER and evaluate the results we used the version implemented in Chimera, setting the number of models as 20 and selecting also the ‘thorough optimization’ option, which optimizes more thoroughly than the default one.
Resulting models were chosen based on the Discrete Optimized Protein Energy (DOPE) score77 and on the QMEAN Z-score78
calculated with the SWISS-MODEL web server79. Loops were
refined with the ‘DOPE method’ implemented in MODELLER. We also built the full protein – DNA – magnesium – quinolone complexes for topoisomerase IV and gyrase with Chimera by importing DNA, quinolone and magnesium coordinates from the 3D structure of 3RAE for the former and the structure of 4Z2C for the latter.
Protein Sequence ID template ID Chain Resolution (Å) ParC NP_358351.1 3RAE B 2.90 1WP5 A 1.7 9 1ZVU A 3.0 0 ParE NP_358350.1 3RAE C 2.90 5J5P I 1.9 7 GyrA NP_358692.1 4Z2C A 3.19 1SUU A 1.75 GyrB NP_358309.1 4Z2C C 3.19 3ZKB A 2.90
Table 3.1. List of PDB IDs, chains, and related resolution of the proteins chosen as templates for the four subunits. Protein sequence IDs are from NCBI .
Homology modelling was also implemented in Quinores3D and in machine learning pipeline in order to generate the 3D
structures starting from resistant and susceptible sequences, but the protocol was modified: instead of a multi- template model, we used the previous generated protein models as templates; moreover, we generated just one model using the
‘fast/approximate’ option. These modifications were required in order to speed up the process of model building and simplify its integration inside the machine learning and Quinored3D finder pipeline.
3.4.
Structural analysis
3.4.1. Quinolone binding site analysis
The interactions between residue side chains and the drug were analyzed with Chimera both for the wild type and the mutated proteins. Variations and the residues at 5 Å of distance were selected with the selection (‘sele’) command. Inside a selection, hydrogen bonds are calculated with the findhbond function, whereas contacts and clashes are detected using the findclash function with the following parameters: overlap -0.4 and allowance
51 Findclash identifies interatomic clashes and contacts based on
Van der Waals (VDW) radii, where clashes are unfavorable interactions where atoms are too close together and contacts are all kinds of direct interactions such as polar and nonpolar, favorable and unfavorable (including clashes). The overlap between two atoms (i,j) is defined as the sum of their VDW radii (VDWr) minus the distance between them (d) and minus an allowance, that takes into account the contribution of probable hydrogen-bonded pairs:
𝑜𝑣𝑒𝑟𝑙𝑎𝑝𝑖𝑗 = 𝑉𝐷𝑊𝑟𝑖 + 𝑉𝐷𝑊𝑟𝑗 – 𝑑𝑖𝑗 – 𝑎𝑙𝑙𝑜𝑤𝑎𝑛𝑐𝑒𝑖𝑗
3.4.2. Electrostatic analysis
Electrostatic analysis was carried out in a region of the protein, comprising the position of interest and all residues within 5 Å from it. Ligands were not taken in consideration and therefore removed.
Charges and potentials were calculated with the APBS (Adaptive Poisson- Boltzmann Solver)80 software, which
requires as input a PQR file, that is a modified PDB file with charges calculated for each atom. This file was generated with the PDB2PQR software using the PARSE force field and the PDB file containing the residues at 5 Å from the mutation as input.
From the PQR file, APBS generated the potential map and calculated the charge density and electrostatic potential.
3.4.3. Relative solvent accessible surface analysis
The relative accessibility surface (RASA) for each single amino acid in the protein model was calculated using the function ‘SASA’ in Biopython, which runs the DSSP47 software needed
for this computation.
3.4.4. Protein structure visualization and analysis
For the interactive visualization and analysis of molecular structures, Chimera software was used81. This tool was widely
utilised to show the topoisomerase IV and gyrase structures, build the 3D models, map the variations, analyze the
interactions between quinolones and the side
chains of the mutated amino acids, show bonds and contacts between atoms. Chimera was also used to generate high quality figures shown in Results.
Due to the fact that Chimera GUI cannot be used directly in a web page we implemented the Quinores3D code with the WebGL (https://www.khronos.org/webgl/) applications for molecular visualization. These applications were embedded as libraries in the result web page to display the protein of interest, map the mutations on the structure, show distances from the residues and drug or magnesium, show the quinolone binding site and the interactions (H-bonds, contacts), and display the electrostatic surface.
53
3.5.
Primer design
Quinores3D Primers allows users to design forward and reverse PCR primers given a nucleotide sequence using the open-source Primer3 software82.
Results are outputted in a table reporting, for each primer, the sequence, the content in GC, melting temperature, stability of any basepairing of that primer to itself, stability of any basepairing of the 3' end of the primer to itself, formation of hairpin loops.
We generated a set of primers (forward and reverse) specific for mutagenesis purposes. The nucleotide sequences carrying the quinolone resistance variations were submitted to Primer X web server
(‘https://www.bioinformatics.org/primerx/documentation.html’) , a tool developed for the automated design of mutagenic primers for site-directed mutagenesis. Primers with optimum values of length and GC content were collected into the Quinores3D Database, ‘primers’ table.
3.6.
Annotation of mutations and information retrieval
Several sources were used to gather information and annotate mutations, including literature searching and use of specialised databases.
Information was retrieved from the literature by searching Pubmed with terms like ‘Streptococcus pneumoniae’,
‘quinolone’, ’resistance’, ‘mutations’, ‘not efflux’. Scientific articles were manually downloaded and inspected; mutations occurring in the quinolones targets were manually annotated and information about the Minimal inhibitory concentration (MIC) and the effect of amino acid replacements on drug-binding were collected.
CARD, PointFinder and NCBI pathogens databases were also downloaded and quinolone resistance variations reported for bacteria other than S. pneumoniae were extracted. All the raw data were organized in a dataframe using the Pandas library. Then after careful inspection, data were re- organized as the Quinores3D Database.
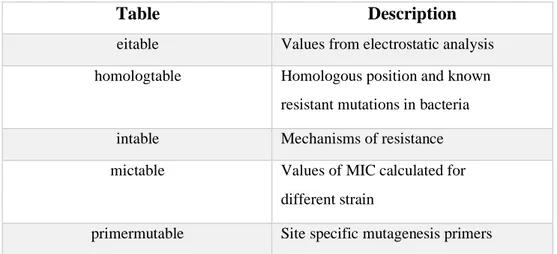
Quinores3D Database is a relational database developed in MySQL version
8.0.21. The database is organized in six tables (refer to Table 3.2):
Table Description
eitable Values from electrostatic analysis
homologtable Homologous position and known
resistant mutations in bacteria
intable Mechanisms of resistance
mictable Values of MIC calculated for
different strain
55 Table 3.2. Short description of Quinores3D database tables.
3.7.
Web server technical specification
The Quinores3D server has been deployed on the Cloud@ReCaS-Bari (http://cloud.recas.ba.infn.it/) IaaS
(Infrastructure as a Service) cloud platform, on a virtual server with 4 virtual CPUs, 8 GB of RAM and a public IP address. Three virtual volumes (120 GB total disk space) have been added to the virtual machine, to store data of the MySQL database, of the BLAST database, and of the Apache web server, respectively.
The choice of deploying the service on cloud resources has been made in order to warrant scalability and elasticity, since it is possible to transparently and quickly enlarge or shrink the resources assigned to the virtual machine, and split the components of the logical architecture (web server, DBMS, scripts) on different servers, if needed. This approach will also allow in the future the possibility to easily migrate the service to another cloud resource provider, without any lock-in problem. Future plans include the refactorization of the involved software using a microservice architecture, in which each component is executed in a Docker83
sasatable Values for relative accessible surface
container on a Mesos/Chronoscluster, and the web frontend is deployed on a different machine with respect to the one(s)
hosting the MySQL and BLAST databases, which are isolated on private networks.
The creation of the corresponding Docker images is currently undergoing. All code is open source and fully available on GitHub platform (https://github.com/) that provides hosting for software development and versions control.
3.8.
Data analysis and code scripting
Python version 3.6.5 (https://www.python.org/) was used for data manipulation, parsing, analysis and web server development. The Python CGI (Common Gateway Interface) module was used to write the main code of the web server, to generate dynamically webpages and to interact with external programs incorporated in the server. Pandas library (https://pandas.pydata.org/) was used for data analysis while Matplotlib (https://matplotlib.org/) for data representation and graph plotting.
For sequence and structure analysis, Biopython was used84. It was
largely
implemented in the web server but also for all the script
developed for the mutations analysis or for the machine learning preparation, using modules such as SeqIO for sequence parsing, AlignIO for Blast result and MSA manipulation, PDB module for the structural analysis.
57
3.9.
Application of information theory on sequence analysis
Conservation analysis from a MSA can be used for predicting functionally important residues in protein sequences and in ligand binding85. Also variability provides important information about
proteins86.
Shannon entropy (H) can be used as a measure of residue diversity and residue conservation87. It can be defined as a
measure of uncertainty about the identity of objects in an ensemble:
𝑁
𝐻(𝑋) = − ∑ 𝑃𝑖𝑙𝑜𝑔𝑃𝑖 𝑖=1
where Pi was the probability of given amino acids and N was the number of letters in a sequence88. To normalize between 0
and 1 the logarithm is taken to base 20.
In our work, Shannon entropy was applied to study the conservation of the key positions involved in drug resistance among the bacteria.
3.10. Machine learning
Machine learning algorithms were developed with the Python library Keras (https://keras.io/) and scikit-learn59 using Google
3.10.1.
Feature encoding for the predictor model
Each amino acid was represented as a vector of numeric descriptors. We used the AAindex database90 and the iFeature
package91 to encode the following features: hydrophobicity,
hydrophilicity, side chain mass, residue volume
(BIGC670101),steric parameter (CHAM820101), SASA in folded structure (CHOC760102), molecular weight
(FASG760101), size of side chain (DAWD720101), normalized Wan der Vaals volume (FAUJ880103), Net charge of amino acid (KLEP840101), hydropathy index according to Kyte – Doolitle (KYTJ820101), Polarity (GRAR740102), Bulkiness
(ZIMJ680102), Side-chain contribution to protein stability (kJ/mol) (TAKK010101), Free energy of solution in water, kcal/mole (CHAM820102), charge transfer capability
(CHAM830107_list). Moreover, relative solvent accessibility calculated with DSSP, electrostatic potential, net charge, charge density calculated with APBS at a range of 5 Å, distance from drug and magnesium were added as structural features.
Finally, we divided the amino acids according to their physicochemical properties into 5 groups, assigning for each group a unique number (apolar:0, aromatic:1, polar:2, positively charged:3, negatively charged:4). This number was added as additional descriptor.
59
3.10.2.
K-means clustering
Cluster analysis was performed with the K-means algorithm implemented in scikit-learn with the following parameters: max iterations 300, relative tolerance 1e-4 , initial step 10. The number
of clusters was chosen using the ‘elbow method’83 implemented in
the kneed library (‘https://pypi.org/project/kneed/’) . For clustering the following features were selected: relative solvent accessibility, electrostatic potential, net charge, charge at a range of 5 Å, distance from drug and magnesium, residue volume (BIGC670101), hydrophobicity index according to Argos et al., 1982 (ARGP82010), free energy of solution in water, kcal/mole (CHAM820102), steric parameter (CHAM820101), residue accessible surface area in tripeptide (CHOC760101), relative mutability (DAYM780201), solvation free energy (EISD860101), molecular weight (FASG760101), polarity (GRAR740102), side chain volume (KRIW790103), hydropathy index according to Kyte – Doolitle (KYTJ820101), surrounding hydrophobicity in folded form (PONP800101), amphiphilicity index(MITS020101), bulkiness (ZIMJ680102), radius of gyration of side chain
(LEVM760105), and amino acid groups as descriptors.
3.10.3.
Training, validation and test set
For both clustering and predictor models the data set was represented by the residues collected as described above, for a total of 362 residues. Among them, 22 were removed because their phenotypic effect was unknown. After the structural analysis
we decided to also remove positions that were unlikely to be involved in drug resistance, for a final set of 201 resistant variations and 115 wild type ones.
For the classifier algorithms, we oversampled the original data with the SMOTE function from Imbalanced learn package
(‘https://imbalanced- learn.readthedocs.io/en/stable/’), in order to obtain a proportion of 50% resistant and 50% susceptible
residues.
The dataset was randomly splitted into training and validation sets, with a proportion of 70% for the training and 30 % for the validation set, using the sklearn train_test_split function. The test set was obtained taking all the resistant and wild type sequences from CARD and UniprotKB SwissProt that were not used in the training set.
Point mutations were selected as described above. In order to avoid incorrect assessment, we randomly choose 500 resistant and 500 susceptible residues for the test set.
Data were normalized using the MinMaxScaler function from sklearn.
3.10.4.
Random forest and neural network
model
The random forest classifier was set with the following parameters: n_estimators=300,61 The neural network model is composed of three hidden dense layer:
• First dense layer with shape 16 and ‘ReLU’ activation function • Dropout layer with a dropout rate of 20%
• Second dense layer of shape 8 and ‘ReLU’ activation function • Output layer with 1 node and sigmoid activation function For the compiler the ‘adam’ optimizer was used and for the loss measure the ‘binary crossentropy’ function. Accuracy and loss for training and validation were used as metrics to evaluate the performance of the model.
Model was trained for 200 epochs with a batch size of 32.
3.10.5.
Metrics and statistical tests
For the structural analysis we adopted the Mann–Whitney U test implemented in the SciPy library92 to select the most relevant
features. Features with a p-value higher than 0.05 were
considered not statistically significant and they were not included in the analysis.
For the evaluation of our machine learning models, k -fold cross validation, accuracy, logarithmic loss, F1-score, precision, recall, confusion matrix and ROC curves were used.
In the k-fold cross-validation, the dataset was randomly
partitioned into k parts of equal size. Each fold is left out of the design process and used as a test set. The model is trained k times,