• Non ci sono risultati.

New insights into fish growth parameters estimation by means of length-based methods

N/A
N/A
Protected

Academic year: 2021

Condividi "New insights into fish growth parameters estimation by means of length-based methods"

Copied!
202
0
0

Testo completo

(1)

NEW INSIGHTS INTO FISH GROWTH

PARAMETERS ESTIMATION BY MEANS OF

LENGTH-BASED METHODS

Ph.D. thesis in Evolutionary Biology and Ecology

XIX cycle

University of Rome “Tor Vergata”

AUTHOR

SUPERVISOR

Giuseppe Magnifico

Prof. Stefano Cataudella

(2)
(3)

A tutte le donne

della mia famiglia

(4)
(5)

«… Ma chi glielo fa fare?»

«Mah… Soltanto lo spirito di

servizio»

«Ha mai avuto dei momenti di

scoramento, magari dei dubbi,

delle tentazioni di abbandonare

questa lotta?»

«No, mai!»

(6)
(7)

Index

ABSTRACT ... 9

1. INTRODUCTION

... 11

1.1. Growth models and equations ... 12

1.2. Estimating growth parameters ... 20

1.2.1. Direct

methods

...

21

1.2.2. Back-calculation

...

22

1.2.3. Analysis of length-at-age data ... 23

1.2.4. Analysis of length-frequency data ... 25

1.2.4.1. Distributions

... 27

1.2.4.2. The appearance of modes ... 28

1.2.4.3. Assumptions of length-frequency analysis ... 31

1.2.4.4. Limits of length-frequency analysis ... 32

1.2.4.5. Classification of length-based analysis methods ... 34

1.2.4.5.1. Parametric

methods

...

35

1.2.4.5.1.1. Graphical

methods

...

35

1.2.4.5.1.2. Computational

methods

...

38

1.2.4.5.2. Non-parametric

methods

...

40

1.2.4.5.2.1. ELEFAN (Electronic LEngth-Frequency

Analysis) ... 40

1.2.4.5.2.2. SLCA (Shepherd’s Length-Composition

Analysis) ... 43

1.2.4.5.2.3. The PROJection MATrix (PROJMAT)

method ... 44

1.2.4.5.2.4. The Powell-Wetherall method ... 48

1.2.4.5.2.5. Summary: non-parametric method ... 50

2. OBJECTIVES ... 55

3. MATERIALS AND METHODS ... 57

3.1 The Birgé and Rozenholc algorithm ... 57

3.2 The Expectation-Maximization algorithm

... 58

3.3 Simulated data

... 60

3.3.1 Generation of hypothetical populations ... 61

3.3.2 Choice of parameters ... 61

3.3.3 The Birgé and Rozenholc algorithm ... 62

(8)

3.4 Real data

... 66

3.4.1 The Birgé and Rozenholc algorithm ... 67

3.4.2 The

Expectation-Maximization

algorithm

...

67

4. RESULTS

... 69

4.1 Simulated data

... 69

4.1.1 The Birgé and Rozenholc algorithm ... 69

4.1.1.1. The ELEFAN I method ... 69

4.1.1.2. The Bhattacharya method ... 76

4.1.2 The

Expectation-Maximization

algorithm

...

89

4.2 Real data

... 95

4.2.1 The Birgé and Rozenholc algorithm ... 95

4.2.1.1. The ELEFAN I method ... 95

4.2.1.2. The Bhattacharya method ... 96

4.2.2 The

Expectation-Maximization

algorithm

...

98

5. DISCUSSION ... 101

5.1 The Birgé and Rozenholc algorithm ... 101

5.2 The Expectation-Maximization algorithm

... 108

6. CONCLUSIONS AND FUTURE PERSPECTIVES ... 113

7. REFERENCES

... 115

8. APPENDIX A

... 133

8.1 The Birgé and Rozenholc algorithm ... 134

8.2 The Expectation-Maximization algorithm

... 135

8.3 Generation of hypothetical populations ... 139

8.4 Sub-sampling

... 141

8.5 The ELEFAN I method ... 142

8.6 The Bhattacharya method ... 146

9. APPENDIX B ... 153

(9)

Abstract

ABSTRACT

Growth studies are an essential instrument in the management of fisheries

resources since they contribute to estimates of production, stock size, recruitment

and mortality of fish populations. In the event that age becomes too complex to be

established through an observation of hard parts (otoliths, scales, opercula, rays,

spines and vertebrae), information about the demographic parameters of fish and

other animal populations can be obtained by length-frequency analysis.

Length-frequency distributions are commonly analyzed by means of histograms, although

they present several problems, such as a dependency on the origin, width and

number of class intervals, discontinuity of data and fixed bandwidth. This can

largely affect the reliability of the estimates, i.e. the results become dependent upon

the data massage operated by the user.

The main aim of this research study was an attempt to contribute to

overcome some of the above-mentioned limits. Two algorithms were tested in terms

of their capacity to produce accurate estimates of fish growth parameters. The first,

the Birgé and Rozenholc algorithm, has recently been proposed for determining the

optimal number of intervals to be used for building a regular histogram from

available data. The second, the Expectation-Maximization (EM) algorithm, has

become a popular tool in statistical computations involving incomplete data, or in

similar problems, such as mixture estimation.

Monte-Carlo simulations of fish populations having different biological

characteristics were generated to test the efficiency of these two algorithms. A

Monte-Carlo procedure tests the ability of certain methods to describe the

underlying structure of a simulated dataset, and thus makes it possible to predict the

conditions under which a method will be successful or will fail in performing

research studies concerning natural populations.

In this regard, two marine species were chosen as representatives of

opposing life-histories: the Red mullet (Mullus barbatus Linnaeus, 1758), a

fast-growing species, and the European hake (Merluccius merluccius (Linnaeus, 1758), a

slow-growing species. A length sample of size n = 100,000 was generated for each

(10)

species. In order to evaluate the performance of the Birgé and Rozenholc algorithm

using samples of different sizes, 100 random datasets containing 100, 200, 500 and

1000 length measurements respectively were extracted from each hypothetical

population. Data for each of these 800 length datasets was then partitioned using (i)

the method proposed by Birgé and Rozenholc and (ii) the classical interval widths (1

cm for the Red mullet and 2 cm for the European hake).

These simulated length-frequency distributions were then analyzed by

means of two length-frequency methods: (i) the ELEFAN I method, a

non-parametric approach, and (ii) Bhattacharya’s method, a non-parametric approach. For the

present study, a Scilab 4.0 version of the ELEFAN I and the Bhattacharya methods

was developed. Since the EM algorithm functions best with samples of size n ≥

1000, only the 100 random datasets each containing 1000 length measurements were

used to run the algorithm. Two length datasets were also used to test the

performance of the two algorithms on field data.

The results obtained using the two algorithms were very encouraging. The

Birgé and Rozenholc algorithm proved to be an easy and efficient method for

choosing the number of intervals in a histogram. On the other hand, the efficiency of

the EM algorithm became evident for the two species considered both with

simulated and real length data.

In conclusion, the results obtained using the two algorithms seem to be of

great interest and their methodological and theoretical contribution to this field

could represent a landmark in the enhancement of stock assessment studies.

(11)

Introduction

1. INTRODUCTION

Information about fish age, development and growth is a cornerstone in

fishery research and management. By development we mean the sequencing of

life-history stages while growth is a measure of size change of the whole body or some

body part; growth rate is also a measure of size change as a function of time. Growth

depends upon the quantity and quality of food ingested, with inadequate nutrition

delaying both growth and developmental transitions, such as the timing of onset of

sexual maturation. When food is limited the onset of maturation may be delayed for

months or years until good feeding conditions arise. In other words, the timing of

sexual maturation appears to be more closely associated with size than age, leading

to the concept that maturation is achieved once a “critical size” has been reached.

Furthermore, during adulthood, fecundity or gamete production may be related to

body size, and alterations in nutrition can lead to either depression or enhancement

of the reproduction.

Thus food availability, size increase, accumulation of energy reserves and

timing of sexual maturation and reproduction are closely linked. These factors, in

turn, relate to production, that is determined by the reproduction and growth rates of

individuals within the population and by their mortality rate. These functional rates

determine the population dynamics over time, as well as the structural elements of

the population, such as biomass, density and size-frequency distribution, at any point

in time. As such, information about age and growth is extremely important in almost

every aspect of fisheries (Jobling, 2002).

Organisms grow because greater body size confers a number of advantages

that can ultimately result in higher lifetime reproductive output. Larger individuals

are subjected to lower predation mortality: the faster they grow the more rapidly

their mortality rate decreases. Larger individuals can also store more energy and

thus become less susceptible to fluctuations in food supply and environmental

extremes. Fecundity and ability to compete for mates and resources also increase

with size. Large size can be attained by hatching at a large size, growing fast or

(12)

growing for a long time. Furthermore, delaying the age at maturity provides more

energy for growth (Jennings et al., 2001).

1.1.

Growth models and equations

Growth equations are used to describe changes in the length or weight of a

fish with respect to time, although the constants derived from such empirical

equations may have no exact biological meaning. Numerical expression of growth

may be based on absolute changes in length or weight (absolute growth), or

changes in length or weight relative to the fish size (relative growth). Length

almost always increases with time, whereas weight can either increase or decrease

over a given time interval depending upon the influence of the various factors that

affect the deposition and mobilization of body materials.

Measurements of growth in relation to time provide an expression of

growth rate. Growth in length can usually be modelled by using an asymptotic

curve which tapers off with increasing age. Growth in weight is usually sigmoidal,

i.e. the weight increment increases gradually up to an inflection point from where

it gradually decreases. Thus, growth rates are constantly changing, and the

absolute growth increments will be different for different sizes of fish (Jobling,

2002).

A number of mathematical functions have been used to describe growth

curves, including the Gompertz, the logistic, and a range of straight-line and

exponential approximations (Beverton and Holt, 1957; Ricker, 1979; Weatherley

and Gill, 1987; Prein et al., 1993; Elliott, 1994). Among all the models, the von

Bertalanffy growth function (VBGF) (Fig. 1.1) is the most frequently used to

describe growth in fishes, and in many other marine organisms, because the

constants can be readily incorporated into early stock assessment models. The

function was derived by considering growth as the balance between anabolic and

catabolic processes in an organism (von Bertalanffy, 1934, 1938, 1957; Pauly,

1980).

(13)

Introduction

Fig. 1.1 The von Bertalanffy growth equation (Diagram taken from Sparre and Venema, 1998).

The simplest derivation of the VBGF is:

)

(

L

L

k

t

L

δ

=

δ

(1)

where L is length, t is time, L

is the asymptotic length of the fish, that is the

maximum length to which a fish would grow on average if it lived to be very old

age, and k is the Brody growth, a growth constant expressing the rate at which

length approaches the asymptote (Gulland, 1969; Ricker, 1979).

Note that L

is not necessarily the same as the maximum fish length in a

sample; if the fish mortality rate is very high, or the fishing gear only takes smaller

fish, then the maximum length in a length-frequency sample may be considerably

smaller than L

. On the other hand, if many old fish are present in the sample, L

may be smaller than the length of the largest fish, because individual variability will

ensure that some fish grow up to a larger than average maximum length and others

to a smaller one. The parameter L

is meant to describe the average growth of the

whole fish population.

The parameter k could be considered as a measure of the fish growth

rate; however, it does not correspond to the expected increase in length per unit

time. In the limit, this is actually given by

(14)

⎟⎟

⎜⎜

L

t

L

k

1

(

)

(2)

so that for a given value of k, the growth rate declines over time as fish length

approaches L

. Nevertheless, the larger k is, the faster the fish grows towards

L

.

Whereas L

has a straightforward interpretation, that of k is more

complex because it describe the instantaneous growth rate (

δ

L

δ

t

) relative to the

difference between L

and the fish length at a given time. Integration of the VBGF

gives:

)

1

(

k

(

t

t

0

)

t

L

e

L

=

(3)

where L

t

is the length-at-age t and t

0

is the theoretical age of the fish at zero size

under the assumption that the von Bertalanffy growth curve describes growth

accurately right down to zero length. Even if this unlikely assumption is true, fish

will be born with some positive length, so t

0

will usually be negative.

The equation (3), commonly called the non-seasonal von Bertalanffy

growth function (Fig. 1.2), provides a perfectly adequate description of growth for

many species.

Fig. 1.2 A non-seasonal von Bertalanffy growth curve with parameters L

= 100, k = 1.0 and t

0

= -0.2

(15)

Introduction

In some species (particularly those found in tropical waters) there is clear

evidence that growth rate can vary with the seasons. In these species, growth is

normally fast in summer when water temperature is high and slow in winter when

water is cold. Some species may even cease growing entirely over winter. For

species showing clear seasonal growth, the non-seasonal von Bertalanffy growth

curve will not be sufficient to describe growth accurately (especially for relatively

short-lived species).

The most frequently used seasonal version of the von Bertalanffy growth

curve was originally proposed by Hoenig and Choudary Hanumara (1982). This

allows sinusoidal variation in growth rates throughout the year according to the

formulation:

(

)

(

)

[

]

[

e

k

t

t

S

t

t

s

S

t

t

s

]

L

t

L

(

)

=

1

0

+

sin

2

π

(

)

sin

2

π

0

(4)

where

π

2

Ck

S

=

(5)

This equation has two parameters in addition to the usual non-seasonal

von Bertalanffy growth curve (L

, k and t

0

). The first, C, measures the relative

amplitude of seasonal oscillations in growth rate. When C = 0, growth is

non-seasonal, while when C = 1 the seasonality is sufficiently large so that growth

ceases for just an instant during the year. Values of C greater than 1 correspond to

shrinkage in length at some stage of the year. The second parameter, t

s

, describes

the phase of seasonal oscillations. With -0.5 < t

s

< 0.5, t

s

denotes the time of the

year corresponding to the start of the convex segment of sinusoidal oscillation.

That is equivalent to say that t

s

+ ½ is the time of the year when the growth rate is

slowest, i.e. equivalent to the “winter point”. It is to ensure that winter point can

vary from the start to the end of the current year that leads to the stated range for

t

s

.

Figure 1.3 shows a Hoenig and Choudary Hanumara seasonal growth curve

with parameters L

= 100, k = 1.0, t

0

= -0.2, C = 0.8 and t

s

= -0.3. Note that, with C

near 1, growth rate varies noticeably during the year, but it never actually ceases at

(16)

any time. The growth rate is slowest each year at the winter point, which occurs 0.2

(= -0.3 + 0.5) time units from the beginning of each year.

Fig. 1.3 A Hoenig and Choudary Hanumara seasonal growth curve with parameters L

= 100, k = 1.0, t

0

=

-0.2, C = 0.8 and t

s

= -0.3 (Diagram taken from Kirkwood et al., 2001).

Although negative growth (shrinkage) has actually been observed for some

species, this is the exception rather than the rule, and in most cases negative growth

is highly unlikely. Instead, for species exhibiting marked seasonal variation of

growth rate, it is more likely that there may be a period during the year when growth

ceases.

A model incorporating this phenomenon was proposed by Pauly et al.

(1992). In this model,

)

1

(

q

t

L

e

L

=

(6)

where

(

)

[

s

]

[

Q

(

t

t

s

)

]

Q

k

t

t

Q

Q

k

t

t

k

q

=

(

0

)

+

sin

sin

0

(7)

and

(

NGT

)

Q

=

1

2

π

(8)

(17)

Introduction

The Pauly et al. curve has six parameters: the usual non-seasonal

parameters (L

, k and t

0

), and three others. The first of these, t

s

, has essentially the

same meaning as in the Hoenig and Choudary Hanumara growth curve. It now,

however, needs to be understood to imply that the middle of the period of no-growth

during a year occurs at time t

s

+½ from the start of the year. The second parameter,

usually written NGT (standing for No Growth Time), measures the length of the time

period when no growth occurs. Thus, there is no growth between the times t

s

+½ -

½NGT and t

s

+½ + ½NGT. For the rest of the time, when fish is growing, it follows a

Hoenig and Choudary Hanumara growth curve with the same values of L

, k, t

0

and

t

s

, but with C = 1. The third additional parameter, t´, is described by Pauly et al.

(1992) as being obtained “by subtracting from the real age t the total no-growth time

occurring up to time t”.

Figure 1.4 shows a Pauly et al. seasonal growth curve with parameters L

=

100, k = 1.0, t

0

= -0.2, t

s

= -0.3 and NGT = 0.5. Please note that growth ceases

between times -0.05 and 0.45 (-0.3 + 0.5 ± 0.5/2) each year. Noteworthy that the

overall rate at which the maximum length is approached is rather little for this

growth curve than for the other two (despite the fact that all the other parameters

have the same values). This is because growth ceases for half of each year.

Fig. 1.4 A Pauly et al. seasonal growth curve with parameters L

= 100, k = 1.0, t

0

= -0.2, t

s

= -0.3 and

(18)

The deterministic nature of the von Bertalanffy equation is the primary

problem when individual variability in growth exists, each fish in a group being

considered to grow according to the model, but with its own L

and k (Isaac, 1990).

Individual variability is probably the most arguable point in fitting the

VBGF to average values, since one should expect that individual variability of the

growth parameters is a general feature of natural populations. Every individual

organism is a unique result of heredity and environment, so that no two organisms in

a population will grow at precisely the same rate and attain the same size at a given

age (DeAngelis and Mattice, 1979).

In addition, some authors have shown that if a deterministic age-length-key

is used to determine the age frequency of catches on the basis of length data, biased

results are to be expected (Kimura, 1977; Westrheim and Ricker, 1978).

Bartoo and Parker (1983) incorporated a stochastic element in von

Bertalanffy’s relationship to improve this approach. Sainsbury (1980) developed a

stochastic version of the VBGF for size increment data, stating that k is

underestimated when data obtained from populations with different individual

growth parameters are analyzed with the classical deterministic equation. Finally,

Schnute (1981) developed a new growth model, which includes von Bertalanffy’s,

Gompertz’s and other models as special cases, and in which an error component for

the size-at-age is incorporated.

Differences in growth patterns, caused by intrinsic or extrinsic factors,

between different populations or for different time periods, are extensively reported

(e.g. Bannister, 1978; Craig, 1978; Anthony and Waring, 1980; Molloy, 1984). On

average, these differences reflect modifications in the budget of catabolism and

anabolism, and are expressed by the parameters L

(or W

) and k (Beverton and

Holt, 1957).

The parameter L

of the VBGF is proportional to the ratio of anabolism and

catabolism, and the parameter k is proportional to the coefficient of catabolism.

Thus, factors affecting the food consumption rate should produce changes in the

coefficient of anabolism and therefore in L

. Other differences in general metabolic

(19)

Introduction

activity should affect the rate of catabolism to a greater extent and therefore the

parameter k (Beverton and Holt, 1957).

It is reasonable to suppose that the differences between the individuals of a

given population, living under similar external conditions, should mostly be caused

by genetic factors and affect the general metabolic activity of the organism, and

probably indirectly both L

and k. The proportion of the variability of each

parameter may differ according to the species, but a preliminary investigation

conducted by Isaac (1990) suggests that k varies more strongly than L

.

In many fish the variance of length-at-age increases with increasing age

(see e.g. Steinmetz, 1974; Westrheim and Ricker, 1978). This led some authors to

suppose that L

constitutes the major source of variation between individuals (Jones,

1987; Rosenberg and Beddington, 1987). However, in other fish (mostly pelagic and

fast-growing species) and in many molluscs, variance in length-at-age first increases

and then decreased (Wolf and Daugherty, 1961; Feare, 1970; Poore, 1972; Bartoo

and Parker, 1983), suggesting that it is the variance of k which is high. Moreover, it

could also be argued that bias in the determination of age or sampling errors are the

cause of such data patterns. Natural variability and sampling bias obviously produce

a combined effect in the data, and therefore, further investigation is needed to clarify

their contribution, separately (Isaac, 1990).

The parameters of the von Bertalanffy growth equation are widely used to

describe fish life histories. Across species there are close relationships between these

parameters and those describing other aspects of the life history, such as age and size

at maturity. In general, high k is associated with young age and small size at maturity,

high reproduction output, short life span and low asymptotic length. Conversely,

species with low k have older age and bigger size at maturity, lower reproductive

output, longer life spans and greater asymptotic length (Jennings et al., 2001). The

relationships are consistent with trade-offs, such that change in a single trait which

may increase lifetime reproductive success is countered by a corresponding decrease

in fitness resulting from compensatory changes in other traits (Roff, 1984, 1992;

Stearns and Crandall, 1984; Stearns, 1992). The resulting balance between traits is

expected to maximize lifetime reproductive output. The result of compensatory

(20)

trade-offs is that while fish exhibit many life histories, the parameters that describe life

histories are consistently related (Beverton and Holt, 1959; Beverton, 1963, 1987,

1992; Charnov, 1993). These relationships have practical value because relatively

simple measures of life history, such growth rate and age at maturity, can be used as

surrogates for parameters such natural mortality which are needed in studies of

population dynamics but are much harder to measure (Jennings et al., 2001).

The relationship between life-history parameters suggests that the evolution

of fish is governed by some very general features of life-history trade-offs (Charnov,

1993). These features may result from the evolutionary advantage of completing as

much potential growth as possible within a life span that is constrained by the

forcing effects of temperature on metabolic processes and growth (Beverton, 1963).

Thus, age at maturity and reproductive output would be adjusted to life span and

lifetime reproductive output would be maximized. Deferred maturity increases

reproductive value at maturity because reproductive output increases with size and

age. However, fish consistently mature at 65-80% of the maximum size they can

attain (Beverton and Holt, 1959; Beverton, 1963). At this size, the costs of delaying

maturity (risk of mortality) exceed those of slower growth that results from

allocating resources to reproduction (Jennings et al., 2001).

1.2.

Estimating growth parameters

The estimation of growth curve parameters holds a central position in the

fish stock assessment process (Pauly et al., 1984; Rosenberg and Beddington, 1988)

and may be based either on the absolute or relative age of the individual fish or else

may be derived from length-frequency data analysis.

Ageing fish through the identification of periodic marks on hard structures

(otoliths, scales, opercula, rays, spines and vertebrae) and tagging experiments are

expensive and time-consuming procedures. In many aquatic animals (e.g., squids,

crustaceans, shrimps and various tropical fishes) age determination is very difficult

or even impossible.

The above mentioned disadvantages of age-based methods have led to the

development, especially in the 1980s, of new methods for analysis of length data for

(21)

Introduction

growth and stock assessment. Length data can be collected rather cheaply and

generally do not require specialized staff (Isaac, 1990). Moreover, many biological

and fishery processes, e.g. fecundity, predation, selection by gear, etc., are better

correlated with size (length or weight) than with age. Many characteristics of marine

ecosystems are, broadly speaking, functions of the size of the organisms (Caddy and

Sharp, 1986). Thus, there are good theoretical justifications for preferring

length-based over age-length-based methods (Gulland, 1987; Pauly, 1987).

There are four approaches or methods to estimate growth curve parameters,

each with its particular advantages: direct methods, back-calculation, analysis of

length-at-age data and analysis of length-frequency data (also called length- or

size-based methods).

1.2.1. Direct methods

The most accurate method for collecting age, hence growth, data is direct

observation of individuals, but this is time-consuming and costly. However, under

some circumstances it may be the only way in which reliable age and growth

information can be obtained.

The method involves the release of marked fish into natural systems.

Marked fish may be either hatchery-reared fish of known age or fish captured and

marked in situ. The marked fish are later recaptured. The period of time between

release and recapture is quantified and combined with data relating to changes in

body size for use in growth models (Jobling, 2002). Data collected using the

mark-and-recapture method can also be used to gain insights into the size of the fish

population, provided that certain assumptions are met (Youngs and Robson, 1978;

Guy et al., 1996). One prerequisite of the method is that the released fish can be

easily recognized at the time of recapture. In other words, the mark applied must be

distinct and, if not permanent, at least long-lasting. Furthermore, if data from

marked fish are to be of value in the estimation of growth rates and population sizes,

the marks applied should not influence either growth or vulnerability of fish to

predators, i.e. mortality rates should not be affected (Jobling, 2002).

(22)

Several marking and tagging techniques are available (Laird and Scott,

1978; Guy et al., 1996, Campana, 2001). Fish may be marked by fin mutilation, hot

and cold branding or tattooing; marks may also be applied to the fish via

subcutaneous injections of dyes, liquid latex or fluorescent materials. There are also

many types of tags such as the anchor tag and the plastic flag tag, which are applied

externally, or as visible implant tags, coded wire tags and passive integrated

transponders (PIT tags), which are subcutaneous or internal. The advantage of tags

over other marking techniques is that tags can be numbered serially, allowing for

individual recognition. Chemical marks may be induced in the body tissues by

feeding, injecting or immersing the fish in solutions of a chemical that is taken up

and incorporated into the tissue in question. The hard calcified tissues, such as

scales, otoliths and skeletal elements, are the most common tissues used because

they incorporate certain chemicals permanently and in a form that can provide a

“time mark”. Examples of chemical markers include fluorescent compounds such

tetracycline and calcein, and metallic elements such us strontium and rare earth

elements. Chemical marking techniques are particularly valuable in validation

studies designed to cross-check fish age as determined by other methods

(Weatherley and Gill, 1987; Brown and Gruber, 1988; Casselman, 1990; Rijnsdorp

et al., 1990; Devries and Frie, 1996; reviewed by Campana, 2001).

1.2.2. Back-calculation

When the scales and other hard parts increase in size in proportion to the

fish size, they may not only be used in age determination but can also be considered

to represent a diary recording of fish growth history. Thus, using knowledge about

the relationship between size of the hard part and fish length, it may be possible to

back-calculate the fish length at a given age by examination of the positioning of the

various growth rings (Bagenal and Tesch, 1978; Weatherley and Gill, 1987; Devries

and Frie, 1996). The data required for back-calculation are the fish length at capture,

the radius of the hard part at capture (measured from the nucleus to the margin), and

the radius of the hard part to the outer edge of each of the growth rings (either

(23)

Introduction

usually carried out by one of four methods: the direct proportion method, the

Fraser-Lee method, various curve-fitting procedures or the Weisberg method (Bagenal and

Tesch, 1978; Devries and Frie, 1996). The choice of the method depends upon the

type of relationship between the fish length and the dimensions of the hard part used

in the back-calculation procedure.

The direct proportion method can be used when the relationship between

body length and hard-part radius is linear and has an intercept that does not differ from

the origin: in this case the growth of the hard part is directly proportional to the growth

in length of the fish. The Fraser-Lee method is applicable when the intercept of the

relationship between fish length and hard-part radius in not at the origin. Under these

circumstances, length at time t (L

t

) can be back-calculated using the formula:

[

L

a

R

]

R

a

L

t

=

(

c

)

c

t

+

(9)

where L

c

is the fish length at the time of capture, R

c

is the radius of the hard part at

capture, R

t

is the radius of the hard part at time t, and a is the intercept of the

regression line relating hard-part radius to fish length (Bagenal and Tesch, 1978;

Devries and Frie, 1996). Sometimes, the use of simple linear regression may be

precluded due to a lack of linearity between the dimensions of the hard parts and the

body, or because there are different body length to hard part relations among age

groups. Under such circumstances various curve-fitting procedures and covariance

analysis may be used to address the problems (Bagenal and Tesch, 1978; Bartlett et

al., 1984). The Weisberg method is more complex than the others. It involves a

modelling approach that enables age group and annual environmental effects to be

distinguished. Thus there is a separation and identification of changes in growth from

one time period to another, such as years of particularly good or poor growth, that may

be superimposed upon age effects (Weisberg and Frie, 1987; Weisberg, 1993).

1.2.3. Analysis of length-at-age data

The two constants of the VBGF, L

and k, can be estimated from

measurements of fish length at known fish ages (Gulland, 1969, Bagenal and Tesch,

1978; Prein et al., 1993). Before personal computer became widely available it was

(24)

difficult to fit the VBGF to length-at-age data, and several methods were developed

for the estimation of L

and k.

One method involves making a plot of the annual increment of length (L

t+1

-

L

t

) against length (L

t

), where L

t+1

- L

t

is length-at-age t+1 and L

t

is length-at-age t.

This gives a straight line with a slope of –(1 - e

-k

) and an intercept on the abscissa

(i.e. where L

t+1

- L

t

= 0) equal to L

. This equation is also known as the Brody

equation, as mentioned by Schnute and Richards (2002). This expression not only

establishes the constants in the VBGF but also provides an indication of the decline

in the rate of growth with age.

The constants of the VBGF can also be estimated from a plot of L

t+1

on L

t

,

the Ford-Walford plot (Ford, 1933; Walford, 1946). The fish growth rate slows with

age so that the plotted line gradually approaches a 45° line passing through the

origin. The two lines will intersect at L

, the point of intersection indicating when

the fish lengths at the start (L

t

) and the end (L

t+1

) of the growth period are identical,

i.e. the fish has ceased to increase in length, and the annual growth increment is

zero. The growth constant, k, can also be estimated from the plot of L

t+1

on L

t

because the slope of the line is equal to e

-k

.

Much work has been done on developing methods for fitting and testing

VBGF data, and with the advent of the personal computer, data handling has

become much easier (Gallucci and Quinn, 1979; Misra, 1986; Ratkowsky, 1986;

Cerrato, 1990, 1991; Xiao, 1994). Bayley (1977) pointed out that a weakness in

several of the methods is a lack of independence between the variables plotted. In an

attempt to overcome the problem, Bayley (1977) devised a method for the

estimation of the VBGF constants (L

and k) using measurements of instantaneous

growth rates (

δ

(ln

W

)

δ

t

) and a description of the length-weight relationship (W

= cL

m

). From these data Bayley (1977) derived an equation that led to a linear

transformation of the non-linear VBGF:

[

(

)

]

[

(

)

1

]

)

(

)

(ln

W

δ

t

=

m

L

k

L

L

=

mk

L

L

δ

(10)

or

(25)

Introduction

)

1

(

)

(

)

ln

(ln

W

2

W

1

t

2

t

1

=

mk

+

mkL

L

(11)

The latter equation has the form of a linear regression with a slope of mkL

,

the intercept is –mk, and a plotted line will intersect with the abscissa at 1/L

, where,

by definition, the instantaneous growth rate is zero. Thus, the constants of VBGF

can be estimated from successive measurements of length and weight, and

calculation of m in the length-weight relationship; instantaneous growth rate is

plotted against the reciprocal of fish length, the slope and intercept of the regression

calculated, and the VBGF constants are then estimated from the values obtained.

Bayley (1977) suggested that this method of analysis could be appropriate for the

estimation of the VBGF constants for tropical fish species in which age

determination may be extremely difficult. For these species growth is often

estimated from data collected following the recapture of released marked fish, where

it is not usually possible to control the time over which individual fish are at liberty.

Analysis of growth data using this methods does, however, require that there has

been a marked change in fish weight and length over the growth period.

1.2.4. Analysis of length-frequency data

The use of size frequency to investigate the growth of animals dates back to the

papers of the Danish biologist J. Petersen (1891, 1892) in which he presented length

measurements of fish and found that with temperate species breeding once a year it is

relatively easy to define a cohort by a year-class (a mode in the histogram showing the

frequency distribution). This cohort can be followed during the first part of its life by

tracing the corresponding modes in the histograms from the samples; but when they

approach their maximum size this is no longer possible because, by then, fish of different

ages have reached approximately the same size (Sparre and Venema, 1998).

Assessment analysis of exploited fish stocks requires some measure of

biological time. Traditionally, the measure of biological time has been age. However,

another measure of time is size and the simplest one to obtain, in many circumstances,

is length. Age is a linear measure of time while length is, except for very particular

circumstances or for a limited time or age span, a non-linear measure of time. Age

(26)

information is, however, often difficult and expensive to obtain. Data on the age of

individuals may contain substantial measurement error(s) and this added source of

uncertainty in the assessment process may have considerable influence.

In spite of the complication of working with a non-linear measure of time,

length-based methods of stock assessment are attractive for several reasons. Unlike

ageing information, length data are simple and cheap to obtain and quite large

samples are feasible. Length has the appeal of an intrinsically more biologically

meaningful attribute than age. Both fishing and natural mortality are likely to be

size-dependent rather than age-dependent. However, it is still necessary at the end of

the day to return to a linear time-scale. Not only length is a non-linear measure of

time but, more importantly, the relationship is unknown and must be estimated.

This, as with age data, introduces an additional source of uncertainty to the

assessment process. There is, in general, no best choice between an assessment

method structured by age or size. In either case the estimation problems are

substantial (Rosenberg and Beddington, 1988).

A vital component of any length-based model is a mean of estimating the

growth parameters of the animals in the population, in other words, a method of

determining the non-linear relationship between size and time. Size-based methods

can be used to obtain estimates of growth, and mortality, when fish are difficult, or

too expensive, to age using hard parts. The aim of these methods is to estimate

growth, and mortality, from the relative frequency in size classes. Fish are generally

born in discrete, often annual, cohorts, following an annual or seasonal breeding

season, and individuals grow in size throughout life towards an asymptotic size.

Size-frequency analysis looks for peaks of numbers in size classes to estimate the

mean sizes of successive cohorts at integer intervals of age, and at the relative

numbers in these cohorts to estimate total mortality rates. When properly used,

size-based methods should lead to the same estimates of growth and mortality, as other

techniques, although the sources and impacts of uncertainty are different. In some

cases, size-based methods have advantages over, or can complement, conventional

estimates based on direct ageing. Analytical methods for length-frequency data have

a long pedigree in fisheries science, but none of them works as well as one would

(27)

Introduction

wish, and as a consequence many fisheries research have dabbled in the sport of

inventing new methods at some stage or another of their careers (Pitcher, 2002).

The sizes of fish of similar age in a cohort vary about a mean. Fish

populations usually comprise several such cohorts, which are mixed together in a

sample. If we know the shape of the size distributions of the cohorts, we can try to

dissect a mixed sample into its constituent cohorts. Length-frequency plots from a

sample of a fish population are therefore mixtures of a series of overlapping length

distributions (Everitt and Hand, 1981). Length-frequency analysis aims to dissect the

mixture into its components. The average size and the relative abundance of the

component cohorts provide measures of growth and mortality. First, if we follow the

mean sizes in a series of samples, we can then estimate growth. Secondly, if we

follow the changes in numbers of a cohort with time, provided that the changes

accurately mirror changes in the underlying population, we can estimate the

mortality rates. Variation among individuals in mortality and growth can be thought

of as “smearing” the original cohort structure.

1.2.4.1. Distributions

It is generally assumed that the variation in length of any cohort follows a

normal distribution. The expected frequency, f, at length L for a normal distribution

of mean and standard deviation, is:

⎪⎭

⎪⎩

⎥⎦

⎢⎣

⎡ −

=

2

)

(

5

.

0

2

)

,

|

(

σ

µ

π

σ

σ

µ

L

e

dl

N

L

f

(12)

where N = sample size, µ is the mean length, σ is the standard deviation of the

lengths, dl is the class width and L is the mid-point of the class. Other distributions

are sometimes employed. The log normal, in which the lengths, means and standard

deviations are transformed to logs, may be appropriate for weight-frequency

analysis and sometimes for length-frequencies. The gamma distribution is also

sometimes used (Pitcher, 2002).

(28)

For a mixture of normal distribution we set N to total sample size and

obtain the expected frequency at length L as:

⎪⎭

⎪⎩

⎡ −

=

2

)

(

5

.

0

2

i

i

L

i

i

L

e

p

dl

N

f

σ

µ

π

σ

(13)

where N is now total sample size, p

i

is the proportion of this total in the ith age

group, µ

i

is the mean of the ith age group, and σ

i

is the standard deviation of the ith

age group. For h component, the problem for length-frequency analysis is therefore

to estimate the sets of proportions, means and standard deviations. The p

i

s must sum

to one, so we have (3h-1) parameters to estimate:

p

1

;

σ

1

; µ

1

;

p

2

;

σ

2

; µ

2

;

p

3

;

σ

3

; µ

3

;

… … …

p

h

;

σ

h

; µ

h

;

Statisticians have shown that mixtures of normal distributions are

identifiable (Yakowitz, 1969): that is, we can, in principle, determine all the

parameters in the mixture provided that the assumption of normality is valid and we

know exactly the combined probability. In practice, of course, we only have the data

histogram to estimate the latter. There is a more detailed discussion of this point in

MacDonald and Pitcher (1979).

1.2.4.2. The appearance of modes

Cohorts of fish which recruit at different times are consequently separated

in mean size. The appearance of separate modes in a size-frequency plot of a sample

taken from the whole population has long been interpreted by ecologists as revealing

age groups (e.g. Petersen, 1891). Within any one cohort there will be a spread of

size resulting from different birth dates and individual growth rates. This spread may

obscure the modal size of the separate cohorts.

(29)

Introduction

The conditions under which modes appear have been formally investigated.

For two components in a mixture, Behboodian (1970) showed that separate modes

will be seen (bimodality) if:

{

1

2

}

2

1

|

2

min

,

|

µ

µ

>

σ

µ

(14)

but even then, they will not necessarily be clear to the eye for small sample sizes.

Three main factors in the fish population conspire to reduce the separability

of modes in length-frequency data.

First, if fish grow according to the von Bertalanffy curve, as they approach

L

, the cohort means get closer together and are therefore less likely to reveal

modes. This is known as the “pile-up” effect (Fig. 1.5).

0

4

8

12

16

20

0

5

10

15

20

25

30

35

Length

Fr

eque

nc

y

0

10

20

30

0

5

Age

10

Le

ng

th

L

inf

Fig. 1.5 Diagram illustrating the “pile-up” effect. The larger diagram shows normal distributions of length

around the mean lengths of 10 successive annual cohorts. Inset: length-at-age projected (horizontally)

from each mean length at integer age (circles) on a von Bertalanffy growth curve (Diagram taken from an

animated spreadsheet available from http://www.fisheries.ubc.ca/projects/length.php).

Secondly, variance in length-at-age increases with length as fish get larger

and approach L

, and so age groups are more likely to overlap. For

(30)

randomly-varying L

, Rosenberg and Beddington (1987) show that modes will appear in a

two-cohort mixture if:

[

(

)

]

(

)

2

[

(

)

]

2

0

0

k

1

2

1

k

t

t

t

t

k

e

s

L

e

e

L

>

(15)

where s

2

L is the variance at length L. This function will vary with length, so that

separate modes are less likely at greater lengths if s

2

L increases. Unfortunately, the

way in which s

2

L changes with size can be quite complex and there has been no

rigorous investigation using actual fish growth. Rosenberg and Beddington (1987)

show that if differences in L

are the main source of variation between individual

fish, s

2

L increases with fish size. On the other hand, if most variation between fish is

in the growth parameters k, s

2

L peaks at about half of L

and then drops as fish

approach the asymptotic size. Empirical data usually show variance in length

increasing with size, so that for sizes up to 0.7 L

the assumption of a constant

coefficient of variation of length (COV-l) seems reasonable.

The first two problems above affect older age groups more seriously. But

the third mechanism, which may obscure modes, can affect young and old age

groups alike. If recruitment of cohorts is continuous, or extended over a large

portion of the year, the variance in length by age group will be large and modes may

be obscured from young ages on. Unfortunately, recruitment may occur over an

extended season in some tropical fisheries for which length-based methods are

otherwise ideal.

If modes are present, they probably reveal cohorts, but if modes are absent,

there can still several cohorts present. Moreover, if modes appear, the simple

graphical or approximate computer methods will give good results. If there are no

modes, one of the statistical methods will be needed. In their review of length-based

methods, Rosenberg and Beddington (1988) recommend the greater use of formal

statistical methods, which are not so dependent upon the appearance of modes.

Pitcher (2002) presents an index of overlap which will, in conjunction with

a consideration of sample size, indicate whether modes are likely to appear. This in

turn will allow the researcher to decide whether simple graphical or ad hoc methods

are likely to be adequate. The first step in the calculation of an index is to decide

(31)

Introduction

roughly what the likely means and standard deviations of the proposed age groups

are. The overlap index can then be calculated as follows:

[

] [

]

{

}

=

=

+

+

+

+

=

1

1

1

1

)

(

)

(

)

(

)

(

h

i

i

i

i

i

i

i

i

i

i

q

q

q

q

h

V

µ

σ

µ

σ

µ

σ

µ

σ

(16)

where q = 1.96 to give 95% limits, and h = number of age groups. This is then

repeated in order to compare several alternative hypotheses. The index V reflects the

average proportion by which the 95% zone (i.e. 19 out of 20 fish of this age) for the

age group is overlapped by the 95% zone for the next age group. When V is

negative, there is a very wide separation of the age groups. When V is greater than

about 0.25, modes disappear. The V for individual age groups can also be usefully

examined where the separation of adjacent ages differs across the length-frequency

plot.

1.2.4.3. Assumptions of length-frequency analysis

For length-based method to work, fish must recruit in discrete cohorts.

Discrete cohorts usually derive from separate spawning seasons, but there may be

more than one of these per year. The cohorts must remain discrete as the fish grow

older. This requirement may be relaxed to a certain extent for different methods of

analysis, but, generally, the methods work better the more discrete the cohorts and

the more separate they remain as they get older. This implies that the growth of

individuals in a cohort should be similar, i.e. the variability in growth rates among

individuals of the same ages is not large.

So there are two sources of variation in size within a cohort of fish:

• different birth dates within the spawning season;

• different growth rates among individuals.

The first of these can be accommodated by most length-based methods,

provided that the variance is not too large. But the second is a major problem for all

the methods, as it tends to destroy cohort structure (Pitcher, 2002).

A further assumption is that length-frequency data in your sample fully

represent the length classes in the fish stock. If they do not, then the sample data will

(32)

need to be adjusted to compensate for the selectivity of the sample gear. A net series

of tests for this employs the relationship among length at maturity, L

m

, age of

maximum yield-per-recruit, L

opt

, and temperature in order to evaluate the validity of

the length-frequency sample (Froese and Binholan, 2000).

The starting point in all analyses is the length-frequency distribution,

adjusted if necessary, with known class width and class boundaries. It is worthwhile

taking a lot of care over the class boundaries: lower bound, mid-point and upper

bound of the classes are all used in different methods.

1.2.4.4. Limits of length-frequency analysis

The use of modes in size frequency distributions of aquatic organisms have

been advocated as an attempt to identify groups of fish with similar age. This would

be the case if the sample of size is unbiased and the species under analysis

reproduces during a relatively short span of time at regular periods (King, 1995).

The life history characteristics determine the relative contribution of each age group

to the population and the sample, the distance between the mean lengths-at-age and

the amount of overlapping (Castro and Erzini, 1998; Erzini, 1990, Isaac, 1990).

Particularly in the case of older age groups, where overlapping is most significant

and large individuals may not be adequately represented, the ability to separate

mixture of distributions is affected by sample size and interval width (Hoenig et al.,

1987; Erzini, 1990, Isaac, 1990). Schnute and Fournier (1980) remark that

length-frequency analysis tends to lump the final age-classes together if they are in close

proximity or contain small percentages of fish. In such cases it may be impossible to

distinguish the final ages, and the best approach may be to assume that all fish

beyond a certain age comprise a single group.

Length-frequency distributions are commonly analyzed by means of

histograms and frequency polygons. In spite of their wide usage, these density

estimators may be too crude for many purposes (Tarter and Kronmal, 1976).

According to Fox (1990), four problems are encountered when using histograms:

1. Dependency on the origin. The investigator must choose the position of

the origin of the bins (very often by using convenient “round” numbers). This

(33)

Introduction

subjectivity can result to misleading estimations because a change in the origin can

change the number of modes in the density estimation (Silverman, 1986; Fox, 1990;

Scott, 1992).

2. Dependency on the width and number of intervals (bins). Smoothness

of the frequency distributions depends on both these parameters. The use of many

bins results in a noisy estimator, and on the other hand, few bins reduce

distribution details. Frequently, the number and width of the bins are determined

arbitrarily despite their importance. When data are grouped, it is assumed that the

midpoint of each class can represent the original measurements that fell within the

class boundaries without significantly affecting subsequent analysis and

identification of modes. By not making a distinction between measurements

falling in the same intervals, information is lost and the larger the interval or class

size, the larger the lost. On the other hand, by increasing the intervals number and

decreasing interval size, more effort is required in sampling, homogeneity is

decreased and errors in sampling may take on added importance (Guiasu, 1986;

Erzini, 1990). In fisheries, a compromise has often to be made between measuring

a small fish number slowly and accurately and grouping measurements in small

class intervals, as well as to be able to distinguish modes or peaks in the size

frequency and measuring a large number of individuals in the same period of time

with a coarser unit of measurement and class interval. Obviously, the coarser the

unit of measurement, the greater the difficulty of distinguishing successive modes

in the size frequency distribution as they approach on another more closely with

size (Caddy, 1986).

3. Discontinuity. This histogram characteristic is function of the arbitrary

bin locations and the discreetness of data rather than of the population that is

sampled. The local density is only computed at the midpoint of each bin and then the

bars are drawn assuming a constant density throughout each bin (Chambers et al.,

1983).

4. Fixed bandwidth. Usually, data density has a non Gaussian behaviour,

and it is difficult to choose an optimal bandwidth following simple rules. If a fixed

bin is narrow enough to show details where density is high, it cannot avoid noise

(34)

where density is low. This problem is often addressed by varying the binwidth, but

the height of the bar is no longer proportional to its area, which may lead to

misinterpretation.

1.2.4.5. Classification of length-based analysis methods

Methods developed over the years for the analysis of length-frequency data

have tended to fall into two groups: parametric and non-parametric (Fig. 1.6).

Another classification is into simple ad hoc methods, that are often essentially

graphical or non-parametric, and rigorous statistical estimation methods, usually

parametric (Pitcher, 2002).

Taylor method

Taylor, 1965

Bhattacharya, 1967

Pauly and Caddy, 1985

Goonetilleke and Sivasubramaniam, 1987

Harding, 1949

Cassie, 1954

Harris, 1968

Hald, 1952

Tanaka, 1953, 1962

Hasselblad, 1966

Hasselblad and Tomlinson, 1971

Pauly and Caddy, 1985

ENORMSEP

(Extended Normal Separator Program)

Yong and Skillman, 1975

Petersen, 1891

MacDonald and Pitcher, 1979

MacDonald and Green, 1986

MULTIFAN

Fournier et al. , 1990

Pauly and David, 1980, 1981

Pauly, 1982, 1987

Shepherd, 1987a

Isaac, 1990

Terceiro and Idoine, 1990

Pauly and Arreguin-Sanchez, 1995

Rosenberg et al. , 1986

Shepherd, 1987b

Powell, 1979

Wetherall, 1986

Wetherall et al. , 1987

Non parametric

methods

Analysis of

length-frequency data

NORMSEP

(Normal Separator Program)

MIX technique

Computational

methods

Parametric

methods

Bhattacharya method

Graphical

methods

Cassie method

Tanaka method

ELEFAN I (Electronic length-frequency analysis)

SLCA (Shepherd's length-composition analysis)

Proj (Projection matrix method)

Powell-Wetherall method

Fig. 1.6 Classification of length-based analysis methods.

Parametric methods, also called modal analysis methods, depend upon the

estimation of means, standard deviations and proportions or numbers in each of

the cohorts in the mixed sample. These are the parameters of the size-frequency

distributions, hence the term parametric. The size distributions are generally taken

as normal, but log normal and gamma distributions may also be employed

(MacDonald and Pitcher, 1979). The methods include both graphical (e.g.

Figura

Fig. 1.6 Classification of length-based analysis methods.
Table 3.1 Input data used in the generation of the
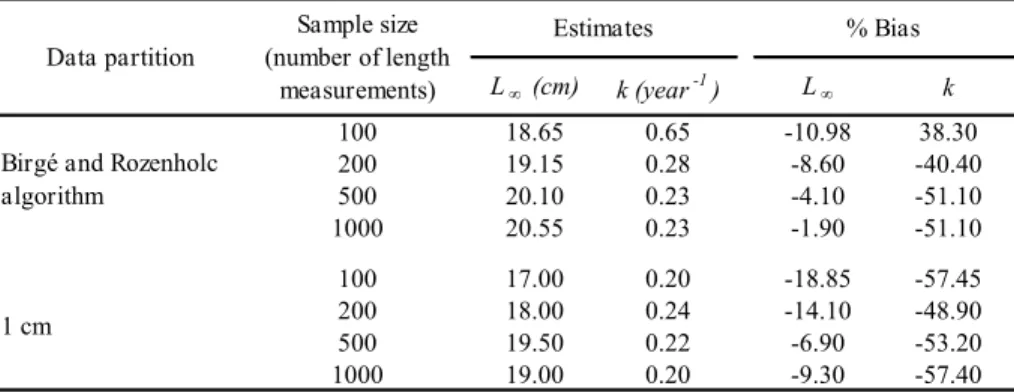
Table 4.1 Medians of the estimates and the corresponding percentage bias of the two growth  parameters (L ∞  and k) obtained in the four samples using the two partitions for grouping the Red  mullet length data
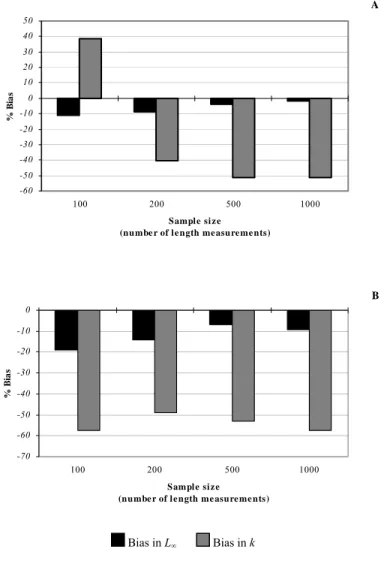
Fig. 4.1 Percentage bias in the estimation of the two growth parameters (L ∞  and k) as a function of the sample  size (number of length measurements)
+7

Riferimenti

Documenti correlati

Heterocyclic analogs of benzanilide derivatives as potassium channel activators. 1,2,3-Triazol-carboxanilides and 1,2,3-(N-benzyl)-carboxamides as BK- potassium

A tutti quelli che hanno creduto in me senza caricarmi del peso delle loro aspettative e mi hanno sostenuto nei momenti

L’uso del paradigma analitico del morfotipo rurale ha consentito di descrivere e, soprattutto, di spazializzare, con una approssimazione riferibile alla scala

Al ritorno negli Stati Uniti, nel 1874, fu accolta con grande ammirazione sia a Boston che a Filadelfia, ricevendo applausi da molta parte della critica dell’epoca; Henry

Maximum interbuilding approaches corresponding to the un- controlled configuration (black line with squares), the active controller defined by the control gain matrix K (red line

Resta da stabilire, dunque, quali siano gli strumenti più efficaci per assicurare che effettivamente il ruolo dei consumatori all’interno del mercato non sia

The method presented in this article is based on three core algorithmic ideas: mean shift clustering to detect soma centers (Section 2.2), supervised semantic deconvolution by means

x the constitutive equations of both parent material and FSWed zone were used as input data in the FE simulation of the cold stamping process of the friction stir welded blanks;.