IOBC / WPRS
Working group “Integrated Protection of Olive Crops”
OILB / SROP
Groupe de travail “Protection Intégrée des Olivaies”
Proceedings of the meeting
Comptes rendus de la réunion
at / à
Chania (Crete, Greece)
29-31 May 2003
Edited by:
Argyro Kalaitzaki, Venizelos Alexandrakis, Kyriaki Varikou
IOBC wprs Bulletin
The content of the contributions is in the responsibility of the authors
The IOBC/WPRS Bulletin is published by the International Organization for Biological and Integrated Control of Noxious Animals and Plants, West Palearctic Regional Section (IOBC/WPRS)
Le Bulletin OILB/SROP est publié par l‘Organisation Internationale de Lutte Biologique et Intégrée contre les Animaux et les Plantes Nuisibles, section Regionale Ouest Paléarctique (OILB/SROP) Copyright: IOBC/WPRS 2005
The Publication Commission of the IOBC/WPRS: Horst Bathon
Federal Biological Research Center for Agriculture and Forestry (BBA) Institute for Biological Control Heinrichstr. 243 D-64287 Darmstadt (Germany) Tel +49 6151 407-225, Fax +49 6151 407-290 e-mail: [email protected] Luc Tirry University of Gent Laboratory of Agrozoology Department of Crop Protection Coupure Links 653
B-9000 Gent (Belgium)
Tel +32-9-2646152, Fax +32-9-2646239 e-mail: [email protected]
Address General Secretariat:
INRA – Centre de Recherches de Dijon
Laboratoire de recherches sur la Flore Pathogène dans le Sol 17, Rue Sully, BV 1540
F-21034 DIJON CEDEX France
Integrated Protection of Olive Crops IOBC/wprs Bull. 28(9), 2005 pp. 13-18
13
Analysis of spatio-temporal Bactrocera oleae (Diptera, Tephritidae)
infestation distributions obtained from a large-scale monitoring
network and its importance to IPM
Diego Guidotti, Giorgio Ragaglini, Ruggero Petacchi
Landscape Entomology Lab (LELab), Scuola Superiore S.Anna – Polo S.Anna Valdera, Viale Rinaldo Piaggio 34, 56125 Pontedera (PI)
Abstract: Bactrocera oleae is the key-pest considered in the “Olive-oil quality improvement project”
in Tuscany (Italy). In this region, a network of 286 representative farms has been created in 2002 for monitoring weekly olive fruit-fly infestations, and the obtained data have been used in advising farmers on B. oleae control. The field observations were made by the regional extension service, and data have been collected from an internet-based monitoring network implemented in the Landscape Entomology Laboratory (LELab) of Scuola Superiore Sant’Anna. In this paper, we rely on the Geographic Positioning System (GPS) to locate the monitoring farms and make use of farm-specific information to analyze the regional spatial pattern of B. oleae infestions. Data analysis has been performed with Arcview 8.2, and we used variograms to model autocorrelations between sample points and cross-validation to identify the most reliable index. We consider the utility of Geographic Information System for spatial analysis at the landscape (or large) scale and kriging technique to interpolate between sample points. The resultant map can be used to predict the beginning of B. oleae infestations.
Key words: Bactrocera oleae, geographic information systems, spatial analysis at landscape scale,
pest management planning tool.
Introduction
Entomologists increasingly rely on the landscape ecology approach to study insect populations. Landscape ecology is an academic discipline that provides a scientific base for problem solving and decision making in land-use management (Coulson, 1993). In the last few years, there was an increasing interest to integrate the statistical analysis of spatial data into population ecology (Liebhold and Gurevitch, 2002).
The problem of pattern and scale is the central problem in ecology (Levin, 1992), in landscape ecology and in landscape entomology. Geographic Information Systems (GIS) and Spatial Data Analyses (SDA) proved suitable for addressing spatial problems at different scales in entomology (Coop et al., 1994). In fact, GIS and SDA at the landscape (or regional, or area-wide) scale are often used in applied insect ecology for representing the infestations of phytophagous insects and for improving the knowledge on ecological processes in agroecosystems science and forestry (Coulson et al., 1993; Liebhold et al., 1993; Berry Lyons et al., 2002). At the scale of regional ecosystem integration, GIS and SDA based analyses can now greatly improve policy and strategic decision-making to pest management. This development is due in part to the rapid evolution of IPM including greater consideration of the physical and biological bases underlying environmental processes (Saarenmaa, 1992). The use of GIS, when coupled with geostatistics, is also becoming an important tool for understanding processes that underlie population development (Liebhold et al., 1993). Geostatistics is particularly useful for the description of spatial patterns and for estimating
14
values at unsampled locations. Spatial data analysis at the landscape scale of the olive fruit-fly (Bactrocera oleae (Gmelin)) infestation and environmental parameters may assist in both the management of the monitoring network set-up for the control of this pest species (Petacchi et al., 2002; Sciarretta et al., 2003) and in the improvement of the ecological knowledge.
In this paper we describe a methodology adopted to identify a reliable infestation index and to create a map of B. oleae infestation at landscape (or large) scale, Tuscany region in Italy, using geostatistics and GIS.
Material and methods Data collection
Data of B. oleae infestations have been collected in Tuscany region from an Internet-based monitoring network implemented at the Landscape Entomology Laboratory of the Scuola Superiore Sant’Anna (Petacchi et al., 2001). Observations were made by the regional extension service. From July to October, each farm was visited weekly by advisors who collected 100 and characterized the B. oleae life stages.
A network of 283 representative farms has been created for monitoring weekly olive fruit-fly infestations and the data obtained have been used in advising farmers on B. oleae control within the framework of the “Olive oil quality improvement” project. In 2002, we performed an analysis of the data originating from all these farms. The farms have been geo-referred using a 1:10.000 Tuscany technical map available on Internet from the Tuscany GIS facility (http://www.rete.toscana.it/sett/territorio/carto/) or using GPS (Garmin 12 CX).
Infestation typology has been aggregated in infestation indexes. The main index adopted in olive fruit fly IPM is the Active Infestation, i.e. the percentage of olives infested by eggs, and alive first and second instar larvae.
Statistical analysis
STEP 1. In order to perform spatial analyses, we extract from the temporal population dynamics on each farm some indexes able to characterize different phenological aspects of the yearly infestation that can be used to synthetically define IPM strategies for each farm.
Table 1. Description of indices estimated and utilized for B. oleae infestation data analysis (YI = Young Infestation; AI = Active Infestation).
Index Index description
JYI Julian day with first presence of eggs and alive first instar larvae; this index represents the beginning of the infestation
jAI5
represent the first day in which the Active Infestation Index (eggs and alive first and second instar larvae) exceeds the 5,0% AI threshold
jAI10, jAI15
alike jA5 with 10,0% and 15,0% AI threshold; this index assesses the earliness of infestation by considering the risk of reaching economic threshold
AvgAI
Average of Active Infestation Index from 25 to 34 weeks of the year: it represents the level of infestation in the first generation of development of olive fruit fly
MaxAI Maximum of Active Infestation Index from week 25 to 34 of the year: it represents the peak level of infestation in first generation
15
The two aspects considered by the indexes are the infestation period (expressed Julian days) during which infestation occurs or exceeds a determined threshold, and the infestation level (average and maximum of infestation in a determined period). The estimated indexes are reported in Table 1.
STEP 2. For each of infestation index, we carried out a general statistical analysis and estimated the semivariogram with a spherical model. Briefly, a semivariogram is a statistical model testing the degree of correlation among values measured in points separated by different distances. The semivariograms are interpolated by a function that describes the relationship between the distance of a point and the corresponding semivariogram. Interpolating semivariogram with a spherical model allows the use of the model parameters to describe the typology of spatial autocorrelation. Thereby, nugget expresses the semivariance at distance zero and corresponds to the sum of sampling error and spatial variability at distances smaller than the smallest sampling distance. Range represents the average distance within which the samples remain spatially correlated, and sill is the variance explained by the model. In these analyses, we considered the total sill as the overall variance, obtained by summing the nugget with the partial sill (variance due to spatial variation only). For further information the reader is referred to Liebhold (1993) who explains geostatistical concepts in applied insect ecology.
The ratio among the partial sill and the total sill expresses the importance of nugget effect on the overall determination of spatial variability, i.e. the amount of spatial variability detected for a single variable at a specific scale.
STEP 3. In order to test the data we performed a cross-validation of the spatial model. The spatial analysis has been performed using ArcGIS 8.2 Spatial Analysis and the patially auto-correlated indexes are represented by a counters map overlaying it with the Tuscany administrative borders.
Results and discussion
Tab. 2 reports the results of the general statistics analysis that has been carried out for each infestation index. It shows, among others, that the beginning of infestation occurs in average the first week of August (219 julian day) and the 10% threshold is exceeded, in average, during the first week of September (247 julian day).
Table 2. Results of the general statistical analysis on the infestation indexes
Index Average Min Max Variance
jYI 219.4378 189 276 463.17454 jAI5 239.8224 189 303 700.30635 jAI10 247.3464 203 296 563.43842 jAI15 256.4694 203 296 536.4372 AvgAI 0.022052 0 0.148 0.0006388 MaxAI 0.051757 0 0.31 0.0031394
In Tab.3, the parameter estimations for the infestation indexes shows the beginning of the infestation index (jYI) and the average of infestation index in the 1st generation (AvgAI) and indicates that there is a good ratio between partial sill and total sill (Tab.3). This shows that the variance due to spatial variation only greatly contributes to the overall variance.
16
Table 3. The parameters obtained by fitting the indexes of a semivariogram with a spherical model. Index Partial sill Major range Nugget Partial sill/total sill jYI 1,443.30 1.4173 511.46 73.8% jAI5 2,404.60 1.2304 1,299.70 64.9% jAI10 1,654.00 1.0781 2,524.70 39.6% jAI15 675.94 1.1121 2,478.00 21.4% AvgAI 0.000730 2.121 0.000242 75.1% MaxAI 0.002349 1.5307 0.001575 59.9%
The spatial prediction of the date for exceeding the several infestation thresholds presents greater nuggets and reduced partial sill than the other predictions. The earliness of infestation seems to be little influenced by local effects. This could be explained by the fact that variables are not influenced by pest management strategies adopted at farm level. On the contrary, the exceeding of particular levels of infestation depends on the economic threshold adopted by farmers. In Tuscany, a threshold of 10% of active infestations is commonly adopted.
The analysis of linear regression coefficients between values predicted and observed shows that the Young Infestation index presents performs best in cross validation (Tab.4).
Table 4. Results of the cross-validation analysis (RMSE = Root Mean Square Error; RMSE std.= Root Mean Square Error Standardized; MAE = Mean Absolute Error)
Index Mean Error RMSE RMSE Std. MAE R 2 JYI -0.1444 25.1064 0.9816 14.9983 0.579072 jAI5 0.05352 38.6332 0.9629 28.6564 0.515253 jAI10 0.0885 48.5311 0.9553 40.8867 0.212166 jAI15 0.06514 51.3145 0.9289 43.4928 0.310479 AvgAI -0.00013 1.96% 1.114 1.29% 0.400739 MaxAI 7.29E-05 4.01% 0.9515 2.62% 0.454528
Considering both the semivariogram analysis and the cross-validation analysis, the day of beginning of infestation displays the highest R2 and hence, a stronger spatial structure than the other variables. As a consequence, we consider jIY as the most reliable index and use it for mapping.
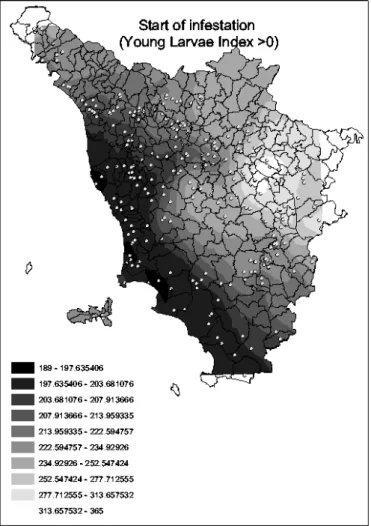
By spatial interpolation through kriging we obtain a prediction map of jIY that we can combine with a contour map showing Tuscany administrative borders (Fig. 1). In Tuscany, the regional map of the B. oleae start infestation is a useful pest management planning tool and can be used in the deployment of pest management resources.
This analysis clearly demonstrates where B. oleae infestation starts, and furthermore, shows the influence of the sea as well as a rather complex response surface in interior areas of the Tuscany region. Much of this complexity probably resulted from other geographically distributed variables such as changes in climate, fruit quality and quantity as well as land-use.
In the further analysis we are considering a study on the spatial relationship between B. oleae infestations and agro-metereological indices derived from developmental rate
17
summation methods. The aims will be to validate a model that can guide farmers in initiating monitoring procedures.
Our final aim is to transfer the SDA validated method in a Decision Support System (DSS). The DSS will assist farm advisors in locating representative olive groves where monitoring of B. oleae infestation can efficiently be done and from where IPM relevant information can be easily transferred to other farms.
Figure 1: prediction map of jYI (Young Infestation Index) observed on monitored farms and expressed in Julian days. The thematic points represent the location of monitoring farms.
Conclusion
The data quality and the choice of an appropriate index to compare the spatial autocorrelation of several variables are the most important features of the B. oleae large scale monitoring network. The adoption of adequate methodology for data evaluation and the testing of several validation methods in spatial data analysis are prerequisites for the analysis.
In Tuscany, the regional map of the beginning B. oleae infestations represents a useful pest management planning tool and can be used in the deployment of pest management resources.
In this article, particular attention was given on the practical application of Spatial Data Analysis within the framework of the regional B. oleae Monitoring Network. A
18
comprehensive description of the methodology, results obtained and their implications is under preparation.
Acknowledgements
The works was supported by the Tuscany Region Project “Improvement of Olive Quality” (EC Reg. 528/99). We thank Massimo Ricciolini, Massimo Toma, Angelo Bo and Sabina Palchetti from ARSIA (Tuscany Region Agency on Agricultural Development) for the collaboration in managing the monitoring network and geo-referencing of farms. We are grateful to all the farm advisors who participated in the project. We appreciate Johann Baumgärtner’s (International Centre of Insect Physiology and Ecology, Nairobi) suggestions and assistance in manuscript preparations.
References
Barry Lyons, D., Sanders, C.J. & Jones, G.C. 2002: The use of geostatistics and GIS as tools for analyzing pheromone trap data at a landscape level: an update. – IOBC/WPRS Bulletin 25(9): 1-14.
Coop, L.B., B.A. Croft, H. Riedl, & Burts, E.C. 1994: Geographic information systems and simulation in regional orchard management: pesticide resistance in Hood River Valley, Oregon. – Acta Horticulturae 367: 383-390.
Coulson, R.N., Fitzgerald, J.W., Saunders, M.C. & Oliveira, F.L. 1993. Spatial analysis and Integrated Pest Management in a landscape ecological context. – In: A.M. Liebhold & H.R. Barret (eds.). Proceedings: Spatial Analysis and Forest Pest Management. USDA Forest Service, Technical Report NE 175: 93-99.
Levin, S.A. 1992: The problem of pattern and scale in ecology. – Ecology 73: 1943-1967. Liebhold, A.M., Rossi, R.E. & Kemp, W.P. 1993: Geostatistics and geographic information
systems in applied insect ecology. – Ann. Rev. Entomol. 38: 303-327.
Liebhold, A.M. & Gurevitch, J. 2002: Integrating the statistical analysis of spatial data in ecology. – Ecography 25: 553-557.
Saarenmaa, H. 1992: Integrated pest management in forests and information technology. – Journal of Applied Entomology 114: 321-332.
Sciarretta, A., Burgio, G. & Petacchi, R. 2003: Spatial aspects in entomological experiments on landscape management. – IOBC/wprs Bull. 26(4): 139-144.
Petacchi, R., Guidotti D. & Rizzi, I. 2001: Experiences on using Web-based data management system for area-wide monitoring network in olive fruit-fly IPM. – Proceedings EFITA 2001, Montpellier, France, June 18-20: 53-58.
Petacchi, R., Guidotti, D. & Rizzi, I. 2002: Spatial Data analysis and management in Integra-ted Pest Management in olive growing. – Acta Horticolturae 586: 835-839.