2016
Publication Year
2020-05-26T09:01:35Z
Acceptance in OA@INAF
Antenna pattern characterization of the low-frequency receptor of LOFAR by means of an UAV-mounted artificial test source
Title
BOLLI, Pietro; Paonessa, F.; PUPILLO, Giuseppe; Virone, G.; Arts, M.; et al.
Authors 10.1117/12.2232419 DOI http://hdl.handle.net/20.500.12386/25166 Handle PROCEEDINGS OF SPIE Series 9906 Number
PROCEEDINGS OF SPIE
SPIEDigitalLibrary.org/conference-proceedings-of-spieAntenna pattern characterization of
the low-frequency receptor of LOFAR
by means of an UAV-mounted
artificial test source
Bolli, P., Paonessa, F., Pupillo, G., Virone, G., Arts, M., et
al.
P. Bolli, F. Paonessa, G. Pupillo, G. Virone, M. Arts, A. Lingua, J. Monari, S. J.
Wijnholds, "Antenna pattern characterization of the low-frequency receptor of
LOFAR by means of an UAV-mounted artificial test source," Proc. SPIE 9906,
Ground-based and Airborne Telescopes VI, 99063V (27 July 2016); doi:
10.1117/12.2232419
Event: SPIE Astronomical Telescopes + Instrumentation, 2016, Edinburgh,
United Kingdom
Antenna pattern characterization of the low-frequency receptor of
LOFAR by means of an UAV-mounted artificial test source
P. Bolli
*a, F. Paonessa
b, G. Pupillo
c, G. Virone
b, M. Arts
d, A. Lingua
e, J. Monari
c, S.J. Wijnholds
da
INAF - Osservatorio Astrofisico di Arcetri, Florence, Italy;
bCNR - Istituto di Elettronica e di
Ingegneria dell'Informazione e delle Telecomunicazioni, Torino, Italy;
cINAF - Istituto di
Radioastronomia, Bologna, Italy;
dNetherlands Institute for Radio Astronomy, Dwingeloo, The
Netherlands;
ePolitecnico di Torino - Dipartimento di Ingegneria dell'Ambiente, del Territorio e delle
Infrastrutture, Torino, Italy
ABSTRACT
Low frequency aperture array technology requires advanced ad-hoc tools for performing antenna and array pattern characterization and instrumental calibration. A micro Unmanned Aerial Vehicle (UAV) mounting a radio-frequency transmitting system developed in Italy has demonstrated to satisfy the challenging characteristics of these tasks. Therefore, a measurement campaign by means of this UAV system has been planned to one Dutch station of the Low Frequency Array (LOFAR) with the main goal to improve the LOFAR antenna and array models. In preparation for this campaign, some initial tests applying the UAV system to one low-frequency antenna of LOFAR were performed in Italy. This contribution describes this measurement session and shows that the measured antenna gain patterns at different frequencies between 40 and 70 MHz agree very well with the electromagnetic models.
1. INTRODUCTION
In recent years, several astronomical Low Frequency Aperture Array (LFAA) systems have been deployed around the globe. Examples of such instruments are the Low Frequency Array (LOFAR) in Europe operating in the 10 – 240 MHz range [1] and the Murchison Widefield Array (MWA) in Australia operating in the 80 – 300 MHz range [2]. The radio astronomical community is also already working on the successor of these instruments in the form of the LFAA system of the Square Kilometre Array (SKA) envisaged to operate in the 50 – 350 MHz range [3][4]. The performance of all these instruments critically depends on their calibration. However, instrument calibration at such low frequencies poses significant challenges, including electromagnetic (EM) characterization of the array in actual operating conditions (in
situ). At these low frequencies, this is challenging due to the strong mutual coupling between the antennas and with the
environment and due to the practical infeasibility of measuring the system in an anechoic chamber.
In this context, within an Italian collaboration among the National Institute for Astrophysics (INAF), the National Research Council (CNR) and the Polytechnic of Turin a novel measurement system consisting of a radio frequency transmitter mounted on an Unmanned Aerial Vehicle (UAV) for the characterization of LFAAs has been developed [5]. This system was successfully used to reliably and accurately characterize the embedded element patterns and array patterns of the Medicina Array Demonstrator at 408 MHz [5]. Moreover, measurements of the Square Kilometre Array Log-periodic Antenna (SKALA) had been carried out in the frequency range from 50 MHz to 650 MHz [7].
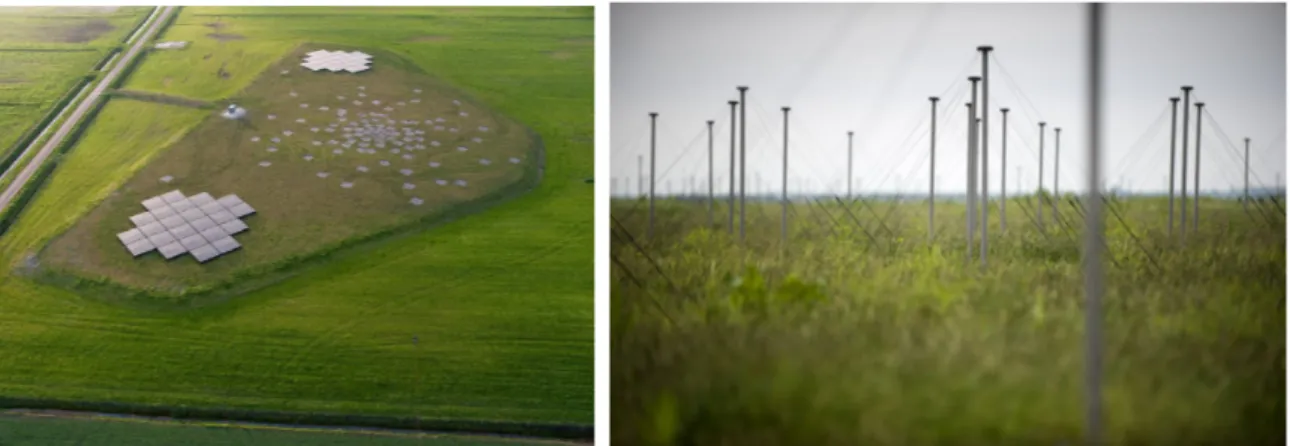
Recently, interest arose for using this measurement system to characterize a LOFAR station. LOFAR is an operational aperture array radio telescope developed and built by the Netherlands Institute for Radio Astronomy (ASTRON) that is an important pathfinder for the LFAA element of the SKA. LOFAR currently consists of 38 stations in The Netherlands and 12 International stations spread throughout Europe. Each station is composed of two subarrays: a Low Band Antenna (LBA) array covering the 10 – 90 MHz range and a High Band Antenna (HBA) array covering the 120 – 240 MHz range. An aerial photograph of a single LOFAR station, in which the HBA array is split further into two subarrays, as well as a photo of an LBA are shown in Figure 1.
*[email protected]
Ground-based and Airborne Telescopes VI, edited by Helen J. Hall, Roberto Gilmozzi, Heather K. Marshall, Proc. of SPIE Vol. 9906, 99063V · © 2016 SPIE · CCC code: 0277-786X/16/$18 · doi: 10.1117/12.2232419
Proc. of SPIE Vol. 9906 99063V-1
Downloaded From: https://www.spiedigitallibrary.org/conference-proceedings-of-spie on 26 May 2020 Terms of Use: https://www.spiedigitallibrary.org/terms-of-use
In this paper, we present results from a single-antenna measurement campaign in Turin in preparation for measurements of a full LOFAR station in The Netherlands. Measurements on a full LOFAR station will allow us to demonstrate that:
1. the UAV-system is capable of characterizing the embedded element patterns of the antennas within a station despite the fact that the altitude of the UAV does not satisfy the far-field condition for the full station;
2. the UAV-system can support commissioning efforts, such as measuring the actual positions and orientations of the antennas after roll-out;
3. the UAV-system can be used as a tool to perform initial calibration of the array thereby providing a good starting point for further (self-)calibration of the system using astronomical sources.
Hence, the measurement campaign at a full LOFAR station will allow us to demonstrate the benefits that a UAV-based system could provide in the context of the LFAA element of the SKA.
The remainder of this paper is organized as follows. In the next section, we provide a detailed introduction of the UAV system. In Sec. 3, we provide a detailed description of the LBA of the LOFAR and how a single LBA was installed in Turin to perform the measurements presented in this paper. This description is followed by the measurement results in Secs. 4 and 5, which are compared with results from EM-simulations. We finish our paper by concluding that we found good agreement between the antenna response predicted by the EM-simulations and the measured response, which puts us in a good position to pursue the measurements of embedded element patterns in a full station.
Figure 1. Aerial photograph of a Dutch LOFAR station made by Top-Foto (left) and a photo of the LBA array taken by Hans Hordijk (right).
2. UAV SYSTEM AND FLIGHT STRATEGIES
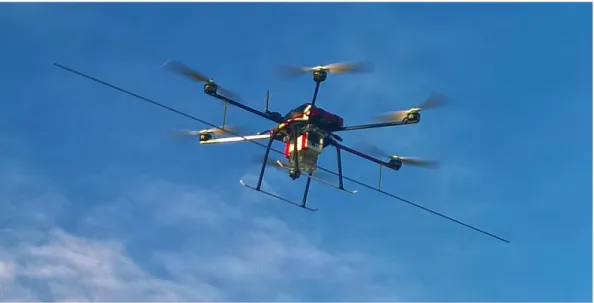
The characterization of the LBA was performed with an innovative UAV-based system that allows a full antenna characterization in real operating conditions, i.e. including also the effects of the ground. The system is based on a flying artificial test source consisting of a battery-powered micro-UAV, equipped with a radio-frequency transmitter and a dipole antenna (Figure 2).
During the flight, the drone position is measured with a Differential Global Navigation Satellite System (DGNSS) technique by means of a Post Processed Kinematic (PPK) approach, which provides an accuracy of few centimeters. The continuous-wave RF signal transmitted by the source is received by the ground-based Antenna Under Test (AUT) and measured by a spectrum analyzer. Such a system is completely portable and does not require any particular infrastructure. Moreover, it enables pattern characterization for several scenarios: single element, embedded element and array pattern, at a low cost and high accuracy.
The UAV follows rectilinear trajectories, defined by means of waypoints, such as the two orthogonal ones shown in Figure 3, which are associated with a measurement presented in the Sec. 5 (at 70 MHz). In such a figure the AUT is assumed to be placed in the center of the reference system and oriented such that the E- and H-planes coincide
Proc. of SPIE Vol. 9906 99063V-2
Downloaded From: https://www.spiedigitallibrary.org/conference-proceedings-of-spie on 26 May 2020 Terms of Use: https://www.spiedigitallibrary.org/terms-of-use
respectively with the yz- and xz-plane. Therefore, the two flight paths in Figure 3 mainly correspond with the E- and H-plane cuts of the antenna radiation pattern. Usually, the programmed flying height is constant and depends on the required minimum far-field distance, which is imposed by the operative frequency and the antenna size. In this framework, the effect of path loss and source gain variations across the path, are removed from the raw data using the technique reported in [8].
Co- or cross-polarization measurements are performed by programming the proper UAV bearing angle, as a constant during the flight. When the UAV is at zenith, the bearing corresponds to the angle between the co-polarization directions of the test source and the AUT, measured on the horizontal plane. Therefore, the bearing is programmed either to 0° (co-polar) or 90° (cross-(co-polar).
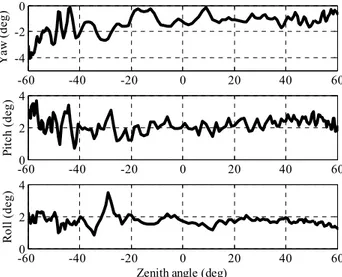
It should be pointed out that the real flight path may differ from the programmed one, typically by a few meters, owing to the uncertainty of the internal onboard GPS and its navigation system. Therefore, the real path does not perfectly coincide with the E- or H-plane of the radiation pattern. Moreover, the UAV orientation also has some variations during the flight. However, the procedure for pattern extraction in [8] takes into account both the real UAV position, measured by the DGNSS, and its orientation, measured by the onboard Inertial Measurement Unit (IMU). Figure 4 shows the orientation angles of the UAV during the scan along the x-axis of Figure 3.
In order to measure the LBA at the very challenging frequencies of 40, 50, 60 and 70 MHz, we used as a 2-m long thin dipole as a test-source antenna on the UAV. This antenna, which is already large as far as the UAV flight stability is concerned, resonates at about 70 MHz. However, the receiving measurement system on the ground had a sufficient dynamic range to compensate for the antenna mismatch loss at lower frequencies.
Figure 2. The flying artificial test source consisting in the UAV equipped with the RF transmitter and the 2-m long dipole antenna.
Proc. of SPIE Vol. 9906 99063V-3
Downloaded From: https://www.spiedigitallibrary.org/conference-proceedings-of-spie on 26 May 2020 Terms of Use: https://www.spiedigitallibrary.org/terms-of-use
-150 -120 -90 -60 -30 0 30 60 90 120 150 -150 -120 -90 -60 -30 0 30 60 90 120 150 y ( m ) x (m) -150 -120 -90 -60 -30 0 30 60 90 120 150 74.2 74.4 74.6 74.8 z ( m ) x (m)
Figure 3. (Left) measured flight path (DGNSS) projected on the horizontal plane; (right) flying height during the scan along the x-axis.
-60 -40 -20 0 20 40 60 -4 -2 0 Ya w ( de g) -600 -40 -20 0 20 40 60 2 4 Pi tc h ( de g) -600 -40 -20 0 20 40 60 2 4 Ro ll ( de g)
Zenith angle (deg)
Figure 4. Orientation angles of the UAV during the scan along the x-axis of Figure 3.
3. LBA DESCRIPTION AND INSTALLATION ON THE MEASUREMENT FIELD
The LOFAR LBA consists of two orthogonal inverted-V dipoles above a wire mesh ground plane of 3 m x 3 m with a pitch of 15 cm. Each antenna consists of four wires (two wires for each polarization). The upper part of the wires are the actual antenna. The lower part of one side of two orthogonal wires consists of Ethylene-Propylene Diene Monomer (EPDM) rubber springs. The lower part of the other two sides is made of stiff polyester rope. Both the EPDM rubber springs and the polyester ropes are attached to the ground by large tent pegs. The antenna wires are in the same plane as the diagonals of the ground plane (see Figure 5).
The length of the upper part of the antenna wires is 1.38 m. The angle between each wire and the ground plane is 45 degrees. All dimensions are shown in Figure 5. The four antenna wires come together in the molded LNA module on top of a PVC pipe. This pipe contains the coaxial cables going from the LNA to the cabinet containing the receiver units.
Proc. of SPIE Vol. 9906 99063V-4
Downloaded From: https://www.spiedigitallibrary.org/conference-proceedings-of-spie on 26 May 2020 Terms of Use: https://www.spiedigitallibrary.org/terms-of-use
90 mm ri< 1r i i 1380 mm
/
\
1380 mm 1733 mm ground plane 'Figure 5. The Low Band Antenna: (left) schematic view, (right) dimensions.
The diameter of the upper part of the antenna wires is 1 mm. In the electromagnetic model, the ground plane is modeled as a perfect conducting sheet. This is justified by the fact that the pitch of the wire mesh is even less than 1/20 wavelength at the highest frequency (90 MHz). The soil below the ground plane is modeled as a dielectric with a relative dielectric constant (εr) of 3 and a conductivity of 0.01 S/m.
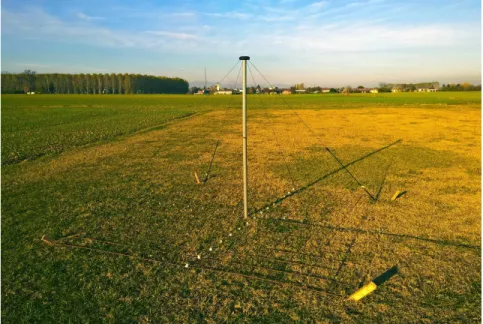
One LBA was shipped by ASTRON and mounted on the measurement field near Turin, Italy (see Figure 6). No other structures were present at a distance of less than 60 m from the AUT. A gridded ground plane was positioned below the AUT, consisting in a square grid 2.8 m wide, with a mesh size of 20 cm and a thickness of 6 mm. As shown in the picture, the AUT dipoles were aligned along the two diagonals of the square ground plane, respectively along the North-South and East-West directions.
Figure 6. The LBA mounted on the measurement field in Turin.
Proc. of SPIE Vol. 9906 99063V-5
Downloaded From: https://www.spiedigitallibrary.org/conference-proceedings-of-spie on 26 May 2020 Terms of Use: https://www.spiedigitallibrary.org/terms-of-use
4. LBA GAIN MEASUREMENT
Initially, we focused our tests on measuring the maximum LBA gain by placing the hexacopter still at the zenith direction of the LBA. This measurement was carried out by means of an accurate characterization of all the components of the RF chain: RF transmitter on the UAV, balun, test-source dipole antenna, cables and bias adapters (DC bias for the LNAs).
For a co-polar measurement, the AUT gain at zenith is computed with:
cables UAV
TX rec
AUT P P InsLoss MisLoss g PathLoss A
g = − + + − + + (1)
where all the quantities are expressed in decibels. Prec is the measured received power, PTX is the power generated by the
transmitter on the UAV, InsLoss is the insertion loss of the balun, MisLoss is the loss due to the reflection coefficient of the dipole antenna on the UAV, gUAV is the (simulated) gain of the test-source, PathLoss is the path loss and Acables is the
attenuation introduced by the cables and bias adapter from the AUT to the spectrum analyzer.
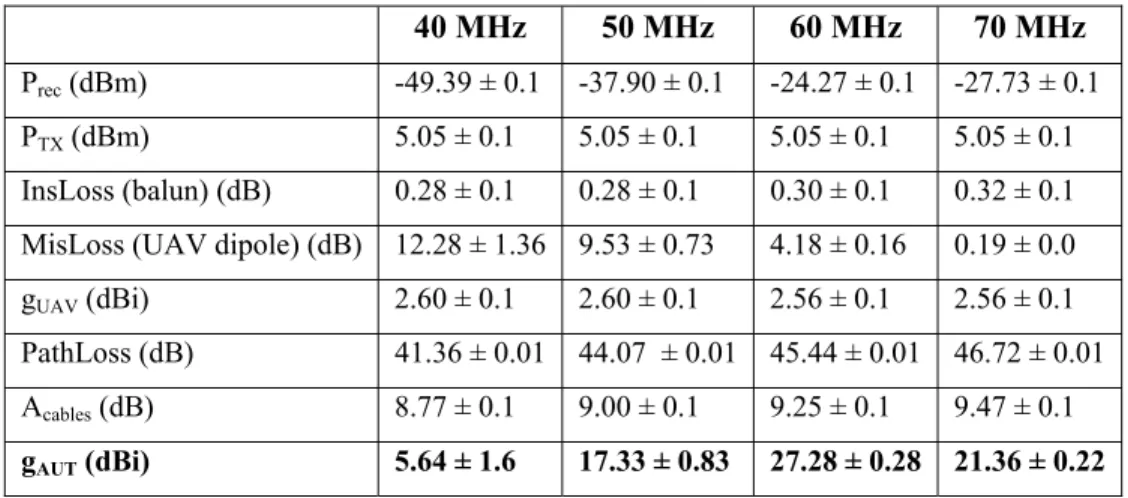
Table 1 shows the measured active-element gain at zenith, i.e. the LBA gain including the LNA. The significant gain variation of the system LBA + LNA across the frequencies shown in Table 1 (up to 25 dB) are due to the LNA transducer gain. Indeed, the antenna pattern response versus frequency, as it will be shown in Sec. 5, is definitively more stable.
Table 1 also reports a preliminary error estimation. A value of ± 0.1 dB has been assigned to each contribution that was directly measured with either a spectrum analyzer (Prec and PTX) or a vector network analyzer (InsLoss and Acables). A
value of 0.1 dB was also accounted for the simulated gUAV. The indirectly mismatch loss was evaluated from the
reflection coefficient measurement, and its error has been computed accordingly. Such a contribution is significant at frequencies where the dipole is highly mismatched and negligible at the resonance frequency (70 MHz). The error associated with the path loss is low thanks to the high accuracy of the measured UAV position.
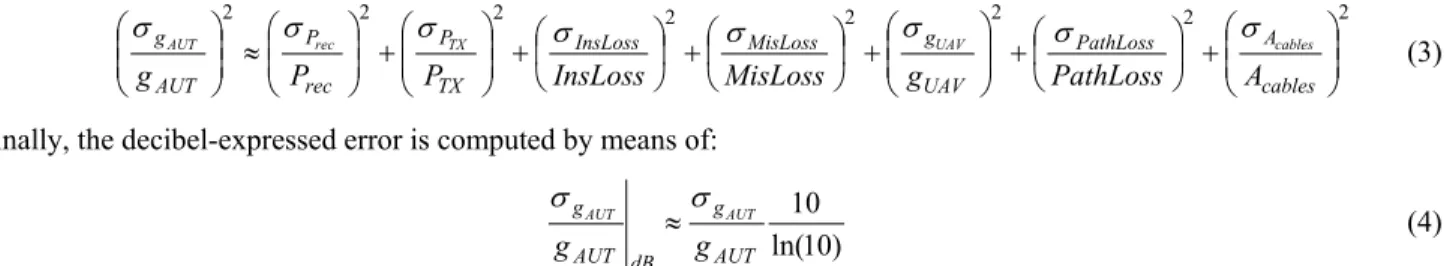
The relative error is obtained from the decibel-expressed error with:
) 10 ln( 10 dB X X X X σ σ ± ≈ (2)
which provides an approximated balanced range, sufficiently accurate for errors up to ±1 dB. Then, the total relative error is obtained with:
2 2 2 2 2 2 2 2 ⎟⎟ ⎠ ⎞ ⎜⎜ ⎝ ⎛ + ⎟ ⎠ ⎞ ⎜ ⎝ ⎛ + ⎟⎟ ⎠ ⎞ ⎜⎜ ⎝ ⎛ + ⎟ ⎠ ⎞ ⎜ ⎝ ⎛ + ⎟ ⎠ ⎞ ⎜ ⎝ ⎛ + ⎟⎟ ⎠ ⎞ ⎜⎜ ⎝ ⎛ + ⎟⎟ ⎠ ⎞ ⎜⎜ ⎝ ⎛ ≈ ⎟⎟ ⎠ ⎞ ⎜⎜ ⎝ ⎛ cables A PathLoss UAV g MisLoss InsLoss TX P rec P AUT g A PathLoss g MisLoss InsLoss P P g cables UAV TX rec AUT σ σ σ σ σ σ σ σ (3) finally, the decibel-expressed error is computed by means of:
) 10 ln( 10 AUT g dB AUT g g g AUT AUT σ σ ≈ (4)
The results of Table 1 show that a mismatched source antenna has a significant effect on the overall error budget. Table 2 shows a repeatability test performed at 60 MHz. The AUT gain has been measured with two different flights. In the second one, the test-source orientation has been rotated of 180°. In principle, this operation should provide identical results, provided the dipole feeding to be balanced and the UAV structure to be symmetrical (the metal parts). The results are partially overlapped and consistent with each other. Moreover, the gain has been computed also for the polarization #2 (with 90° test-source orientation). The result is consistent with both of polarization #1.
Proc. of SPIE Vol. 9906 99063V-6
Downloaded From: https://www.spiedigitallibrary.org/conference-proceedings-of-spie on 26 May 2020 Terms of Use: https://www.spiedigitallibrary.org/terms-of-use
Table 1. Measured AUT gain (active element) at zenith.
40 MHz 50 MHz 60 MHz 70 MHz
Prec (dBm) -49.39 ± 0.1 -37.90 ± 0.1 -24.27 ± 0.1 -27.73 ± 0.1
PTX (dBm) 5.05 ± 0.1 5.05 ± 0.1 5.05 ± 0.1 5.05 ± 0.1
InsLoss (balun) (dB) 0.28 ± 0.1 0.28 ± 0.1 0.30 ± 0.1 0.32 ± 0.1 MisLoss (UAV dipole) (dB) 12.28 ± 1.36 9.53 ± 0.73 4.18 ± 0.16 0.19 ± 0.0 gUAV (dBi) 2.60 ± 0.1 2.60 ± 0.1 2.56 ± 0.1 2.56 ± 0.1
PathLoss (dB) 41.36 ± 0.01 44.07 ± 0.01 45.44 ± 0.01 46.72 ± 0.01 Acables (dB) 8.77 ± 0.1 9.00 ± 0.1 9.25 ± 0.1 9.47 ± 0.1
gAUT (dBi) 5.64 ± 1.6 17.33 ± 0.83 27.28 ± 0.28 21.36 ± 0.22
Table 2. Repeatability test at 60 MHz.
60 MHz
Polarization #1
(1st meas.) Polarization #1 (2nd meas.) Polarization #2
Prec (dBm) -24.27 ± 0.1 -24.10 ± 0.1 -24.78 ± 0.1
PTX (dBm) 5.05 ± 0.1 5.05 ± 0.1 5.05 ± 0.1
InsLoss (balun) (dB) 0.30 ± 0.1 0.30 ± 0.1 0.30 ± 0.1 MisLoss (UAV dipole)
(dB) 4.18 ± 0.16 4.18 ± 0.16 4.18 ± 0.16 gUAV (dBi) 2.56 ± 0.1 2.58 ± 0.1 2.60 ± 0.1 PathLoss (dB) 45.44 ± 0.01 45.51 ± 0.01 45.24 ± 0.01 Acables (dB) 9.25 ± 0.1 9.25 ± 0.1 9.94 ± 0.1 gAUT (dBi) 27.28 ± 0.28 27.52 ± 0.28 27.23 ± 0.28
5. LBA CO-POLAR AND CROSS-POLAR PATTERNS
The measured radiation pattern at 40, 50, 60 and 70 MHz are shown in Figures 7 to 10. Each figure shows both the E-plane and the H-E-plane cut of the passive element. In these cases, the maximum value of the measurement has been aligned to the corresponding simulation in order to facilitate the comparison.
Since no other reference measured data are available, the measured patterns are compared to full-wave electromagnetic simulations, performed by using FEKO (http://www.altairhyperworks.com/product/FEKO). The electromagnetic model included the ground plane and an infinite soil ground.
As explained in detail in [8], the AUT pattern is computed taking into account both the real (measured) position and orientation of the UAV. Also the corresponding simulation is computed according to these measured data.
For all the co-polar measurements, the agreement between measurement and simulation is very good. The most significant discrepancies arise at 40 MHz (up to 2 dB, see Figure 7(left)). In most of the other cases, the discrepancy between measurement and simulation is within 0.3 dB. Such discrepancies can be explained by many factors, e.g.
Proc. of SPIE Vol. 9906 99063V-7
Downloaded From: https://www.spiedigitallibrary.org/conference-proceedings-of-spie on 26 May 2020 Terms of Use: https://www.spiedigitallibrary.org/terms-of-use
uncertainties of the EM modeling of both test-source and AUT (especially soil parameters), manufacturing uncertainties and overall measurement accuracy.
As far as the cross-polarization is concerned, the measured cross-polar level at zenith is lower than -20 dB for all the frequencies. However, compared to the co-polar cases, higher discrepancies can be observed between measurements and simulations. These discrepancies can be explained by: a) mechanical uncertainties of the AUT position and orientation on the ground, b) uncertainties of the measured UAV orientation angles during the flight, which are estimated to be a few degrees [9].
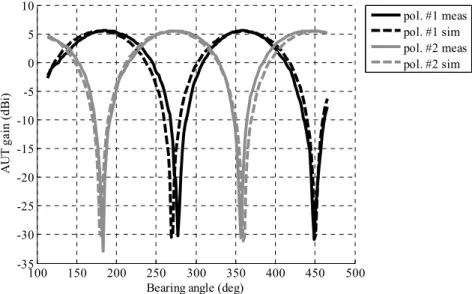
Finally, Figure 11 shows a spin measurement at 60 MHz. In this kind of measurement, the UAV hovers at zenith while slowly rotating around the vertical axis. Thus, the measured data can be used to produce a plot of the AUT gain at zenith as a function of the test-source bearing angle. Measurements and simulations are in good agreement. Occasionally, an angular difference can be observed between the simulated and measured position of the minima. For example, such a difference is approximately 7° for the minimum at 270°, and below 1° for the one at 450°. The discrepancies can be due to both mechanical uncertainties of the AUT orientation on the ground and the limited accuracy of the UAV magnetometer (nonlinearity) and gyroscope drift.
-60 -50 -40 -30 -20 -10 0 10 20 30 40 50 60 -30 -25 -20 -15 -10 -5 0 5 10
Zenith angle (deg)
AU T g ai n ( dBi ) co-pol meas co-pol sim x-pol meas x-pol sim -60 -50 -40 -30 -20 -10 0 10 20 30 40 50 60 -30 -25 -20 -15 -10 -5 0 5 10
Zenith angle (deg)
AU
T g
ai
n (
dBi
) co-pol measco-pol sim
x-pol meas x-pol sim
Figure 7. (Left) E-plane and (right) H-plane radiation pattern at 40 MHz. Co-polar measurement (solid black); co-polar simulation (dashed black); cross-polar measurement (solid gray); cross-polar simulation (dashed gray).
Proc. of SPIE Vol. 9906 99063V-8
Downloaded From: https://www.spiedigitallibrary.org/conference-proceedings-of-spie on 26 May 2020 Terms of Use: https://www.spiedigitallibrary.org/terms-of-use
-60 -50 -40 -30 -20 -10 0 10 20 30 40 50 60 -30 -25 -20 -15 -10 -5 0 5 10
Zenith angle (deg)
AU
T g
ai
n (
dBi
) co-pol measco-pol sim
x-pol meas x-pol sim -60 -50 -40 -30 -20 -10 0 10 20 30 40 50 60 -30 -25 -20 -15 -10 -5 0 5 10
Zenith angle (deg)
AU T g ai n ( dBi ) co-pol meas co-pol sim x-pol meas x-pol sim
Figure 8. (Left) E-plane and (right) H-plane radiation pattern at 50 MHz. Co-polar measurement (solid black); co-polar simulation (dashed black); cross-polar measurement (solid gray); cross-polar simulation (dashed gray).
-60 -50 -40 -30 -20 -10 0 10 20 30 40 50 60 -30 -25 -20 -15 -10 -5 0 5 10
Zenith angle (deg)
AU
T g
ai
n (
dBi
) co-pol measco-pol sim
x-pol meas x-pol sim -60 -50 -40 -30 -20 -10 0 10 20 30 40 50 60 -30 -25 -20 -15 -10 -5 0 5 10
Zenith angle (deg)
AU T g ai n ( dBi ) co-pol meas co-pol sim x-pol meas x-pol sim
Figure 9. (Left) E-plane and (right) H-plane radiation pattern at 60 MHz. Co-polar measurement (solid black); co-polar simulation (dashed black); cross-polar measurement (solid gray); cross-polar simulation (dashed gray).
Proc. of SPIE Vol. 9906 99063V-9
Downloaded From: https://www.spiedigitallibrary.org/conference-proceedings-of-spie on 26 May 2020 Terms of Use: https://www.spiedigitallibrary.org/terms-of-use
-60 -50 -40 -30 -20 -10 0 10 20 30 40 50 60 -30 -25 -20 -15 -10 -5 0 5 10
Zenith angle (deg)
AU T g ai n ( dBi ) co-pol meas co-pol sim x-pol meas x-pol sim -60 -50 -40 -30 -20 -10 0 10 20 30 40 50 60 -30 -25 -20 -15 -10 -5 0 5 10
Zenith angle (deg)
AU T g ai n ( dBi ) co-pol meas co-pol sim x-pol meas x-pol sim
Figure 10. (Left) E-plane and (right) H-plane radiation pattern at 70 MHz. Co-polar measurement (solid black); co-polar simulation (dashed black); cross-polar measurement (solid gray); cross-polar simulation (dashed gray).
100 150 200 250 300 350 400 450 500 -35 -30 -25 -20 -15 -10 -5 0 5 10
Bearing angle (deg)
AUT g ai n (d Bi ) pol. #1 meas pol. #1 sim pol. #2 meas pol. #2 sim
Figure 11. Spin measurement at 60 MHz. Polarization #1 measurement (solid black); polarization #1 simulation (dashed black); polarization #2 measurement (solid gray); polarization #2 simulation (dashed gray).
6. CONCLUSIONS
Researchers of INAF, CNR and ASTRON shared the idea that using the Italian UAV system for measurements on a Dutch LOFAR station could have several significant outcomes. The UAV system would be used for the first time to measure a fully operational radio astronomical facility, while the experimental characterization of the antenna patterns in operating conditions would improve the electromagnetic model for LOFAR. At the same time, such a campaign is expected to provide recommendations for use of a UAV-mounted test source for commissioning and calibration of the future SKA-low system and its prototypes.
Proc. of SPIE Vol. 9906 99063V-10
Downloaded From: https://www.spiedigitallibrary.org/conference-proceedings-of-spie on 26 May 2020 Terms of Use: https://www.spiedigitallibrary.org/terms-of-use
However, before doing the measurement on a LOFAR station in The Netherlands, the research team wanted to test the UAV flight strategies and its hardware by performing a number of preliminary measurement on an isolated LBA. A LBA was shipped to Italy and installed on the measurement field close to Turin, where the UAV system is usually operated. As shown in this paper, the measured patterns between 40 and 70 MHz are in a very good agreement with the numerical results. Therefore, this preliminary activity is successfully concluded and the UAV system is now ready for the more challenging measurement on a full LOFAR station.
ACKNOWLEDGEMENTS
This work has been partially supported by INAF through the TECNO INAF project entitled “Advanced calibration techniques for next generation low-frequency radio astronomical arrays” (PI P. Bolli) funded in 2014.
REFERENCE
[1] van Haarlem, M. P. et al., “LOFAR: The LOw-Frequecny ARray,” Astronomy & Astrophysics, 556(A2), 1-53 (2013).
[2] Lonsdale, C. J. et al., “The Murchison Widefield Array: Design Overview,” Proceedings of the IEEE, 97(8), 1497-1506 (2009).
[3] Dewdney, P. E. and Hall, P. J. and Schilizzi, R. T. and Lazio, T. J. L. W., “The Square Kilometre Array,” Proceedings of the IEEE, 97(8), 1482-1496 (2009).
[4] Dewdney, P. E., “SKA1 System Baseline v2 Description,” SKA project document SKA-TEL-SKO-0000308, SKA Office (Manchester, UK), 4 November 2015.
[5] Virone, G. et al., “Antenna pattern verification system based on a micro unmanned aerial vehicle (UAV),” IEEE Antennas and Wireless Propagation Letters, 13, 169-172 (2014).
[6] Pupillo, G. et al., “Medicina Array Demonstrator: Calibration and Radiation Pattern Characterization Using a UAV-Mounted Radio-Frequency Source,” Experimental Astronomy, 39(2), 405-421 (2015).
[7] Paonessa, F. et al., “UAV-based pattern measurement of the SKALA,” IEEE Antennas and Propagation Society International Symposium, 1372-1373 (2015).
[8] Virone, G. et al., “Antenna pattern measurements with a flying far-field source (hexacopter),” IEEE International Conference on Antenna Measurements and Applications, Antibes Juan-les-Pins, France, Nov. 16-19, 2014.
[9] Paonessa, F. et al., “Antenna Pattern Measurement with UAVs: Cross Polarization Performance,” 36th ESA
Antenna Workshop on Antennas and RF Systems for Space Science, Noordwijk, The Netherlands, Oct. 6-9 2015.
Proc. of SPIE Vol. 9906 99063V-11
Downloaded From: https://www.spiedigitallibrary.org/conference-proceedings-of-spie on 26 May 2020 Terms of Use: https://www.spiedigitallibrary.org/terms-of-use