2020-11-16T15:56:46Z
Acceptance in OA@INAF
A 100 au Wide Bipolar Rotating Shell Emanating from the HH 212 Protostellar
Disk: A Disk Wind?
Title
Lee, Chin-Fei; Li, Zhi-Yun; CODELLA, CLAUDIO; Ho, Paul T. P.; PODIO, LINDA;
et al.
Authors
10.3847/1538-4357/aaae6d
DOI
http://hdl.handle.net/20.500.12386/28362
Handle
THE ASTROPHYSICAL JOURNAL
Journal
856
A 100 au Wide Bipolar Rotating Shell Emanating from the HH 212 Protostellar Disk:
A Disk Wind?
Chin-Fei Lee1,2 , Zhi-Yun Li3, Claudio Codella4 , Paul T. P. Ho1, Linda Podio4, Naomi Hirano1, Hsien Shang1 , Neal J. Turner5 , and Qizhou Zhang6
1
Academia Sinica Institute of Astronomy and Astrophysics, P.O. Box 23-141, Taipei 106, Taiwan;cfl[email protected]
2
Graduate Institute of Astronomy and Astrophysics, National Taiwan University, No. 1, Sec. 4, Roosevelt Road, Taipei 10617, Taiwan
3
Astronomy Department, University of Virginia, Charlottesville, VA 22904, USA
4
INAF, Osservatorio Astrofisico di Arcetri, Largo E. Fermi 5, I-50125 Firenze, Italy
5
Jet Propulsion Laboratory, California Institute of Technology, Pasadena, CA 91109, USA
6
Harvard-Smithsonian Center for Astrophysics, 60 Garden Street, Cambridge, MA 02138, USA Received 2017 October 5; revised 2018 February 5; accepted 2018 February 7; published 2018 March 20
Abstract
HH 212 is a Class 0 protostellar system found to host a “hamburger”-shaped dusty disk with a rotating disk atmosphere and a collimated SiO jet at a distance of ∼400 pc. Recently, a compact rotating outflow has been detected in SO and SO2toward the center along the jet axis at∼52 au (0 13) resolution. Here we resolve the
compact outflow into a small-scale wide-opening rotating outflow shell and a collimated jet, with the observations in the same S-bearing molecules at∼16 au (0 04) resolution. The collimated jet is aligned with the SiO jet, tracing the shock interactions in the jet. The wide-opening outflow shell is seen extending out from the inner disk around the SiO jet and has a width of∼100 au. It is not only expanding away from the center, but also rotating around the jet axis. The specific angular momentum of the outflow shell is ∼40 au km s−1. Simple modeling of the observed kinematics suggests that the rotating outflow shell can trace either a disk wind or disk material pushed away by an unseen wind from the inner disk or protostar. We also resolve the disk atmosphere in the same S-bearing molecules, confirming the Keplerian rotation there.
Key words: accretion, accretion disks – ISM: individual objects (HH 212) – ISM: jets and outflows – stars: formation
1. Introduction
The HH 212 protostellar system is a well-studied young star-forming system located in Orion at a distance of∼400 pc. The central source is the Class 0 protostar IRAS 05413-0104 (Zinnecker et al. 1992). Previous Atacama Large Millimeter/
submillimeter Array (ALMA) observations at high angular resolution at the wavelength of 850μm have detected a vertically resolved dusty disk feeding the central protostar(Lee et al. 2017b). The disk is deeply embedded in an
infalling-rotating envelope(Lee et al.2017c). It has an atmosphere that
shows a rotation motion around the central star. Detailed modeling to the kinematics of both the envelope and disk atmosphere indicates that the disk is rotating with a Keplerian rotation within∼40 au of the central star. A spinning jet is also detected, with an inferred launching radius on the disk of ∼0.05 au from the central protostar (Lee et al. 2017a). It can
carry away angular momentum from the innermost disk, allowing the material there to fall onto the central protostar.
Inside the disk itself, material is expected to be transported from the outer part to the inner part. Thus there must be a mechanism to remove the angular momentum from the material in the disk region outside the jet-launching region as well. This may be achieved with, e.g., magneto-rotational instability (Balbus & Hawley 2006) and low-velocity extended tenuous
disk wind (Konigl & Pudritz 2000). Previous CH3OH
observations at ∼240 au resolution suggested the presence of a disk wind component in HH 212 ejected from the disk at a radius of ∼1 au (Leurini et al.2016), surrounding the SiO jet.
However, our new observations at∼16 au resolution show that CH3OH actually traces the disk atmosphere within a radius of
∼40 au of the center (Lee et al.2017c). Nonetheless, disk wind
has also been suggested in other objects, e.g., CB 26 (Launhardt et al. 2009), DG Tau (Agra-Amboage
et al. 2011), Orion BN/KL Source I (Greenhill et al. 2013; Hirota et al.2017), and TMC1A (Bjerkeli et al.2016). All of
these suggest the presence of a disk wind component extracting the angular momentum from the outer disk.
In this paper, we aim to determine whether a disk wind exists in HH 212 as well, using our new high-resolution molecular line data. In previous ALMA observations at ∼200 au (0 5) resolution, Podio et al. (2015) has detected a collimated
outflow in SO and SO2extending out from the disk, inside the
large-scale molecular outflow detected in C34S (Codella et al. 2014). Recent follow-up observations at ∼52 au (0 13)
resolution toward the base of the collimated outflow have detected a compact rotating outflow that may trace a disk wind (Tabone et al.2017). Here, we zoom into the rotating outflow
in the same S-bearing molecules with ALMA at∼16 au (0 04) resolution, which is ∼3 times higher than the previous observations. At this high resolution, we resolve the outflow into a small-scale wide-opening rotating outflow shell and a collimated jet aligned with the SiO jet. We also resolve the outflow kinematics and discuss whether the rotating outflow shell traces a disk wind or disk material pushed away by an unseen inner wind that originated closer to the protostar. In addition, we also resolve the disk atmosphere in the same S-bearing molecules, confirming the Keplerian rotation there. Notice that some previous searches of disk wind were done in CO (see, e.g., Launhardt et al. 2009; Bjerkeli et al. 2016).
However, here in HH 212, CO emission is complicated, arising from both the collimated outflow and the large-scale molecular outflow, and suffering from missing flux around the systemic © 2018. The American Astronomical Society. All rights reserved.
velocity. Therefore, a detailed analysis is needed to search for a disk wind in CO. As a result, we defer our report of CO observations to a future publication.
1.1. SO and SO2around Sun-like protostars
Sulfur is severely depleted in cold molecular clouds, with an abundance being three orders of magnitude less than the cosmic abundance (e.g., Tieftrunk et al. 1994). On the other
hand, S-bearing molecules are very abundant in almost all the components associated with the low-mass star-forming process, from dark clouds to protostellar envelopes and slow outflows, as well as hot corinos (van Dishoeck & Blake1998). This is
due to the release of sulfur from the dust mantles that can be caused by either evaporation when the dust is heated to temperatures higher than∼100 K (e.g., in the hot corinos or at the disk surface), or their erosion in shocks due to gas–grain (sputtering) or grain–grain collisions (shattering), see, e.g., Pineau des Forêts et al. (1993) and Guillet et al. (2011, and references therein). In this context, S-bearing species, and, in particular, those more abundant such as SO and SO2can be
considered among the best tracers to image the high-density gas components involved in the process leading to the formation of a Sun-like star, namely, the high-velocity collimated jet (Lee et al.2010; Podio et al.2015), the accretion shock occurring at
the envelope-disk interface (Sakai et al. 2014a, 2014b; Lee et al. 2016; Sakai et al. 2017), the outflow cavity walls, and
possibly the disk surface directly illuminated and heated by the central protostar (this paper). The relative abundances of S-bearing molecules depend on the main S-compounds released from mantles, i.e., if S is released in an atomic and/ or molecular form such as H2S or OCS, a still hotly debated
open question(Wakelam et al.2004; Codella et al.2005; Podio et al.2014). In any case, SO2is expected to mainly form due to
the reaction between SO and OH (e.g., Pineau des Forêts et al. 1993). Indeed, the SO2/SO abundance ratio has been
proposed to be an efficient chemical clock to date the gas (Charnley1997; Hatchell et al.1998). Unfortunately, Wakelam
et al. (2004) and Codella et al. (2005) have shown that this
abundance ratio is not very useful, because the SO and SO2
abundances depend on the initial S-carrier on the grain mantles. In addition, both species may not be tracing the same portion of the gas.
Recent observations of SO in the inner 50 au around the L1527 protostar, located in Taurus, confirmed high SO abundances (up to 10−7) associated with the dense ( 105–6cm−3) gas revealing the accretion shock at the
envelope-disk interface (Sakai et al. 2014a, 2014b, 2016,
2017). On the other hand, before the present work, Podio et al.
(2015) traced SO high-velocity emission associated with the
HH 212, with very high abundances(up to 10−6). In addition, the authors observed outflow-velocity emission close to the protostar, showing small-scale velocity gradients, indicating that it originates partly from the rotating disk, and partly from the base of the jet, opening the way to investigations at higher spatial scale. Also the SO abundances in the HH 212 jet have been estimated to be very high, up to 10−6, confirming what was suggested by Lee et al.(2010) for the HH 211 protostellar
jet. Also the SO2abundance has been measured to be∼10−6.
On the other hand, Podio et al. (2015) found in the HH 212
disk XSO=10−8–10−7, i.e., values higher by 3–4 orders of
magnitude than those derived in protoplanetary disks(Fuente et al. 2010; Dutrey et al. 2011). These high abundances are
plausibly due to either violent shocks caused by jets traveling, or slow shocks occurring close to the protostar, such as the accretion shocks already observed in HH 212 by Lee et al. (2017a).
2. Observations
Observations of the HH 212 protostellar system were carried out with ALMA in Band 7 at ∼350 GHz in Cycle 3, with 32–45 antennas (see Table1). Two executions were carried out
in 2015, one on November 5 and the other on December 3. The projected baselines are 17–16196 m. The maximum recover-able size(MRS) scale is ∼0 4, enough to cover the compact outflow seen in SO and SO2near the central source (Tabone
et al. 2017). One pointing was used to map the center of the
system. The correlator was set up to have six spectral windows, with one for SO NJ=89–78at 346.528481 GHz, one for CO
J=3−2 at 345.795991 GHz, one for H13CO+ J=4−3 at 346.998338 GHz, one for SiO J=8−7 at 347.330631 GHz, one for HCO+J=4−3 at 356.734288 GHz, and one for the continuum at 358 GHz with many weak SO2 lines (see
Table2). The total time on the HH 212 system is ∼88 minutes. Table 1
Observation Logs
Cycle Date Array Number of Time on target Baselines
(YYYY MM DD) Configuration Antennas (minutes) (meter)
3 2015 Nov 05 C36-7/8 45 44 78−16196
3 2015 Dec 03 C36-7/8 32 44 17−6344
Table 2
Correlator Setup for Cycle 3 Project
Spectral Line or Number of Central Frequency Bandwidth Channel Width
Window Continuum Channels (GHz) (MHz) (kHz)
0 SO NJ=89–78 960 346.528 234.375 244.140 1 CO J=3−2 960 345.796 234.375 244.140 2 H13CO+J=4−3 960 346.998 234.375 244.140 3 SiO J=8−7 960 347.330 234.375 244.140 4 HCO+J=4−3 1920 356.735 468.750 244.140 5 Continuum 1920 357.994 1875.000 976.562
The data were calibrated with the CASA package (version 4.5) for the passband, flux, and gain (see Table3). In this paper,
we only present the observational results in SO and SO2 in
order to search for a disk wind. The velocity resolution is ∼0.212 km s−1 per channel for the lines in the spectral line
windows and ∼0.848 km s−1 per channel for the lines in the continuum window. In order to improve the signal-to-noise ratio in the spectral line windows, we binned four channels to make a bigger channel with a width of ∼0.848 km s−1. We used a Briggs weighting with a robust factor of 0.5 for the visibility weighting to generate the SO and SO2channel maps
at an angular resolution of∼0 04 and a velocity resolution of Δvc=0.848 km s−1 per channel. In generating the SO and
SO2maps, the data with the uv-distance greater than 12,000 m
and 8000 m (with a corresponding angular scale of ∼0 015 and 0 022, respectively) are excluded, respectively, because no emission is detected there. Also an outer taper of 0 03 was used to obtain a better signal-to-noise ratio. The noise level can be measured from line-free channels. It is ∼1.85 mJy beam−1 (or ∼12.4 K) for the SO channel maps. Twelve SO2lines are
detected (see Table 4) and stacked, and the noise level is
∼0.48 mJy beam−1 (or ∼3.0 K) for the resulting SO
2channel
maps. The velocities in the channel maps are LSR velocities. Various integrated maps are produced with various velocity ranges in order to show the low-velocity, high-velocity, and total integrated maps. The rms levels in those maps are estimated from the emission-free region in the same map or the emission-free integrated map with the same velocity width.
3. Results
For comparison, Figure1(a) shows the previous maps of the
dusty accretion disk in the 850μm continuum (Lee et al.
2017b), the disk atmosphere in CH2DOH (Lee et al.2017c),
and the collimated jet in SiO (Lee et al. 2017a). These maps
have been rotated by 22°.5 clockwise to align the jet axis in the north–south direction in order to facilitate our presentations.
The jet has a mean inclination angle of∼4°±2° to the plane of the sky, with the northern component tilted toward us (Claussen et al. 1998; Lee et al. 2007). The disk is
perpendicular to the jet axis and nearly edge-on with the nearside titled slightly by ∼4°±2° to the south (Lee et al.
2017b). The atmosphere is better detected in the south than in
the north. In the following, our maps of SO and SO2 are
presented together with the jet, disk, and disk atmosphere in order to show the connection to them. In this system, the systemic velocity is assumed to be Vsys=1.7±0.1 km s−1
LSR(Lee et al.2007), which is a mean value estimated before
in CO J=1–0 (Lee et al. 2000) and NH3 (1, 1) (Wiseman
et al.2001). Figure2shows our SO and SO2spectra extracted
from a rectangular region (0 4×0 2 with the long side aligned with the jet axis) covering the emission from the central region. As can be seen, the systemic velocity lies roughly at the center of the spectra. Throughout this paper, in order to facilitate our presentations, we define an offset velocity Voff=VLSR − Vsys. Also, velocities with ∣Voff∣3km s−1 are referred to as low and those outside the range as high. The low-velocity range is selected to show the disk atmosphere and a small-scale wide-opening outflow extending out from the inner disk, as discussed below.
3.1. SO Emission Morphology
A compact outflow has recently been detected in SO at ∼0 13 resolution, extending out from the central source along the jet axis(Tabone et al.2017). Now at ∼0 04 resolution, we
can resolve the outflow and check for a disk wind component. As shown in the total integrated emission map in Figure1(b),
the SO emission is detected here within∼±0 5 of the central source around the SiO jet, extending out from the inner disk. The emission has a velocity with ∣Voff∣10km s−1. SO emission is also detected in the disk atmosphere, overlapping with the CH2DOH emission. No SO emission is detected in the
dusty disk, likely because the continuum emission is bright and
Table 3
Calibrators and Their Flux Densities
Date Bandpass Calibrator Flux Calibrator Phase Calibrator
(YYYY MM DD) (Quasar, Flux Density) (Quasar, Flux Density) (Quasar, Flux Density)
2015 Nov 05 J0423−0120, 0.55 Jy J0423−0120, 0.55 Jy J0541−0211, 0.22 Jy
2015 Dec 03 J0510+1800, 4.07 Jy J0423−0120, 0.67 Jy J0541−0211, 0.23 Jy
Table 4
Line Properties from Splatalogue
Molecule Frequency Transition Sijμ2 log10(Aij) Eup Linelist
(GHz) QNs (D2) (s−1) (K) SO 346.52848 9(8)–8(7) 21.52703 −3.26062 78.77510 JPL SO2 356.75519 10(4, 6)–10(3, 7) 13.03465 −3.48408 89.83365 JPL SO2 357.16536 13(4, 10)–13(3, 11) 17.87923 −3.45447 122.96459 JPL SO2 357.24119 15(4, 12)–15(3, 13) 21.14165 −3.44140 149.68170 JPL SO2 357.38757 11(4, 8)–11(3, 9) 14.64155 −3.47079 99.95222 JPL SO2 357.58145 8(4, 4)–8(3, 5) 9.76046 −3.51492 72.36335 JPL SO2 357.67178 9(4, 6)–9(3, 7) 11.40052 −3.49544 80.63686 JPL SO2 357.89244 7(4, 4)–7(3, 5) 8.08092 −3.54144 65.01106 JPL SO2 357.92596 6(4, 2)–6(3, 3) 6.34115 −3.58446 58.57965 JPL SO2 357.96289 17(4, 14)–17(3, 15) 24.42371 −3.42881 180.11104 JPL SO2 358.01309 5(4, 2)–5(3, 3) 4.49029 −3.66149 53.06831 JPL SO2 358.03808 4(4, 0)–4(3, 1) 2.44211 −3.83876 48.47653 JPL SO2 358.21564 20(0, 20)–19(1, 19) 44.65235 −3.23457 185.32964 JPL
optically thick there (Lee et al. 2017c); thus, the emission
behind it is blocked and the emission in front of it appears absorbed against the bright background.
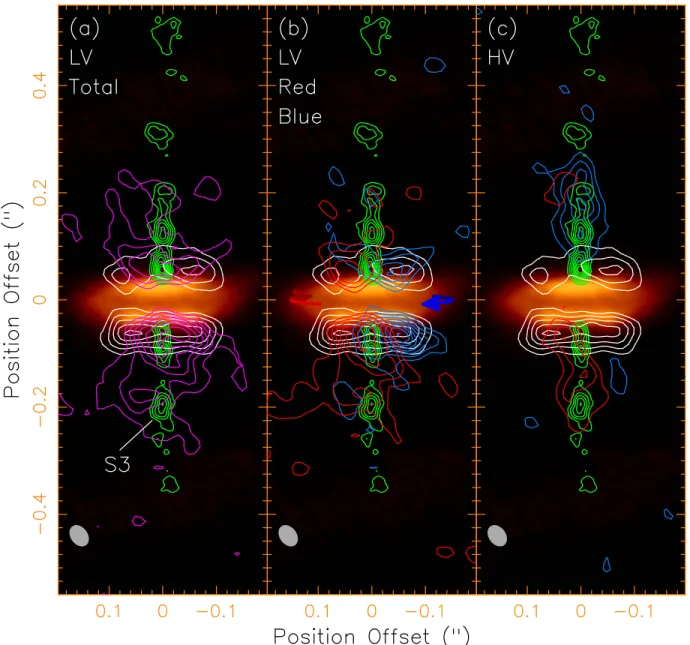
Figure3shows the SO maps at low and high velocities. At low velocity, the outflow can be decomposed into two components, a wide-opening outflow extending out to ∼0 2 to the north and south from the inner disk, and a collimated jet along the jet axis(Figure3(a)). The wide-opening outflow is
reasonably resolved in the north, appearing as a shell structure opening out from the central source. The shell structure of the outflow can be better seen in the position–velocity (PV) diagrams as discussed below in Section3.3. In the shell outside the atmosphere, the blueshifted emission overlaps with the redshifted emission(Figure3(b)), indicating that the shell there
is mainly radially expanding. At high velocity, the SO emission is seen around and along the jet axis(Figure3(c)). As discussed
later, since the projected velocity of the expanding shell can
reach up to Voffof±5 km s−1, part of the emission traces the
expanding shell projected on the jet axis. The emission peaks that spatially coincide with knots N3, N1, S1/S2, S3, and S4 should mainly trace the jet itself. Like the SiO jet, the blueshifted emission is seen more to the north and the redshifted emission is seen more to the south.
3.2. SO2Emission Morphology
A compact outflow has also been detected recently in SO2at
∼0 13 resolution (Tabone et al. 2017). Thus, we can also
check for a disk wind component in SO2. Here 12 SO2lines are
detected (see Table 4) with∣Voff∣ 8 km s−1. They are weak and thus stacked to produce a mean SO2 line with a better
signal-to-noise ratio. As shown in the total integrated emission map in Figure1(c), the SO2emission is detected within∼±0 3
of the central source, not only tracing the outflow but also
Figure 1.ALMA SO and SO2maps toward the center of the HH 212 system, on top of the dusty disk(orange image, from Lee et al.2017b), the disk atmosphere
(white contours, from Lee et al.2017c), and the SiO jet (green contours, from Lee et al.2017a). The maps are all rotated by 22°.5 clockwise to align the jet axis in the
north–south direction. The star marks the position of the central protostar. The magenta contours in (b) and (c) show the total integrated maps of SO (Voff∼−10.0 to
10.0 km s−1) and SO2 (Voff∼ −7.9 to 6.5 km s−1), respectively. The contours start at 3σ with a step of 2σ, where σ=0.009 Jy beam−1km s−1 and
tracing the inner disk atmosphere. No SO2emission is detected
toward the dusty disk because of the same reason as discussed above.
Figure4shows the SO2maps at low and high velocities. At
low velocity, unlike the SO emission, the SO2emission traces
mainly the inner disk atmosphere, as seen in Figures 4(a) and
(b). The disk atmosphere is rotating with the redshifted emission in the east and blueshifted emission in the west, the same rotation sense as that found before in CH2DOH, as
indicated by the blue and red arrows in Figure4(b). Like that
seen in SO, the outflow in the north can also be decomposed into a wide-opening outflow and a collimated jet. In the north, the shell structure of the wide-opening outflow can be seen in the east. In the south, the shell structure can only be barely seen in the east, because it is contaminated by the emission around knot S3. At high velocity, like the SO emission, the SO2
emission is mainly seen around the jet axis, with the blueshifted emission to the north and redshifted emission to the south (Figure 4(c)).
3.3. Kinematics
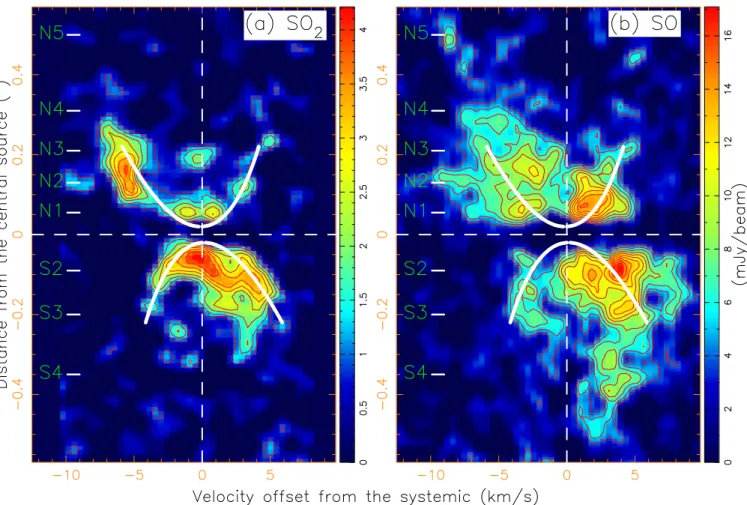
Figure 5 shows the position–velocity (PV) diagrams along the jet axis in SO and SO2 in order to study the expansion
velocity of the wide-opening outflow. The PV diagram of the SO2emission shows roughly a parabolic structure opening up
from the source position to ∼0 2 to the north and south to Voff∼±5 km s−1, as guided by the white curves. The PV
diagram of the SO emission is complicated. Part of the SO emission follows the parabolic structure seen in SO2and part of
the SO emission is associated with the knots in the jet. The parabolic PV structure is associated with the wide-opening outflow, supporting that the wide-opening outflow is a shell and that the expansion velocity of the shell increases with the distance.
Figure 6 shows the intensity weighted velocity (first moment) maps of the SO and SO2emission at low velocities
in order to search for the rotation in the shell. In SO, the eastern and western outer edges (as roughly delineated by the white curves) of the shell mostly have opposite velocities (Figure 6(a)), indicating that the shell is also rotating around
the jet axis, in addition to the expansion mentioned above. The
rotation of the shell has the same sense as that of the disk, as indicated by the red and blue arrows. On the other hand, as discussed earlier, the SO2 emission mainly arises from the
rotating disk atmosphere(Figure 6(b)). The outflow edges are
too faint in SO2to appear in thisfigure.
3.3.1. Rotation and Expansion in the Shell
Figure7 shows the PV diagrams cut across the jet axis at increasing distance z from the disk midplane with a step of 0 025(or 10 au) to the north and south, in order to study the expansion and rotation in the shell in detail. Since the kinematics in the northern part is better resolved than that in the southern part, our kinematic study here is based mainly on the northern part.
Near the bottom of the northern atmosphere at z=0 05, the PV diagram shows the redshifted emission in the east and blueshifted emission in the west(Figure7(a)), as expected for a
rotating disk atmosphere. In addition, the SO emission shows a velocity increasing toward the center, with the outer boundary of its PV structure well described by the Keplerian rotation velocity profile (magenta curves) due to the central protostar (Lee et al.2017c). This confirms the presence of a rotationally
supported disk orbiting the protostar. The mass of the protostar is∼0.25 Mefrom the kinematics of the disk and envelope in molecular lines(Lee et al.2017c). At low velocities where the
emission traces the outer part of the atmosphere, the PV structure can be roughly described by a tilted elliptical structure as guided by the green ellipse. This outer part is also seen in SO2emission. This PV structure confirms that the outer part of
the atmosphere is not only rotating but also expanding(Hirota et al.2017), indicating that the atmosphere there has become a
part of the outflow shell. The upper part of the ellipse is much fainter than the lower part, probably because the emission in the nearside is self-absorbed. As we go higher up in the atmosphere to z=0 075, the elliptical PV structure becomes broader in the minor axis (Figure 7(b)), indicating that the
expansion motion becomes faster higher up, consistent with the discussion above.
In the shell slightly above the disk atmosphere at z=0 1, the PV diagrams also show a tilted elliptical PV structure (green ellipse, Figure7(c)), indicating that the shell there is also
rotating and expanding. As compared to that seen in the atmosphere, it is broader in the minor axis, indicating that the expansion motion is faster. As we go further to the north to z 0 125, the PV structure can be decomposed into two components, one with an elliptical structure for the shell, and the other along the jet axis tracing the emission in the jet (Figures 7(d)–(g)). The major axis of the ellipse is almost
aligned with the x-axis, indicating that the gas motion in the shell is dominated by the expansion. In addition, the SO2
emission of the shell becomes very faint at low velocities, thus the limb-brightened shell(outflow edge) becomes faint and not detected, as seen in Figure4(a). As a result, the emission of the
shell is mainly detected at high velocities, appearing mainly around the jet axis, as seen in Figure4(c).
In the southern part, similar elliptical PV structures can also be roughly seen for the shell in the atmosphere(Figures 7(h)
and (i)). However, no clear elliptical PV structures can be identified easily (Figures 7(j)–(n)) in the PV diagrams above
the disk atmosphere. Therefore, we will not attempt to fit the PV structures here because the results would be quite uncertain.
Figure 2. SO(gray curve) and SO2 (black curve) spectra averaged over a
rectangular region of 0 4×0 2 centered at the central source aligned with the jet axis. The SOflux density has been divided by 5 in order to be plotted with SO2.
The physical properties (e.g., radius, rotation velocity, expansion velocity, and specific angular momentum) of the shell in the north, where the shell is detected at a higher signal-to-noise ratio and better resolved, can be estimated from the elliptical PV structures seen in the PV diagrams cut across the jet axis in Figures 7(a)–(g). As can be seen, the elliptical PV
structures can be roughly described by the green ellipses in the figures. Since the elliptical PV structures are not well defined, we only used an eye-fitting to roughly obtain the green ellipses, which are required to pass through the emission in the shells as much as possible. From these green ellipses, the radius of the shell is given by the maximum position offset from the jet axis, the rotation velocity is given by the velocity at the maximum position offset with respect to the velocity centroid of the ellipse, and the expansion velocity is given by the velocity at the zero position offset with respect to the velocity centroid of the ellipse. The specific angular momentum is then derived by
multiplying the rotation velocity with the radius. These physical quantities of the shell are shown in Figure 8, with their uncertainties described in the caption. Since the inclina-tion angle of the outflow is small, no correction is needed for the inclination effect. As expected, the shell becomes wider with the distance (Figure 8(a)). Interestingly, the rotation
velocity is roughly the same as the expansion velocity in the shell inside the atmosphere, but becomes much smaller than the expansion velocity in the shell outside the atmosphere (Figure 8(b)). The specific angular momentum in the shell is
roughly constant at∼40 au km s−1within∼50 au of the central source, and then decreases to ∼25 au km s−1 at ∼80 au (Figure8(c)). This decrease in the specific angular momentum
is uncertain because the rotation velocity cannot be estimated accurately outside the atmosphere due to the poorly identified elliptical PV structure.
Figure 3.Low-velocity and high-velocity SO maps. The orange image, white contours, and green contours have the same meaning as those in Figure1.(a) The total low-velocity map with Voff∼−3 to 3 km s−1.(b) The blueshifted (Voff∼−3 to 0 km s−1) and redshifted (Voff∼ 0 to 3 km s−1) low-velocity maps separately.
(c) The blueshifted (Voff∼ −10 to −3 km s−1) and redshifted (Voff∼ 3 to 10 km s−1) high-velocity maps separately. The star marks the protostar position. The white
curves in panel(a) guide the readers for the shell structure. The contour levels start at 3σ with a step of 2σ, where σ=4.5 mJy beam−1km s−1in panels(a) and (c), and 3 mJy beam−1km s−1in panel(b).
3.4. Physical Condition in the Disk Atmosphere and Shell With 12 SO2lines detected, we can construct a population
diagram (Goldsmith & Langer1999) to estimate the rotational
temperature and the column density of the molecule in the disk atmosphere, the wide-angle outflow shell, and the collimated jet. It is a diagram that plots the column density per statistical weight in the upper energy state in the optically thin limit,
Nuthin gu, versus the upper energy level Euof the lines. Here p n
= ( )
Nuthin 8 k 2 hc A3 ul W, where the integrated line intensity
ò
=W T dvB with TBbeing the mean brightness temperature.
The integrated line intensity of each transition can be measured for the SO2emission in the south, where the emission
is detected at a higher signal-to-noise ratio. The resulting population diagram is shown in Figure9. Fitting the data points with Eu>70 K, we estimate a rotational temperature of
81±20 K and a column density of 8.2±2.0×1015cm−2. Notice that the data points with Eu<70 K are not used for the
fitting because their emissions are only barely detected, with their intensity slightly over 3σ. These estimated values are mainly for the disk atmosphere and the outflow shell, because SO2emission is mainly detected there.
The SO emission traces mainly the outflow shell and the collimated jet. The excitation temperature is unknown. Along the jet axis, the emission has a peak brightness temperature of ∼150 K and a mean integrated line intensity of 700 K km s−1.
Thus, we assume a temperature of ∼200–300 K in the collimated jet, which is consistent with the temperature range discussed in Podio et al. (2015). The column density of SO
there is then estimated to be ∼(1.5–1.8)×1016cm−2. In the shell, the mean integrated line intensity is∼400 K km s−1. The excitation temperature can be assumed to be∼100 K, which is an approximation to that derived above in SO2 for the disk
atmosphere and the outflow shell. Thus, the SO column density is estimated to be∼6×1015cm−2in the outflow shell.
Figure 4.Low-velocity and high-velocity SO2maps. The orange image, white contours, and green contours have the same meaning as those in Figure1.(a) The total
low-velocity map, with Voff∼−3 to 3 km s−1.(b) The blueshifted (Voff∼ −3 to 0.0 km s−1) and redshifted (Voff∼ 0 to 3 km s−1) low-velocity maps separately. The
red and blue arrows show the rotation of the disk.(c) The blueshifted (Voff∼−7.9 to −3 km s−1) and redshifted (Voff∼ 3 to 6.5 km s−1) high-velocity maps
separately. The star marks the protostar position. The white curves in panel(a) guide the readers for the shell structure. The contour levels start at 3σ with a step of 2σ, whereσ=1.5 mJy beam−1km s−1in panel(a), and 1.1 mJy beam−1km s−1in panels(b) and (c).
The abundances of SO and SO2have been estimated before at
lower resolution by comparing their column density to that derived from the CO J=3−2 emission (see Table 3 in Podio et al. 2015) and thus can be used here to derive the mean H2
column density. With a SO abundance of (1–10)×10−7, the mean H2column density is estimated to be(6–60)×1021cm−2
in the SO shell. With a SO2abundance of(5–12)×10−7, the
mean H2column density is estimated to be(5–12)×1021cm−2
in the SO2shell. Given that the thickness of the shell is50 au,
the mean H2density is(4–40)×106cm−3in the SO shell, and
(3–8)×106
cm−3in the SO2shell. As can be seen, the SO shell
could have a higher mean H2density than that in the SO2shell.
4. Discussion 4.1. Disk wind?
In star formation, one important topic is to search for a low-velocity disk wind that can carry away the disk angular momentum, allowing the disk material to accrete. Previously, a rotating outflow was detected in CB 26 in CO J=2−1 emission and was argued to trace a disk wind launched from a radius of ∼30 au in the disk (Launhardt et al.2009). Later, a
rotating outflow was also detected in Orion BN/KL Source I in SiO maser, appearing to be a disk wind launched from a radius of∼20 au in the disk (Matthews et al.2010). In recent
follow-up observations of the same object, a rotating outflow was also detected further out in Si18O, and argued to trace a disk wind launched from a radius of >10 au (Hirota et al. 2017).
Recently, another rotating outflow was detected in TMC1A
in CO J=2–1, and also argued to trace a disk wind launched from a radius of >5 au in the disk (Bjerkeli et al. 2016).
Another example is HH 30, where a rotating CO (J=2–1) shell is observed to surround one side of the bipolar optical jet (F. Louvet et al. 2018, in preparation).
In HH 212, we can search for a disk wind emerging from the well-resolved disk. As discussed later, the wind’s source can be on the disk 2–3 au from the protostar. At this radius, the density and temperature on the disk surface (at one scale height) are estimated to be∼(2–4)×1012cm−3and 770–1050 K, respec-tively, based on the disk model in Lee et al.(2017b). Thus, our
SO and SO2 lines, with a critical density of ∼10 7
cm−3, are better tracers of a disk wind than the CO J=2–1 line, which has a critical density of∼104. However, note that, since only charged particles are directly coupled to the magnetic field, neither CO and SO/SO2 can be directly accelerated by a magnetic field; they must be coupled to magnetically accelerated charged particles through collisions.
Recently, a compact outflow has been detected in HH 212 at ∼52 au (0 13) resolution, extending out from the disk (Tabone et al.2017). It is rotating and thus may trace a disk wind. Now
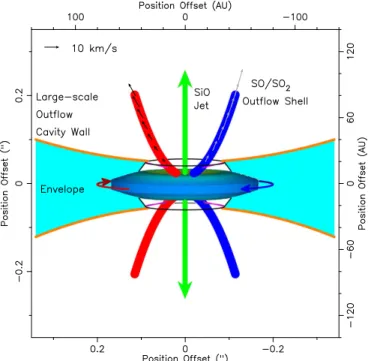
at∼16 au (0 04) resolution, the compact outflow is found to consist of two distinct components: a wide-angle outflow shell and a collimated jet. The collimated jet is aligned with the SiO jet and thus likely traces the shock interactions along the jet axis. Interestingly, the outflow shell lies within the large-scale molecular outflow detected in C34S (Codella et al. 2014) and
HCO+(Lee et al.2017c), and is thus not the rotating envelope
material pushed away by the underlying wind or jet (see
Figure 5.Position–velocity diagrams of the SO (contours) and SO2(color image) emissions cut along the jet axis. The contours start at 3σ with a step of 1σ, where
Figure10for various components). Moreover, it is rotating and seen extending out from the inner disk at a radius of <20 au within the centrifugal barrier(Lee et al.2017c), and thus may
trace a disk wind coming out from there. The specific angular momentum is roughly constant at ∼40 au km s−1 within ∼50 au of the central source. This specific angular momentum corresponds to that at ∼7.2 au in the disk, where the rotation velocity is ∼5.5 km s−1, assuming a central mass of 0.25 Me (Lee et al.2017c). It decreases to ∼25 au km s−1at a distance of ∼80 au. This decrease in specific angular momentum could be inconsistent with that expected for a disk wind; however, further observations are needed to confirm this. On the other hand, it is also possible that the SO/SO2outflow shell is the
disk/atmosphere material pushed up and out by a wind launched at the innermost disk, e.g., by a wide-angle radial wind component surrounding the fast jet as in the X-wind model.
The shell kinematics could be used to differentiate the above two origins of the outflow shell. If the shell traces the disk wind itself, the velocity vectors are expected to be parallel to the shell structure. If the shell traces the disk or atmosphere material pushed away by a wide-angle radial wind, then the velocity vectors in the shell are expected to be radially directed. For simplicity, the shell here can be assumed to roughly have a parabolic structure with z=CR2+0 02 in the cylindrical coordinate system and C∼14 arcsec−1 (as indicated by the
Figure 6.Intensity weighted velocity(first moment) maps of the SO and SO2emission at low velocities, plotted together with the maps of the dusty disk(gray
Figure 7.PV diagrams of the SO and SO2emissions across the jet axis at increasing distance from the central source. Left column is for the north and right is for the
south. The number in the upper left corner indicates the distance from the central source along the jet axis. The gray image with black contours is for SO emission. The contours start at 3σ with a step of 2σ, where σ=1.1×10⁻³Jy beam−1. Red contours are for SO2emission. The contours start at 3σ with a step of 1.5σ, where
σ=3.4×10⁻⁴Jy beam−1. The green ellipses guide the readers for the elliptical PV structures of the shell. The magenta curves show the Keplerian rotation velocity
white curves in Figure6). If the shell material is moving along
the shell, then we have vR=v0R and vz=2v0z in the
cylindrical coordinate system. If the shell material is radially expanding, then we have vR=v0R and vz=v0z (Lee et al.
2000). Figure11shows the model PV structures of these two models at an inclination angle of ∼4°, in comparison to the observed PV structures. The solid curves are from the radially expanding shell model with v0∼42 km s−1 arcsec−1 and the
dotted curves are from the material moving along the shell model with v0∼45 km s−1arcsec−1. The velocity vectors and
magnitudes in these two models are shown in Figure10, with the black arrows for the former and gray arrows for the latter. As can be seen, both model PV structures can match the observed PV structure reasonably well. Therefore, unfortu-nately, we cannot determine which model is better based on the kinematics here in HH 212. Having said that, it is unclear whether a disk wind can have an expansion speed that increases with the distance from the disk and at the same time a specific angular momentum that decreases with distance. For a shell accelerated by an underlying wide-angle radial wind, it is reasonable to have an expansion velocity increasing with the distance (Shu et al. 1991; Lee et al. 2000), because the disk
atmosphere has a density decreasing with height. Whether the specific angular momentum can naturally decrease with distance in this scenario is uncertain. In addition, the shell in the north is seen connecting to knot N4 further north, which is likely also affected by it(see Figure3).
Another question we can ask is the following: does the wide-angle wind component of an X-wind, if it exists, have enough momentum to drive the outflow shell? The mass of the shell can be roughly estimated from the mean H2column density derived
from the SO emission in Section3.4. Thus, the total mass of the shell within∼0 2 of the central source in the north and south is
= ~
Ms 1.4m N AH2 H2 (0.4–4)×10
−4M
e, where A is the area of
Figure 8.Radius, expansion velocity, rotation velocity, and specific angular momentum of the shell in the north at different distances from the central source above the disk midplane. They are derived from the elliptical PV structures seen in Figures 7(a)–(g). The radius is assumed to have an
uncertainty of 20%. The expansion velocity is assumed to have an uncertainty of 20% or 0.5 km s−1(about a half of the channel width), whichever is larger. The rotation velocity is small and thus assumed to have an uncertainty of 0.5 km s−1(i.e., about half of the channel width). The resulting uncertainty in the specific angular momentum is about 30%–50%.
Figure 9.Population diagram for SO2, derived from the total intensity map for
the disk atmosphere and outflow shell in the south. The error bars show the uncertainties in our measurements, which are assumed to scale inversely with the integrated line intensity, with 25% of the data values for the highest integrated line intensity and 50% for the lowest integrated line intensity. The solid line is a linearfit to the data with Eu> 70 K.
Figure 10.Schematic diagram showing the wide-opening SO/SO2 outflow
shell in connection to the SiO jet, and other components(e.g., infalling-rotating envelope, dusty disk, disk atmosphere, and large-scale outflow cavity walls) presented in Figure 9(b) of Lee et al. (2017c). Black arrows show the velocity
vectors in the radially expanding shell model, while gray arrows show the velocity vectors in the material moving along the shell model.
the shell. Assuming a mean expansion velocity of∼5 km s−1in the shell, the momentum is then(0.2–2)×10−3Mekm s−1. In the X-wind model, the wide-angle wind component could have a mass-loss rate and a velocity similar to those of the jet component (Shu et al.1995). The jet component was found to have a
mass-loss rate of∼10−6Meyr−1and a velocity of∼100 km s−1(Lee et al. 2015). According to our simple radially expanding model
for the shell, the shell has a dynamical age of 1/v0or∼45 years,
indicating that the shell could have been driven for that long by an underlying wind. Thus, the wide-angle wind component can, in principle, provide an accumulated momentum of ∼4.5× 10⁻³Mekm s−1, enough to drive the shell.
One more question to ask is the following: why is there only one shell? In the case of a radial expanding shell, the shell has a dynamical age much younger than the age of HH 212. Since the jet is episodic, the inner wind that drives the shell should also be episodic. Since the semi-periodic spacing between two bow shocks in the jet is∼3″ (Lee et al.2007), the period for the
major ejection of the jet/wind is ∼50 years and thus slightly longer than the dynamical age of the shell. Therefore, it is possible that the shell was produced recently and the earlier shells are lost in the outflow cavity probably because the density becomes too low to excite the SO and SO2lines. Or as
suggested in Tabone et al.(2017), the shell traces an onion-like
shell in the disk wind coming out from the disk around the SiO jet (see their Figure 3), but the part further away from the
central source is lost in the cavity.
Independent of the exact mechanism for producing the outflow shell, if it is really rotating with a specific angular
momentum of∼40 au km s−1, it is likely coming from the disk at a relatively large radius of at least several astronomical units. If the outflow is indeed an MHD disk wind from the disk, then using Equation (4) in Anderson et al. (2003), and an outflow
velocity of 5–10 km s−1, the launching radius is estimated to be 2–3 au. The specific angular momentum is much larger than the mean value for the SiO jet(∼10 au km s−1), indicating that the outflow shell is not simply the jet angular momentum and is much larger than the mean value for the SiO jet(∼material that is swept into a shell). One may argue that the shell material may come from the infalling protostellar envelope that extends all the way to less than several astronomical units above and below the disk. However, the large-scale outflow cavity wall, which presumably marks the inner boundary of the envelope, is located well outside of the outflow shell (as indicated in the cartoon of Figure10). Furthermore, in the case of a much more evolved T
Tauri star HH 30, there is little evidence for a large-scale envelope, and yet a rotating, expanding shell is still observed surrounding the jet (F. Louvet et al. 2018, in preparation), indicating that an envelope is not needed for producing such a structure. This leaves the material coming directly from the disk as the most likely material for the outflow shell.
The key question is whether that disk material in the outflow shell is launched from the several astronomical unit radius by some mechanism internal to the local disk, such as through magnetocentrifugal acceleration or magnetic pressure gradient, or by some external agents, such as interaction with a wide-angle wind surrounding the SiO jet. Indeed, the two mechanisms are not mutually exclusive: outflow launched from the several
Figure 11.Same as Figure5, but with two model PV structures added. The solid curves are for the radial expanding shell model with v0∼42 km s−1arcsec−1and the
astronomical unit radius is expected to interact with the wide-angle wind interior to it, if such a wind exists. In any case, the rotating outflow shell carries away angular momentum from the disk, most likely from the several astronomical unit radius, which is in contrast with the rotating SiO jet driven from the ∼0.05 au radius.
4.2. Formation of SO and SO2
Previous observations of HH 212 at an angular resolution of ∼0 5 have shown that the SO and SO2 abundances in the
outflow are very high, up to ∼10−6(Podio et al.2015). Now at
higher resolution, the outflow is resolved into a small-scale wide-opening outflow shell and a collimated jet. The high SO and SO2 abundances in the collimated jet could be due to
violent (internal) shocks in the jet. The origin of high abundances in the wide-angle outflow shell is uncertain. If the shell traces a disk wind launched from the disk, then the high abundances could be due to the thermal sublimation of icy mantles near the source and the gradual heating by ambipolar diffusion during MHD acceleration (Panoglou et al.2012). If
the shell is the disk/atmosphere material pushed away by an inner wind, then the high abundances could be due to shock interactions with the inner wind.
As for the disk, Podio et al. (2015) have found a high SO
abundance of 10−8–10−7. Our observations also show high SO and SO2column densities(see Section3.4) and thus high SO
and SO2abundances there in the disk atmosphere. These high
abundances in the disk atmosphere could be due to the accretion shocks already observed in HH 212 by Lee et al. (2017a), radiation heating by the central protostar, or shock
interactions with an inner wind. 5. Conclusions
We have mapped the central 400 au region in the HH 212 protostellar system in SO and SO2, with the Atacama Large
Millimeter/submillimeter Array at ∼16 au resolution. We have resolved the compact outflow near the central source into a wide-opening rotating outflow shell with a width of ∼100 au and a collimated jet. The collimated jet is aligned with the SiO jet and thus likely traces the shock interactions along the jet axis. The wide-opening outflow shell is seen around the base of the collimated SiO jet, extending out from the inner disk. It is not only expanding away from the center, but also rotating around the jet axis. The specific angular momentum of the outflow shell is ∼40 au km s−1. Simple modeling suggests that this rotating outflow shell can trace either a disk wind or disk material pushed away by an unseen inner wind. We also resolve the disk atmosphere traced by the two S-bearing molecules, confirming the Keplerian rotation there.
We thank the anonymous referee for useful comments. This paper makes use of the following ALMA data: ADS/JAO. ALMA# 2015.1.00024.S. ALMA is a partnership of ESO (representing its member states), NSF (USA), and NINS (Japan), together with NRC (Canada), MoST and ASIAA (Taiwan), and KASI (Republic of Korea), in cooperation with the Republic of Chile. The Joint ALMA Observatory is operated by ESO, AUI/NRAO, and NAOJ. C.-F.L. acknowl-edges grants from the Ministry of Science and Technology of Taiwan(MoST 104-2119-M-001-015-MY3) and the Academia Sinica (Career Development Award). Z.Y.L. is supported in
part by NASA NNX14AB38G and NSF AST-1313083 and 1716259. This research was carried out in part at the Jet Propulsion Laboratory, California Institute of Technology, under a contract with the National Aeronautics and Space Administration.
ORCID iDs
Chin-Fei Lee https://orcid.org/0000-0002-3024-5864
Claudio Codella https://orcid.org/0000-0003-1514-3074
Hsien Shang https://orcid.org/0000-0001-8385-9838
Neal J. Turner https://orcid.org/0000-0001-8292-1943
Qizhou Zhang https://orcid.org/0000-0003-2384-6589
References
Agra-Amboage, V., Dougados, C., Cabrit, S., & Reunanen, J. 2011,A&A,
532, A59
Anderson, J. M., Li, Z.-Y., Krasnopolsky, R., & Blandford, R. D. 2003,ApJL,
590, L107
Balbus, S. A., & Hawley, J. F. 2006,ApJ,652, 1020
Bjerkeli, P., van der Wiel, M. H. D., Harsono, D., Ramsey, J. P., & Jørgensen, J. K. 2016,Natur,540, 406
Charnley, S. B. 1997,ApJ,481, 396
Claussen, M. J., Ma.rvel, K. B., Wootten, A., & Wilking, B. A. 1998,ApJL,
507, L79
Codella, C., Bachiller, R., Benedettini, M., et al. 2005,MNRAS,361, 244
Codella, C., Cabrit, S., Gueth, F., et al. 2014,A&A,568, L5
Dutrey, A., Wakelam, V., Boehler, Y., et al. 2011,A&A,535, A104
Fuente, A., Cernicharo, J., Agúndez, M., et al. 2010,A&A,524, A19
Goldsmith, P. F., & Langer, W. D. 1999,ApJ,517, 209
Greenhill, L. J., Goddi, C., Chandler, C. J., Matthews, L. D., & Humphreys, E. M. L. 2013,ApJL,770, L32
Guillet, V., Pineau des Forêts, G., & Jones, A. P. 2011,A&A,527, 123
Hatchell, J., Thompson , M. A., Millar, T. J., & MacDonald, G. H. 1998, A&A,
338, 713
Hirota, T., Machida, M. N., Matsushita, Y., et al. 2017,NatAs,1, 0146
Konigl, A., & Pudritz, R. E. 2000, in Protostars and Plane IV, ed. V. Mannings, A. P. Boss, & S. S. Russell(Tucson, AZ: Univ. Arizona Press),759
Launhardt, R., Pavlyuchenkov, Y., Gueth, F., et al. 2009,A&A,494, 147
Lee, C.-F., Hasegawa, T. I., Hirano, N., et al. 2010,ApJ,713, 731
Lee, C.-F., Hirano, N., Zhang, Q., et al. 2015,ApJ,805, 186
Lee, C.-F., Ho, P. T. P., Hirano, N., et al. 2007,ApJ,659, 499
Lee, C.-F., Ho, P. T. P., Li, Z.-Y., et al. 2017a,NatAs, 1, 0152 Lee, C.-F., Hwang, H.-C., & Li, Z.-Y. 2016,ApJ,826, 213
Lee, C.-F., Li, Z.-Y., Ho, P. T. P., et al. 2017b,SciA, 3, e1602935 Lee, C.-F., Li, Z.-Y., Ho, P. T. P., et al. 2017c,ApJ,843, 27
Lee, C.-F., Mundy, L. G., Reipurth, B., Ostriker, E. C., & Stone, J. M. 2000,
ApJ,542, 925
Leurini, S., Codella, C., Cabrit, S., et al. 2016,A&A,595, L4
Matthews, L. D., Greenhill, L. J., Goddi, C., et al. 2010,ApJ,708, 80
Panoglou, D., Cabrit, S., Pineau Des Forêts, G., et al. 2012,A&A,538, A2
Pineau des Forêts, G., Roueff, E., Schilke, P., & Flower, D. R. 1993,MNRAS,
262, 915
Podio, L., Codella, C., Gueth, F., et al. 2015,A&A,581, A85
Podio, L., Lefloch, B., Ceccarelli, C., Codella, C., & Bachiller, R. 2014,A&A,
565, A64
Sakai, N., Oya, Y., Higuchi, A. E., et al. 2017, MNRAS,467, L76
Sakai, N., Oya, Y., López-Sepulcre, A., et al. 2016,MNRAS,820, L34
Sakai, N., Oya, Y., Sakai, T., et al. 2014a,ApJL,791, L38
Sakai, N., Sakai, T., Hirota, T., et al. 2014b,Natur,507, 78
Shu, F. H., Najita, J., Ostriker, E. C., & Shang, H. 1995,ApJL,455, L155
Shu, F. H., Ruden, S. P., Lada, C. J., & Lizano, S. 1991,ApJL,370, L31
Tabone, B., Cabrit, S., Bianchi, E., et al. 2017,A&A,607, L6
Tieftrunk, A., Pineau des Forêts, G., Schilke, P., & Walmsley, C. M. 1994, A&A,289, 579
van Dishoeck, E. F., & Blake, G. A. 1998,ARA&A,36, 317
Wakelam, V., Caselli, P., Ceccarelli, C., Herbst, E., & Castets, A. 2004,A&A,
422, 159
Wiseman, J., Wootten, A., Zinnecker, H., & McCaughrean, M. 2001,ApJL,
550, L87
Zinnecker, H., Bastien, P., Arcoragi, J.-P., & Yorke, H. W. 1992, A&A,