U
NIVERSITY OF
P
ISA
BIOS - Research Doctorate School in BIOmolecular Sciences
Ph.D. in BIOMATERIALS - XX Cycle
Environmentally Compatible Polymeric Blends and
Composites Based on Oxo-Biodegradable Polyethylene
Sílvia Maria Martelli
Supervisor: Prof./Dr. Emo Chiellini
Tutor: Dr. Elizabeth Grillo Fernandes
To my parents, my husband, and
To the most precious inspiration of my life:
Natália Manoela with great love.
ACKNOWLEDGEMENTS
While I was working on this Thesis in the last three years, I often imagined the moment I would get to this part: when the manuscript would be written, the final stress would be gone, when I finally would have a free weekend with my husband, my daughter and my little dog. I knew I would look back at this period of my life with pleasure, “saudade” and gratitude. Finally, this moment has come. The examiners will evaluate the results of this work, but I can certainly say that the process had been pleasant. So I am glad to complete it by remembering many wonderful people who have contributed to it in various ways.
My firsts thanks goes to God, for its constant presence in my life, for guiding my choices and for the comfort in the difficult moments.
Sincere thanks to my supervisor, Prof. Emo Chiellini, who gave me the opportunity to achieve this important objective. I also gratefully appreciated the help that Prof. Galli, Prof. Solaro, and Dr. D’Antone have given me in the moments of need.
I also thank the reading committee members who kindly agreed to read my manuscript and to participate in this discussion.
Special thanks to Maria Viola, Michela Bianchi and Maria Caccamo. Persons that help me in all situations!
Very special thanks to my tutor Dr. Elizabeth Grillo Fernandes (Beth); she had been so generous with her time. Her contribution to this Thesis is immeasurable. When I was starting my PhD I had an objective in my mind. Beth helped me to go far beyond my modest limits. For all the teachings, friendship, trust and patience I am truly grateful.
for the help that they gave me in the moments I needed. Great colleagues like Elisa (and Luca), Matteo (and Luisa), Sara, Ahmed, Federica, Cristiano, Luca Lotti, Veska!, Marcella, Antonella, Sangram, Mamoni, Marianna, Serena, Mahesh, Chiara, Andrea, Arianna, Patrizia, Lorenzo, Marina and all the others that are too long to list... I will remember you when returning home!
Finally, I am greatly indebted to my family. Deciding to do this PhD was not simple for me because I had to leave home for a long period of time. My family encouraged me in all moments providing emotional support without which I certainly would not be able to accomplish this work. A huge thanks to my parents, Vitório and Anair, to my brothers, Eriberto (and Geneci), Wilson (and Shirley), Sérgio (and Cinthya) and Iracy (and Joel) and to all my nephews and nieces. Finally, a truthful thanks to my husband Laerte, for allowing me the time and space to follow my dreams and ideas, for its love, support, advices and faith, for being father and mother in the lasts weeks, for everything…
INDEX
ACKNOWLEDGEMENTS
INDEX ... I
LIST OF ABBREVIATIONS ... V
LIST OF TABLES ... IX
LIST OF FIGURES ... XIII
ABSTRACT ... XIX
1. INTRODUCTION ... 1
1.1. WASTE DISPOSAL ISSUES AND LEGISLATIVE BACKGROUND ... 3
1.2. USE OF POLYETHYLENE IN PACKAGING ... 7
1.2.1. The importance of polyethylene in packaging ... 7
1.2.2. Disposal of polyethylene ...11
1.3. ENVIRONMENTALLY DEGRADABLE PLASTICS (EDP) ...12
1.3.1. General considerations ...12
1.3.2. Oxo-degradable polyolefins ...14
1.3.3. Degradation after the useful life-time ...22
OBJECTIVES ...29
2. EXPERIMENTAL ...33
2.1. REAGENTS AND SOLVENTS ...33
2.1.1. Materials used in biodegradation experiments ...34
2.2. ADDITIVES ...35
2.3. POLYMERS ...35
2.4. FORMULATION AND PROCESSING ...36
2.4.1. PE-PHB Blends...37
2.4.3. PE-TPS and PE-CS composites compatibilization... 41
2.4.4. PE-CS and PE-BTPS composites with prodegradant ... 44
2.5. THERMAL AGING AND BIODEGRADATION PROCEDURES ... 45
2.5.1. Thermal aging ... 45
2.5.1.1 Activation energy ... 46
2.5.1.2 Gel Content ... 47
2.6. BIODEGRADATION ... 47
2.6.1. Aerobic aquatic biodegradation ... 50
2.6.2. Soil Burial ... 53
2.7. CHARACTERIZATION ... 55
2.7.1. Melt Flow Index (MFI) ... 55
2.7.2. Thermogravimetric Analysis (TGA) ... 55
2.7.3. Differential Scanning Calorimetry (DSC) ... 56
2.7.4. Scanning Electron Microscopy (SEM) ... 57
2.7.5. Microanalysis (EDS) ... 57
2.7.6. Wide Angle X-ray Scattering (WAXS) ... 57
2.7.7. Size Exclusion Chromatography (SEC) ... 57
2.7.8. Transmission Fourier Transform Infrared Spectroscopy (FTIR) ... 58
2.7.9. Dynamic Mechanical Thermal Analysis (DMTA) ... 58
2.7.10. Gravimetric Analysis ... 58
2.7.11. Photoacoustic Fourier Transform Infrared Spectroscopy (PAS-FTIR) .... 59
2.7.12. Mechanical Tests ... 59
3. RESULTS ... 61
3.1. COMPATIBILIZATION OF POLY(ETHYLENE)-POLY(3-HYDROXYBUTYRATE)BASED BLENDS 61 3.1.1. Morphology ... 62
3.1.2. Thermal properties ... 69
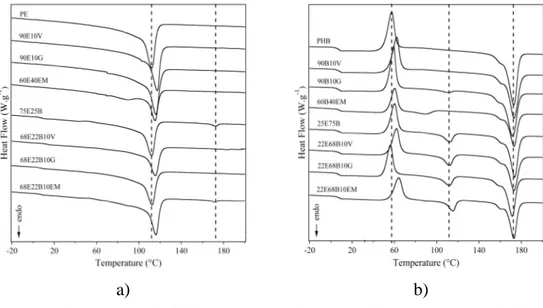
3.1.2.2 Differential scanning calorimetry (DSC) ... 78
3.1.2.3 Dynamic mechanical thermal analysis ... 90
3.1.3. Crystallinity of PE-PHB based blends by x-ray diffraction ...95
3.1.4. Infrared spectroscopy (FTIR) ...96
3.1.5. Mechanical properties ...98
3.2. PE-PHB-EGMA BLENDS ADDITIVATED WITH PRODEGRADANTS ...101
3.2.1. Characterization ...102
3.2.1.1 Morphology ... 102
3.2.1.2 Melt flow index (MFI) ... 104
3.2.1.3 Mechanical properties ... 106
3.2.1.4 Thermogravimetry (TGA) ... 108
3.2.1.5 Differential scanning calorimetry (DSC) ... 111
3.2.2. Thermal-oxidation of PE-PHB-prodegradat blends ...114
3.2.2.1 FTIR analysis of thermo-oxidized blends ... 116
3.2.2.2 Characterization of PE-PHB-prodegradant blends thermo-aged at 55 °C ... 126
Carbonyl index (COi) ... 126
Weight gain ... 127 Acetone extraction ... 128 Gel content ... 132 Thermal properties ... 133 Mechanical properties ... 141 3.2.3. Biodegradation ...147 3.2.3.1 CHN analysis ... 149
3.2.3.2 Aerobic aquatic biodegradation ... 149
Morphology ... 150
Microanalysis (EDS) ... 153
Carbon Dioxide Evolved ... 157
Thermogravimetry Analysis (TGA) ... 161
3.2.3.3 Soil burial biodegradation ... 167
Morphology ... 168
Carbon Dioxide Evolved ... 169
Thermogravimetric Analysis (TGA) ... 171
Differential Scanning Calorimetry ... 175
Transmission Fourier Transform Infrared Spectroscopy (FTIR) ... 178
3.3. PE-STARCH BASED COMPOSITES ... 180
3.3.1. Compatibilization of PE and starch ... 182
3.3.1.1 Morphology ... 182
3.3.1.2 Mechanical properties ... 187
3.3.2. PE-CS and PE-BTPS composites with prodegradant ... 191
3.3.2.1 Melt flow index (MFI) ... 192
3.3.2.2 Thermogravimetry (TGA) ... 193
3.3.2.3 Mechanical properties ... 194
3.3.2.4 Oxidation of PE-Starch based composites ... 196
CONCLUSIONS ... 203
Compatibilization of Poly(ethylene)-Poly(3-hydroxybutyrate) Based Blends ... 203
PE-PHB-EGMA blends formulated with prodegradants ... 205
PE-Starch based composites ... 208
LIST OF ABBREVIATIONS
AM: Aquatic Medium
AN: Aniline
ANOVA: Analysis of Variance CCD: Central Composite Design COD: Chemical Oxygen Demand COi: Carbonyl Index
CS: Amount of carbon in the sample
CS: Corn-Starch C22: Docosane C16: Hexadecane
DEX: Statistical Design Experiment
DMTA: Dynamic Mechanical Thermal Analysis DO: Dissolved Oxygen
DS: Inoculum derived from activate sludge, sewage effluents, surface water, soil or a mixture of them
DSC: Differential Scanning Calorimetry Dt: Mineralization
DTGA: Derivative Thermogravimetric Analysis E: Elastic Modulus
E’: Storage Modulus E’’: Loss Modulus Ea: Activation Energy
EAA: Poly(ethylene-co-acrylic acid) EC: European Community
EEA: European Environmental Agency EDP: Environmentally Degradable Plastics
EDS: Energy Dispersive X-ray Microanalysis Spectroscopy EGMA: Poly(ethylene-co-glycidyl methacrylate)
EMAC: Poly(ethylene-co-methyl acrylate) EPI: Environmental Technologies Inc. EU: European Union
EVA: Poly(ethylene-co-vinyl acetate) EVOH: Ethylene-vinyl alcohol copolymer FDA: Food and Drug Administration
GL: Glucose
FTIR: Fourier Transform Infrared Spectroscopy GMA: Glycidyl Methacrylate
HDPE: High-density polyethylene Hm: Melting Enthalpy
HPLC: High Pressure Liquid Chromatography ID: Molecular Weight Distribution
IMSM: Inoculum Mineral Salt Medium
IMSM16: Inoculum Mineral Salt Medium Containing Hexadecane IMSM22: Inoculum Mineral Salt Medium Containing Docosane IRU: Inoculum
k: Rate Constant
KE: Acetone Extractable Fraction LDPE: Low-density polyethylene LLDPE: Linear low-density polyethylene MA: Methyl Acrylate
MBAS: Methylene Blue Active Substances MFI: Melt Flow Index
Mn: Number-Average Molecular Weight MO: Microorganism
MSM: Mineral Salt Medium
MW: Weight-Average Molecular Weight NA: Ammonia Nitrogen
PAS-FTIR: Photoacoustic Fourier Transform Infrared Spectroscopy PE: Polyethylene
PER: Perlite
PET: Poly(ethylene terephthalate) PHA: Poly(hydroxyalkanoates) PHB: Poly(3-hydroxybutyrate)
PHBV: Poly(3-hydroxybutyrate-co-valerate) PP: Polypropylene
PS: Pristine Sample PT: Total phosphate PVC: Polyvinyl chloride PVdC: Poly(vinylidene chloride)
PWC: Pure Whatman Cellulose Filter Paper
Re: Residue
ROOi: Hydroperoxide Index
SB: Strain at Break SBi: Soil Burial
SBP: Strain at Break in the Parallel Direction of Blow
SBT: Strain at Break in the Transverse Direction of Blow
SBo: Sodium Benzoate
SBS: Styrene-butadiene copolymer SEC: Size Exclusion Chromatography SEM: Scanning Electron Microscopy Sm: Melting Entropy
SS: Sodium Stearate ST: Tensile Stress at Break
STP: Strain at Stress in the Parallel Direction of Blow
STT: Strain at Stress in the Transverse Direction of Blow
Tan δ: Damping Factor
TAS: Thermally Aged Sample Tc: Crystallization Temperature
Tcc: Cold Crystallization Temperature
Td: Decomposition Temperature
TDPA®: Totally Degradable Plastics Additives Tg: Glass Transition Temperature
TGA: Thermogravimetric Analysis ThCO2: Theoretical Amount of CO2
TIT: Titrymetry
TNI: Total Nitrogen Input Tm: Melting Temperature
TOC: Total Organic Carbon
TPS: Thermoplastic Corn-starch
T6: TDPA® DCP562
T7: TDPA® DCP571
US: United States UV: Ultraviolet VA: Vinyl Acetate VF: Flask Volume
VS: Flask Containing MSM
WAXS: Wide Angle x-ray Scattering WG: Weight Gain
WS: Total Sample Amount
WSP: Soil:Perlite (2:1) Xc: Crystallinity Degree
YM: Young Modulus
YMP: Young Modulus in the Parallel Direction of Blow
LIST OF TABLES
Table 1.1. Recovery and Recycling Targets to be attained up to 31
December 2008. ... 5
Table 1.2. Calorific values of plastics compared with conventional fuels[11]. ... 6
Table 1.3. Typical PEs properties.a) ... 7
Table 1.4. Advantages and disadvantages of polyethylenes. ... 8
Table 2.1. Characteristics of river “Morto” at 26 September 2003.a)[80] ... 34
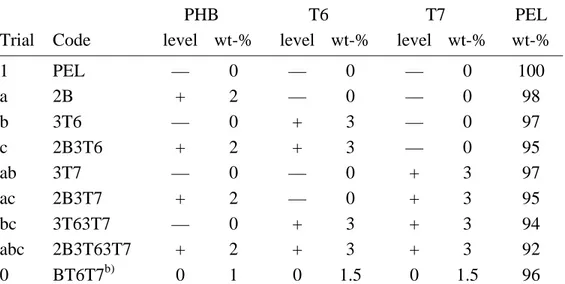
Table 2.2. Composition and sample identification codes of PE-PHB-EVA blends. ... 38
Table 2.3. Composition and sample identification codes of PE-PHB-EGMA blends. ... 39
Table 2.4. Composition and sample identification codes of PE-PHB-EMAC blends. ... 39
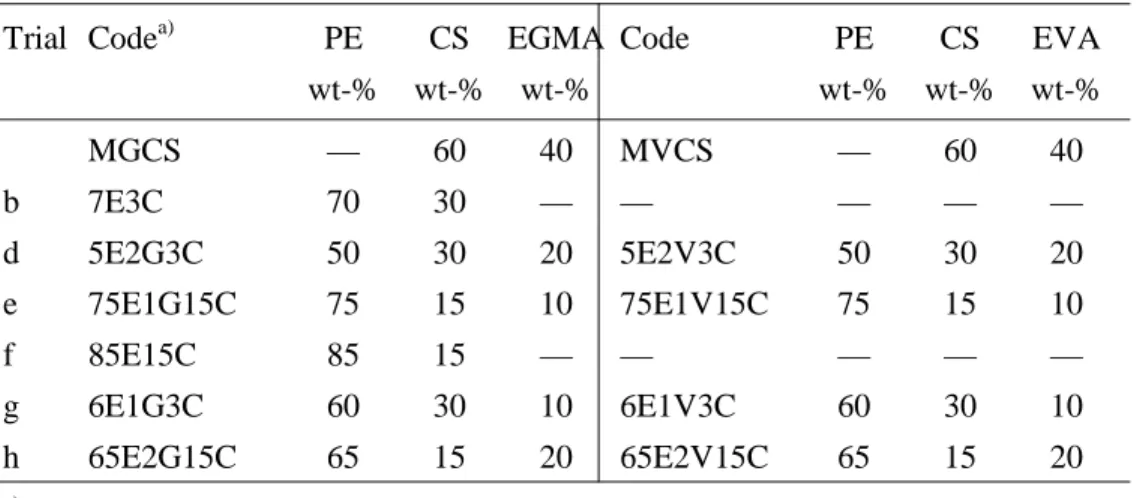
Table 2.5. Central composite design for PE-PHB blends formulated with prodegradant. ... 40
Table 2.6. Composition and sample identification codes of PE-PHB based blends.a) ... 41
Table 2.7. Factorial 22 design.a) ... 42
Table 2.8. Composition and sample identification codes of PE-TPS blends. ... 43
Table 2.9. Composition and sample identification codes of PE-CS blends. ... 43
Table 2.10. Composition and sample identification codes of PE-corn starch and PE-Biopar extruded blends. ... 44
Table 2.11. Samples in the aquatic medium (AM) and soil burial (SBi) biodegradation tests in. a) ... 48
Table 2.12. Characterization of samples submitted to biodegradation tests. a) ... 48
Table 2.13. Characteristics of standard methods for aerobic biodegradation in aquatic medium and that used in the present study. ... 51
Table 2.14. Composition of the mineral salt medium (MSM) used in the aquatic aerobic biodegradation experiments. ... 53
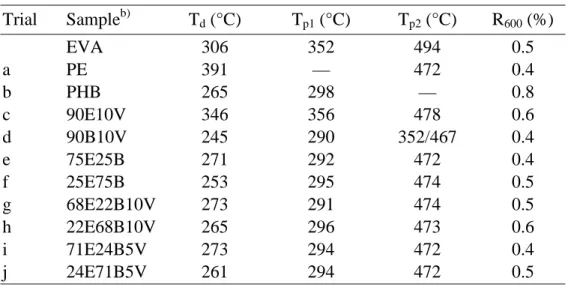
Table 3.1. TGA data of PE-PHB blends compatibilized with EVA.a) ... 70
Table 3.2. TGA data of PE-PHB blends compatibilized with EGMA.a) ... 71
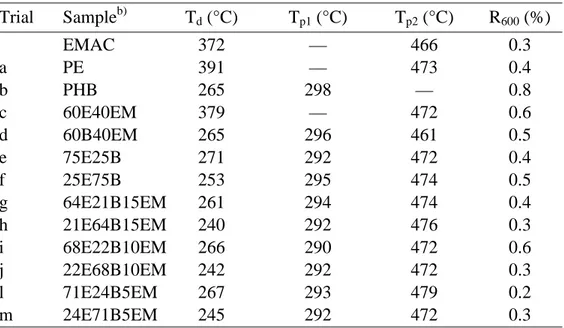
Table 3.3. TGA data of PE-PHB blends compatibilized with EMAC.a ... 72
Table 3.4. Thermodynamic parameters (1st heating scan) of PE-PHB blends compatibilized with EVA. ... 79
Table 3.5. Thermodynamic parameters (1st heating scan) of PE-PHB blends compatibilized with EGMA. ... 80
Table 3.6. Thermodynamic parameters (1st heating scan) of PE-PHB blends compatibilized with EMAC. ... 81
Table 3.7. Thermodynamic parameters (2nd heating scan) of PE-PHB blends compatibilized with EVA.a) ... 84
Table 3.8. Thermodynamic parameters (2nd heating scan) of PE-PHB blends compatibilized with EGMA. a) ... 85
Table 3.9. Thermodynamic parameters (2nd heating scan) of PE-PHB blends compatibilized with EMAC. a) ... 86
Table 3.10. Thermodynamic parameters (3rd heating scan) of PE-PHB blends compatibilized with EVA.a) ... 88
Table 3.11. Thermodynamic parameters (3rd heating scan) of PE-PHB blends compatibilized with EGMA.a)... 88
Table 3.12. Thermodynamic parameters (3rd heating scan) of PE-PHB blends compatibilized with EMAC.a) ... 89
Table 3.13. DMTA data of PE-PHB blends compatibilized with EVA.a) ... 92
Table 3.14. DMTA data of PE-PHB blends compatibilized with EGMA.a) ... 93
Table 3.15. DMTA data of PE-PHB blends compatibilized with EMAC.a) ... 94
Table 3.16. Assignments of FT-IR absorptions peaks for PE and PHB. ... 97
Table 3.17. Mechanical properties of PE-EVA-PHB blends. a) ... 99
Table 3.18. Mechanical properties of PE-EGMA-PHB blends. a) ... 100
Table 3.19. Mechanical properties of PE-EMAC-PHB blends. a) ... 100
Table 3.20. MFI of PE-PHB based blends as a function of composition. ... 105
Table 3.21. Mechanical Properties of PE-PHB based blend films.a)... 107
Table 3.22. TGA data of PE-PHB-prodegadant blends as a function of composition.a) ... 110
Table 3.24. Thermodynamic parameters from 1st cooling scan of blends.a) ... 113
Table 3.25. Rate constants (k) and activation energy (Ea) of samples obtained from Arrhenius equation. ... 125
Table 3.26. Mn of acetone extracted chemicals from PE-PHB-prodegradant
blends aged at 55 °C a). ... 131
Table 3.27. Gel content (wt-%) of PE-PHB-prodegradant based blends aged at 55°C for 0, 35 and 60 days. ... 133
Table 3.28. Decomposition temperature (Td in °C) of aged PE based
blends.a) ... 136
Table 3.29. Tp (°C) of PE weight loss from aged PE-PHB based blends. ... 136
Table 3.30. Weight loss (wt-%) of PE degradation step from aged PE-PHB based blends. ... 137
Table 3.31. Residue (wt-%) at 800°C from aged PE based blends. ... 137
Table 3.32. DSC 1st heating scan Tm (°C) from aged PE based blends... 138
Table 3.33. Degree of crystallinity (%) from 2st heating scan of aged PE based blends. ... 141
Table 3.34. Thickness (mm) of PE-PHB based blends thermal-aged at 55 °C for 60 days.a) ... 142
Table 3.35. Samples used in biodegradation experiments in aquatic medium (AM) and soil burial (SBi). ... 148
Table 3.36. Elemental analysis of PE-PHB based blends ... 149
Table 3.37. Elemental microanalysis of T6, T7 prodegradants and PE-PHB based blends. ... 155
Table 3.38. TGA data of PE-PHB blends before and after 125 days of aquatic biodegradation.a) ... 162
Table 3.39. Thermodynamic parameters (1st heating scan) of PE-PHB blends at the beginning and after 125 days in aquatic biodegradation.a) ... 166
Table 3.40. Thermodynamic parameters (2nd heating scan) of PE-PHB blends at the beginning and after 125 days in aquatic biodegradation.a) ... 167
Table 3.41. TGA data of PE-PHB blends up to 6 months soil burial biodegradation a) ... 171
Table 3.42. PHB weight loss step (∆M %) data in PE-PHB blends soil
burial biodegraded in the period of 6 months ... 173
Table 3.43. PE crystallinity degree (XcPE %) as a function of biodegradation time (1st heating scan).a) ... 176
Table 3.44. PE crystallization temperature (Tc °C) in PE-PHB blends as a function of biodegradation time (1st cooling scan).a) ... 177
Table 3.45. Thermodynamic parameters of PE in PE-PHB blends as a function of biodegradation time (2nd heating scan).a ... 178
Table 3.46. Codes used in the graphic representation of YM.a) ... 187
Table 3.47. Mechanical properties of PE-TPS-EGMA materials.a) ... 188
Table 3.48. Mechanical properties of PE-TPS-EVA materials.a) ... 189
Table 3.49. Mechanical properties of PE-CS-EGMA materials a) ... 190
Table 3.50. Mechanical properties of PE-CS-EVA materials a) ... 190
Table 3.51. Melt flow index of PE-CS and PE-Biopar materials additivated with prodegradant a) ... 192
Table 3.52. Mechanical properties of PE-CS-prodegradant materials a) ... 195
Table 3.53. Mechanical properties of PE-Biopar-prodegradante materialsa) ... 195
Table 3.54. TGA data of PE-CS-prodegradant composite aged at 55°C for 60 days.a) ... 200
Table 3.55. TGA data of PE-Biopar-prodegradant composite aged at 55°C for 60 days.a) ... 200
LIST OF FIGURES
Figure 1.1. Plastic shares in the packaging market. ... 2
Figure 1.2. Relationship between demand and capacity of PE. ... 2
Figure 1.3. Demand as a function of consumption purpose of PE. ... 3
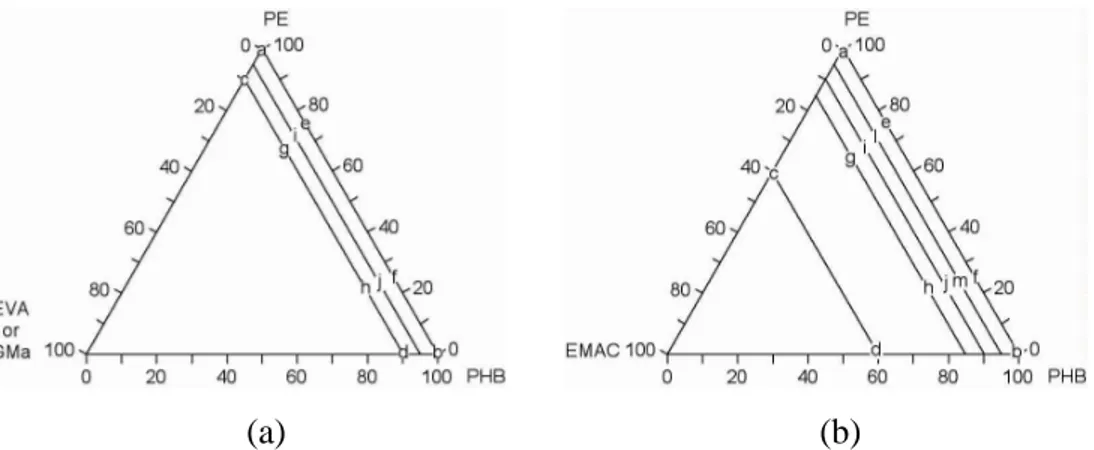
Figure 2.1. Space of the components in the mixture for (a) PE-PHB-EVA (or EGMA) and (b) PE-PHB-EMAC blends. ... 37
Figure 2.2. Factorial 22 with mixture experiment at each level (a) and Space of the mixture experiment (b). ... 42
Figure 2.3. Supports used on aging test: a) for FTIR analysis, and b) Petri dish, Ø = 10 cm. ... 46
Figure 2.4. Flow-sheet of aquatic biodegradation. ... 50
Figure 2.5. Biometer used on aquatic biodegradation. ... 52
Figure 2.6. Biometer used in soil burial experiments. ... 54
Figure 3.1. SEM micrographs of PE-PHB binary blends. a) 75E25B–500X; b) 75E25B–2000X; c) 25E75B–500X; d) 25E75B–2000X. ... 63
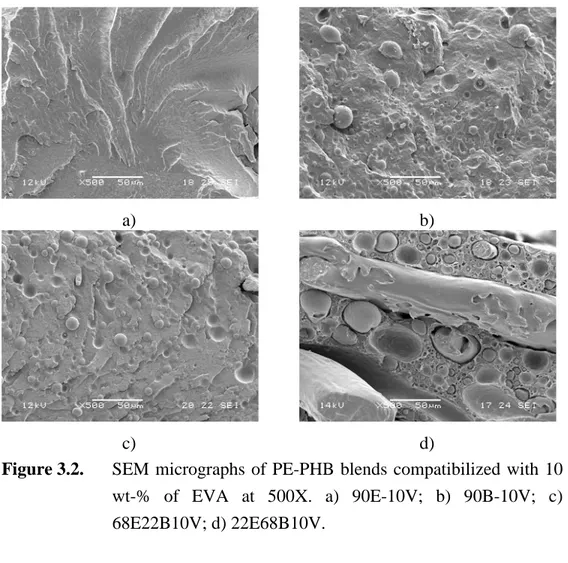
Figure 3.2. SEM micrographs of PE-PHB blends compatibilized with 10 wt-% of EVA at 500X. a) 90E-10V; b) 90B-10V; c) 68E22B10V; d) 22E68B10V. ... 65
Figure 3.3. SEM micrographs of PE-PHB blends compatibilized with 10 wt-% of EGMA at 500X. a) 90E10G; b) 90B10G; c) 68E22B10G; d) 22E68B10G. ... 66
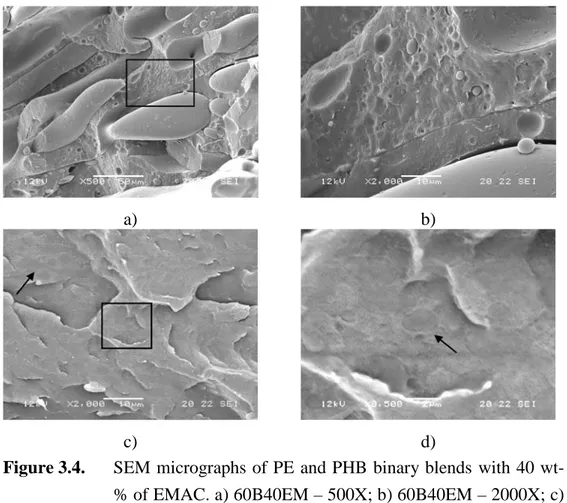
Figure 3.4. SEM micrographs of PE and PHB binary blends with 40 wt-% of EMAC. a) 60B40EM – 500X; b) 60B40EM – 2000X; c) 60E40EM – 2000X; d) 60E40EM – 8500X. ... 68
Figure 3.5. SEM micrographs of PE-PHB blends compatibilized with 15 wt-% EMAC at 500X. a) 64E21B15EM; b) 21E64B15EM. ... 68
Figure 3.6. Thermal stability of PE-PHB based blends as a function of composition and type of compatibilizer. a) PE matrix; and, b) PHB matrix. ... 73
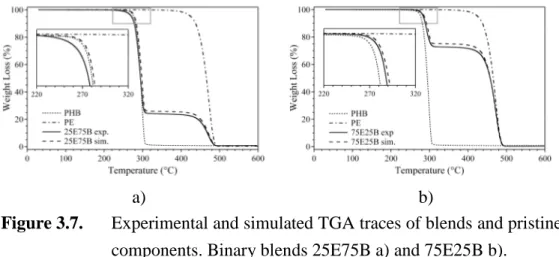
Figure 3.7. Experimental and simulated TGA traces of blends and pristine
components. Binary blends 25E75B a) and 75E25B b). ... 76
Figure 3.8. Experimental and simulated TGA traces of blends and pristine components. Ternary blends with EGMA, 22E68B10G a) and 68E22B10G b); with EVA, 22E68B10V c) and 68E22B10V d); and with EMAC, 22E68B10EM e) and 68E22B10EM f)... 77
Figure 3.9. DSC traces of pristine blend matrices as a function of thermal treatments. a) PE; and b) PHB. ... 78
Figure 3.10. Degree of crystallinity of PE in the PE-PHB based blends as a function of composition and type of compatibilizer taken from the 1st heating scan. ... 82
Figure 3.11. Degree of crystallinity of PHB in the PE-PHB based blends as a function of composition and type of compatibilizer taken from the 1st heating scan. ... 83
Figure 3.12. Typical DSC traces from the second heating scan of PE-PHB based blends. a) PE matrix; and b) PHB matrix. ... 83
Figure 3.13. Glass transition temperature of PHB in PE-PHB blends compatibilized with EVA, EGMA and EMAC (2nd heating scan). a) PE matrix; and b) PHB matrix... 87
Figure 3.14. DMTA tensile storage modulus and tan δ at 1 Hz for pristine PE (a) and (b) PHB. ... 91
Figure 3.15. WAXS diffraction patterns of pristine blend components a) and their binary formulations b). ... 95
Figure 3.16. WAXS diffraction patterns of binary and ternary blends. ... 96
Figure 3.17. FTIR spectra of (a) PE and (b) PHB. ... 97
Figure 3.18. FTIR spectra of binary and ternary PE-PHB based blends. ... 98
Figure 3.19. SEM of cryogenic fracture of a) PEL and b) 2B at 1000X. See Table 2.6 for sample code nomenclature. ... 103
Figure 3.20. SEM of cryogenic fracture of a) 2B3T63T7 and b) BT6T7 at 1000X. ... 103
Figure 3.21. SEM of cryogenic fracture of a) 3T6 and b) 2B3T6 at 1000X. ... 103
Figure 3.22. SEM of cryogenic fracture a) 3T7 at 500X; b) 2B3T7 at 1000X. .. 104
Figure 3.23. SEM of cryogenic fracture of a) 3T63T7 at 100X; b) 3T63T7 at 500X... 104
Figure 3.24. DEX interaction plot of the factors PHB, T6 and T7 on MFI of PE based blends. ... 105
Figure 3.25. SEM of fractured surfaces from tensile test of PE-PHB films in the transverse direction to the blow at 1500X of magnification. a) PEL; b) 2B; c) 3T6; and d) 2B3T6. ... 108
Figure 3.26. TGA (a) and DTGA (b) traces of the prodegradants additives. ... 109
Figure 3.27. DSC traces of (a) 1st heating scan and (b) 1st cooling scan of PE-PHB-prodegradant blends. ... 112
Figure 3.28. FTIR-spectra of 3T7 blend after 0, 35 and 60 days of thermal degradation at 55 °C. ... 117
Figure 3.29. FTIR bands in the range of 1900-1550cm-1 from aged a) 3T6 and b) 2B3T6. ... 119
Figure 3.30. FTIR bands in the range of 1900-1550cm-1 from aged 2B3T7 films. ... 120
Figure 3.31. ROOi and COi as a function of time from aging at 45 °C, 55 °C
and 65 °C of blends 3T6 (a, b) and 2B3T6 (c, d). ... 122
Figure 3.32. ROOi and COi index as a function of aging time at 45 °C, 55 °C
and 65 °C of blends 3T7 (a, b) and 2B3T7 (c, d). ... 123
Figure 3.33. ROOi and COi index as a function of aging time at 45 °C, 55 °C
and 65 °C of blends 3T63T7 (a, b), 2B3T63T7 (c, d) and BT6T7 (e, f). ... 124
Figure 3.34. Carbonyl index as a function of aging time at 55 °C of PE-PHB-prodegradant films. ... 127
Figure 3.35. Weight changes of PE-PHB-prodegradant blend films by the oxygen uptake during oxidation process at 55°C. ... 128
Figure 3.36. Acetone extractable fractions (KE) and residual mass (RM) from samples thermo-oxidized at 55°C for 60 days. ... 129
Figure 3.37. GPC traces of PE-PHB-prodegradant blends from thermo-degradation during 45 days and 60 days at 55 °C. ... 130
Figure 3.38. GPC traces of 3T63T7 blend from thermo-degradation during a) 45 days and b) 60 days at 55 °C. ... 131
Figure 3.39. TGA traces of PE-PHB-prodegradant blends thermal aged at 55 °C up to 60 days. ... 134
Figure 3.40. TGA and DTGA traces of 2B3T63T7 blend aged at 55 °C for 60 days. ... 135
Figure 3.41. DSC traces of the 1st heating scan of PE-PHB blends aged at 55 °C up to 60 days. ... 139
Figure 3.42. Degree of crystallinity calculated from the 1st heating scan of aged PE based blends. ... 140
Figure 3.43. Young’s modulus of aged PE-PHB based blends for 60 days at 55 °C. ... 143
Figure 3.44. Stress at break (ST) of aged PE-PHB based blends for 60 days at 55 °C. ... 144
Figure 3.45. Strain at break (SB) of aged PE-PHB based blends for 60 days at 55 °C. ... 145
Figure 3.46. SEM of PE-PHB blend surfaces: a) PEL pristine – 3000X; b) PEL125d – 3000X; c) PELt – 3000X; d) PELt –125d – 5000X. .... 150
Figure 3.47. SEM of PE-PHB blend surfaces: a) 2B pristine – 3000X; b) 2B-125d – 3000X; c) 2Bt– 3000X; d) 2Bt–2B-125d – 5000X. ... 152
Figure 3.48. SEM of PE-PHB blend surfaces: a) 3T6 pristine – 3000X; b) 3T6-125d – 3000X; c) 3T6t– 3000X; d) 3T6t–125d – 5000X... 152
Figure 3.49. SEM of PE-PHB blend surfaces: a) 2B3T6 pristine – 3000X; b) 2B3T6-125d – 3000X; c) 2B3T6t– 3000X; d) 2B3T6t–125d – 5000X. ... 153
Figure 3.50. Back scattering image of pristine T6 additive (a) and composition (b). ... 154
Figure 3.51. Back scatteting image of pure T7 additive (a) composition (b). ... 154
Figure 3.52. Back scattering image of 3T6 before biodegradation (a) and composition (b). ... 155
Figure 3.53. Back scattering image of 3T6 after 125 days of biodegradation (a) and composition (b). ... 156
Figure 3.54. Back scattering image of 2B3T6 before biodegradation (a) and composition (b). ... 156
Figure 3.55. Back scattering image of 2B3T6 after 125 days of biodegradation (a) and composition (b). ... 156
Figure 3.56. Mineralization behaviour of docosane during 125 days in aquatic aerobic biodegradation experiments. ... 157
Figure 3.57. Mineralization behaviour of PE-PHB based blends during 125 days in aquatic aerobic biodegradation experiments: (a) PEL, and (b) 2B. ... 158
Figure 3.58. Mineralization behaviour of PE-PHB based blends during 125 days in aquatic aerobic biodegradation experiments: (a) 3T6, (b) 2B 3T6, (c) 3T7 and (d) 2B3T7. ... 160
Figure 3.59. Typical TGA traces of PE based blends before and after aquatic aerobic biodegradation: (a) 3T6 and (b) 2B3T6. ... 163
Figure 3.60. DTGA traces of PE based blends: (a) PEL, (b) 2B, (c) 3T6 and (d) 2B3T6 at the beginning after 125 days of aquatic biodegradation. ... 164
Figure 3.61. Typical DSC traces (1st heating scan) of PE blends: (a) PEL (b) 2B, (c) 3T6 and (d) 2B3T6. ... 165
Figure 3.62. SEM of PE-PHB blends surface at magnification of 3000X: a) 3T6 initial; b) 3T6-6m; c) 2B3T6 initial; d) 2B3T6–6m; e) 3T7-6m; f) 2B3T7–6m. ... 168
Figure 3.63. Mineralization behaviour of PWC up to 6 months of soil burial experiments. ... 170
Figure 3.64. Mineralization behaviour of PE-PHB blends, with and without a previous thermal aging, during soil burial experiments: (a) 3T6, (b) 2B3T6, (c) 3T7, and (d) 2B3T7. ... 170
Figure 3.65. TGA (a,c) and DTGA (b,d) traces of PE based blends during soil burial experiments: (a,b) 3T6 and (c,d) 3T6t. ... 172
Figure 3.66. DTGA traces of PE based blends as a function of soil burial time: (a) 2B3T6, (b) 2B3T6t, (c) 3T7, (d) 3T7t , (e) 2B3T7 and (f) 2B3T7t. ... 174
Figure 3.67. DSC traces (1st heating scan) of biodegraded PE based blends: (a) 3T6 (b) 3T6t, (c) 2B3T6 and (d)2B3T6t. ... 175
Figure 3.68. DSC traces (1st cooling scan) of biodegraded PE blends: (a) 3T6 (b) 3T6t, (c) 2B3T6 and (d)2B3T6t. ... 177
Figure 3.69. FTIR spectra of PE-PHB samples as a function of soil incubation time. ... 179
Figure 3.71. SEM of PE-Starch materials: a) 5E2G3T-200X; b) 5E2V3T-170X; c) 5E2G3T-500X; d) 5E2V3T-1000X. ... 184
Figure 3.72. SEM of PE-Starch materials: a) 75E1V15T-80X; b) 1000X; c) 2000X; d) 75E1V15T-5000X. ... 184
Figure 3.73. SEM of PE-Starch materials: a) 65E2G15T-100X; b) 65E2V15T-120X; c) 65E2G15T-500X; d) 65E2V15T-500X. ... 185
Figure 3.74. SEM of PE-Starch materials: a) 65E2G15C-500X; b) 65E2V15C-500X; c) 65E2G15C-2000X; d) 65E2V15C-2000X. .. 185
Figure 3.75. SEM of PE-Starch materials: a) 5E2G3C-500X; b) 5E2V3C-500X; c) 5E2G3C-2000X; d) 5E2V3C-2000X. ... 186
Figure 3.76. Young modulus of four families of PE-Starch based composites containing TPS or CS combined with EVA or EGMA as compatibilizers. ... 191
Figure 3.77. Changes in the MFI of ET6 samples containing CS and Biopar. ... 193
Figure 3.78. TGA traces of a) PE-CS-prodegradant and b) PE-Biopar-prodegradant materials. ... 194
Figure 3.79. Variation in the Young modulus of PE-starch based composites. ... 196
Figure 3.80. Variation in the a) Tensile stress at break and b) Strain at break of PE-starch based composites. ... 196
Figure 3.81. Weight variation of PE-T6 samples submitted to a aging process at 55°C for 60 days. ... 197
Figure 3.82. Weight variation of samples submitted to an aging process at 55°C for 60 days. ... 198
Figure 3.83. KE and RM of samples aged at 55 °C for 57 days: (a,c) PE-CS-prodegradant; and .(b,d) PE-Biopar-prodegradant. ... 199
ABSTRACT
The study of this thesis was focused on materials based on polyethylene (PE), which remains as the largest polymer used in the field of packaging. This polymer is not biodegradable and its waste represents a serious problem to the environment. A proposal of eco-compatible PE based materials will be presented. This is bound to the enhancement of the polyethylene oxo-biodegradability through the blending with biodegradable polymers of biosynthetic origin, [poly(hydroxybutyrate) (PHB) or starch] and commercial prodegradant additives.
This work was structured in three chapters. In the first chapter, the compatibilization between PE and PHB was studied. For this purpose, a screening statistical design experiment (DEX) was preformed, in order to assist in the selection of the better compatibilizer and materials proportions. The variables selected were three copolymers, containing both PE and polar segments, and their amount in the blend, which was constrained at the limits of 10 wt-% and 40 wt-% depending on the compatibilizer. These compatibilizers were co-vinyl acetate) (EVA),
poly(ethylene-co-glycidyl methacrylate) (EGMA) and poly(ethylene-co-methyl acrylate
(EMAC). The films were characterized by means of thermal analysis (TGA and DSC), scanning electron microscopy (SEM), wide angle x-ray scattering (WAXS), Photoacoustic Fourier Transform Infrared Spectroscopy (PAS-FTIR), dynamic mechanical thermal analysis (DMTA) and tensile tests (Instron). EGMA was chosen as the compatibilizer to formulate a new series of materials. This compatibilizer promoted the better adhesion between PE and PHB than the others two tested copolymers did. The best formulation was found for PE matrix with 10 wt-% of EGMA (68E22B10G).
In the second chapter, PE-PHB-EGMA blends were formulated in presence or not of prodegradant additives (Totally Degradable Plastics Additives - TDPA®) DCP562 (T6) and DCP571 (T7). The formulation strategy followed a central composite design (CCD) where the independent variables were the amount of the biodegradable polymer PHB and of the prodegradant additives T6 and T7. Films were characterized by means of
SEM, TGA, DSC, FTIR and Instron. This family of materials was submitted to a thermal aging experiment at three temperatures (45, 55 and 65 °C). Gravimetry, FTIR, SEC, TGA, DSC and Instron were carried out to characterize the thermal aged samples. The prodegradants were effective in promoting PE oxidation. Thermal aged PE-PHB-EGMA-TDPA blends samples showed significant changes on weight gain and carbonyl index (COi) measured in FTIR spectra. By means of COi were evaluated the activation energy (Ea) of thermal degradation applying the Arrhenius equation. Blends containing PHB presented lower values of activation energy (54 kJ/mol for 2B3T6) compared to the equivalent blend without PHB (81 kJ/mol for 3T6). Samples from thermal aging were biodegraded in both aquatic media and soil burial. The biodegradation of the blends in both ambient showed low mineralization. For example, the maximum mineralization of 2B3T6t (85.5PE-9.5EGMA-2PHB-3T6) sample was ca. 4 % after 140 days in soil burial, probably as a consequence of the large extent of crosslinking occurred during the thermal aging, which in this case increased up to 76 %.
The last chapter of this thesis comprises two series of experiment concerning PE-Starch composites. In the first one, the compatibilization of compression moulded PE-Starch materials was studied. In the second part, selected composites of compatibilized PE-Starch were prepared by melt blow extrusion. Two different types of starches and two compatibilizers were defined as variables: thermoplastic corn-starch (TPS) and natural corn starch (CS) as fillers and EVA and EGMA as compatibilizers. The results obtained showed that: i) PE-TPS films resulted in very distinct phase separation even when higher amounts of EVA and EGMA were used; ii) In the PE-CS films the compatibilizer EGMA at 20 wt-% provided a good dispersion of starch granules. In addition, blends containing CS produced films more homogeneous than that with TPS. The best compatibilized formulation was used to prepare by melt blow extrusion CS based composites and PE-Biopar blends containing or not T6 and T7 prodegradants, whose films were mechanically tested. The mechanical properties of PE family of materials containing CS and Biopar presented similar values for Young modulus (100-200 MPa). However, films with Biopar presented higher values of tensile strain (ca. 200 %) than films with CS (ca. 100%).
1. INTRODUCTION
It is projected a growth of about fifty percent in the global population over the next fifty years. This will put a significant pressure on the environment issue. In accordance with studies of European Environmental Agency (EEA)[1] the population of the developing countries will achieve levels of material wealth similar to today's levels in industrialised countries. Naturally, world consumption of resources would increase by a factor ranging from two to five and a huge growing volume of municipal and industrial wastes will have to be handled.
Waste consists of a mix of very different materials. Each material has its own characteristics, environmental impact, recycle and re-use options. The inevitable waste resulting from plastic goods and packaging are found all over the world. Plastics are relatively cheap, durable and versatile materials. However, when is transformed in waste it constitutes a sizeable percentage of the litter. Besides, many of the plastics are also non-biodegradable or are difficult to re-use and/or recycle, which may represent risks to human health and to the environment.
Figure 1.1 gives a panoramic view of the most frequently polymers used in the packaging market. Polyolefin family is of great importance in this market with more than 60% of the total plastic weight. In this context, packaging represents one of the most important topics in the waste management. For example, it represents roughly one-third of municipal waste in the industrialized countries as United States[2]. Naturally, this representation depends of several factors as for example country, culture and so on. Any way, polyolefin is a material family that justifies any activity in innovation[3].
In 2007, the global consumer packaging market was estimated to be around US $410 billion with a growth projection of about 5% per annum that can arrive over US $470 billion in 2010. The more representative markets are North of America and Europe that absorb 29% and 33 % of this market, respectively. Food and beverage packaging are the two largest segments, accounting for more than two-thirds of the total[4].
In relation to the production of de most common polyolefin, it can be said that at the present both polyethylene (PE) and polypropylene (PP) dominate the demand for global thermoplastics, which represent over 60% of all commodity resins consumed on an annual basis. This means that they represent a large portion of the global thermoplastic business and consequently waste. Figure 1.2 shows the relationship between demand and capacity with a projection up to 2009 that anticipate a production of about 90 million of tons for PE[5, 6].
Figure 1.1. Plastic shares in the packaging market.
Introduction
PE is the plastic most well known to the consumer and is used in greater volume worldwide than any other plastic. Future annual demand growth for PE plastics in Western Europe is predicted to be about 6% (Fig. 1.2), with the major application continuing to be packaging. This versatile polymer is used in a variety of areas from packaging to agriculture, building to electronics as illustrated in Figure 1.3. Packaging is the major application for PE. The second most important one is wholesale.
Figure 1.3. Demand as a function of consumption purpose of PE.
The continuous growth of polymer materials for food packaging applications in conjunction with their recalcitrance toward degradation and their visibility in the environment when discarded have stimulated further research in the field of food packaging. It has been estimated that 2% of all plastics eventually reach the environment, thus contributing considerably to a currently acute ecological problem[7].
1.1. Waste disposal issues and legislative background
The greatest environmental pressure for the packaging chain comes from legislation. According to the European Environmental Agency[1], packaging waste is the major and growing waste stream. Its amounts have
increased in most European countries despite the agreed objective of waste prevention. The projections show that packaging waste amounts will arrive at 77 million tonnes in 2008.
A well-known example at European level is the EC Directive on Packaging and Packaging Wastes. This directive stipulate that “packaging shall mean all products made of any materials of any nature to be used for the containment, protection, handling, delivery and presentation of goods, from raw materials to processed goods, from the producer to the user or the consumer. Non-returnable items used for the same purposes shall also be considered to constitute packaging”[8]. “Packaging waste shall mean any packaging material covered by the definition of waste in Directive 75/442/EEC, excluding production residues” and “waste means any substance or object which the holder disposes of or is required to dispose of pursuant to the provisions of national law in force”[9].
Packaging Directive revision (2004/12/EC) was published in February 2004. It sets new recovery and recycling targets as a percentage of all packaging waste (Tab. 1.1) that need to be accomplished up to 31 December 2008. Besides, this revision modified packaging definition presented in the Directive 94/62/EC by inclusion of new criteria. For example, “items shall be considered to be packaging if they fulfil the abovementioned definition without prejudice to other functions which the packaging might also perform, unless the item is an integral part of a product and it is necessary to contain, support or preserve that product throughout its lifetime and all elements are intended to be used, consumed or disposed of together”[10].
These normative aims to harmonise the management of packaging waste in the EU and tackle the impact that packaging and packaging waste have on the environment. Although the primary objective is to increase the recovery and recycling of packaging waste in a consistent way in all Member States of the EU (so as to avoid barriers to trade), priority is also given to reducing the amount of packaging used and the reuse of packaging.
However, recycling has often ecological, economical, technical, or hygienic limits. Ecological limits arise when the environmental disturbances resulting from recycling are higher than without recycling. This is the
Introduction
function of local conditions and infrastructure. Economic limits appear when recovery is more expensive than the disposal of packages and are a theme of much debate. The re-processing operation itself uses oil-based energy; almost one third of the energy used in the manufacture of PE is invested in the processing operation[11].
There is a wide moral opposition against economical reasons winning over ecology. Besides, it is very difficult to express in money terms the environmental disturbances arising from landfill, such as visual disturbance and the loss of amenity. Nevertheless, when reprocessing energy is added to the energy expended in transportation and cleaning the waste and in the additives used to provide a good product, the ecological benefits of recycling is frequently lost.
Table 1.1. Recovery and Recycling Targets to be attained up to 31 December 2008.
Targets wt-%
Recover or incinerate with energy recovery > 60
Recycle in general 55-80
Glass recycled > 60
Paper and board recycled > 60
Metals recycled > 50
Plastics recycled > 22.5
Wood recycled > 15
The more obvious obstacles are the technical limits of recycling. They are the subjects of concern at plastics recycling, because of the ageing of material at recycling. Unlike glass and metals, which can be recycled to products with properties essentially similar to the primary materials, recycled plastics do never have the same quality as the virgin material. Mechanical recycling of individual polymers results in the reformation of similar but generally downgraded products. Each time polymers are reprocessed there is a loss in physical and mechanical properties due to peroxidation[11].
There are also the hygienic limits, once plastics are often soiled by food and other biological substances, making physical recycling of these materials impractical[12]. Moreover, health hazard reasons to avoid using these recycled materials for packaging food. Besides, materials recycling of household waste plastic is particularly difficult when they are contaminated with biological residues or, as is usually the case, when they are a mixture of different kinds of plastics.
Another solution for litter is the burning, but this is no longer and ecologically acceptable way of disposing of consumer wastes. Incineration with energy recovery is an ecologically acceptable way of utilising carbon-based polymer wastes due to their high calorific value. The calorific value of PE is similar to that of fuel oil (Table 1.2) and the thermal energy produced by incineration of PE is of the same order as that used in its manufacture. However, there is a widespread distrust of incineration by the public due to the possibility of toxic emissions from some polymers. An alternative to direct incineration is to convert polymer wastes by pyrolysis or by hydrogenation to low molecular weight hydrocarbons for use either as portable fuels or as polymer feed stocks. This is a highly specialised operation, which is not appropriate for municipal waste disposal[11].
Table 1.2. Calorific values of plastics compared with conventional fuels[11].
Fuel Calorific value Fuel Calorific value
(MJ/kg) (MJ/kg)
Methane 53 Polyethylene 43
Gasoline 46 Mixed plastics 30-40
Fuel oil 43 Municipal solid waste 10
Coal 30
The U.S. Environmental Protection Agency and Community of European Norms recommend composting as one of the most promising
Introduction
methods of waste management[13]. Since biodegradable polymers are suitable for composting, there is an increasing interest in polymers that can be biologically recycled to biomass and this type of polymers may be based either on renewable resources or on petrochemicals. This biological recycling should be considered as an alternative to the more traditional recycling procedures and this has stimulated researches around the world to modify existing polymers or to synthesise new polymers that can be returned to the biological cycle after use[12, 13].
Taking into account all these routes for waste reduction, it seems inevitable then that environmental biodegradable polymers will have an increasing role in the management of waste and litter in the future.
1.2. Use of polyethylene in packaging
1.2.1. The importance of polyethylene in packaging
Polyethylene, the first commodity plastic used on packaging, came into general use in the 1950s. Polyethylene (PE) is a family of polymers including for example the following: density polyethylene (LDPE), linear low-density polyethylene (LLDPE) and high-low-density polyethylene (HDPE). These PE differ principally in their density, which is related with their degree of crystallinity. Consequently, this property will influence their melting point ranges. Some typical properties values ranges for PEs are illustrated in Table 1.3[14].
Table 1.3. Typical PEs properties.a)
Type of PE Density Crystallinity Tm MW
(g/cm3) (%) (°C) (KDa)
LDPE 0.915-0.940 45-55 105-115 10-50
LLDPE 0.915-0.926 30-45 112-124 50-200
HDPE 0.940-0.970 70-90 120-130 up to 250
a)
The dominance of PEs on packaging products is principally due to its low cost. Some other advantages with their disadvantages are described in Table 1.4. The range of packaging forms for which PE is used extends from simple plastic film bags to combinations with other plastics or materials, such as paperboard and aluminium, to provide sealable packaging ensuring that the quality of the packaged foodstuff is effectively maintained.
Table 1.4. Advantages and disadvantages of polyethylenes.
Advantages Disadvantages
Very low cost Susceptible to environmental stress cracking
Excellent chemical resistance Low strength, stiffness and maximum service temperature Very good processability High gas permeability, particularly
carbon dioxide High impact strength at low
temperature Poor UV resistance
Excellent electrical insulating
properties Highly flammable
Very low water absorption High-frequency welding and joining impossible
FDA compliant
Although PE plastics were first produced over 50 years ago, manufacturing and processing developments continue to improve its properties, performance, and packaging applications[14]. One well-known example is concerned with the oxidation stability of PE. Olefin polymers are prone to oxidative degradation, particularly at the elevated temperatures used in their processing. The reaction of PE oxidation results in the formation of long-chain branches and cross-linking. Therefore, the formulations of all commercial PE plastics contain antioxidants[15, 16]. Besides, other additives must be incorporated in order to maintain and provide the desired physical
Introduction
properties and to ensure the efficient processing and handling of the finished products[17].
Additives such as colorants, whitening agents, slip additives, and antistatic agents are often conveniently incorporated into the basic polymer before processing into the final product (films, containers, etc.) by means of master batches. Master batches are concentrates of the additive(s) dispersed in the same or similar polymer types.
Both HDPE and LDPE plastics are used to produce a wide variety of caps and covers for bottles and containers. The use as films for container labels is also growing. To make PE films, the particular properties of slip (friction) and blocking (film layers sticking together) must be enhanced for effective and efficient handling during manufacture and processing into the finished packaging. Enhancement of these properties is achieved by the addition of slip agents and suitable fine particulate fillers to the polymer. Typical slip agents are the fatty acid amides oleamide and erucamide, which “bloom” (exudates) to the film surface after manufacture. Titanium dioxide and calcium carbonate are typically used to produce white plastics. The inclusion of calcium carbonate in the polymer also improves the properties of hardness, stiffness, and printability as well as permeability to oxygen and to water vapour. Shrinkage and elongation are reduced[14].
To improve adhesive properties of PE its structure was modified forming a class of polymer called ionomer. This new family of material is a polyolefinic copolymer containing a small amount of ionic comonomer, which contain sulphonic or carboxylic acid groups neutralized with a metal cation. Aggregation of these metal salt groups induces heterogeneity with a length scale of a few nanometers. The best-known (and commercially most important) ionomer are derived from ethylene-methacrylic acid copolymers, by neutralizing some or all of the methacrylic acid units with a metal cation (e.g., Na+ or Zn2+). Materials in this category are marketed by DuPont under the trade-mark Surlyn®. This polymer can be used in packaging seals, films, cosmetic goods and personal care sports, recreation foam sheet and encapsulants[18].
In multi-layers films PE is combined with a variety of polymer types, such as polyethylene terephthalate (PET), polypropylene (PP), poly(vinylidene chloride) (PVdC), and ethylene-vinyl alcohol copolymer (EVOH). The polymer used in each layer is selected to provide a required properties and performance characteristics. When good oxygen barrier property is essential, an aluminium foil layer is incorporated. Such flexible packaging is used for coffee, where the structure also acts as gas barrier in reverse, ensuring that the coffee aromas are retained. In special multi-layer packaging materials, PE is combined with paperboard and aluminium by extrusion coating. A typical example is the container for packaging long-life fruit juices and milk (Tetra Pak)[19]. The PE allows the container to be easily heat-sealed and also provides water barrier. The paperboard provides rigidity, and the aluminium acts as oxygen barrier, which ensures that the safety and quality of the packaged product are maintained during its shelf life. For foodstuffs with a short shelf life, it is not used the aluminium layer. Paperboard coated on both surfaces with PE is extensively used for boxed containers for milk products, take-away high-moisture and fatty foods, and for disposable beverage cups. Polyethylene-coated paperboard is widely used as external cartons for many foods, over a wide temperature range (frozen to ambient). Such cartons are easily heat sealed in food packaging line processes by spot contact heating.
Polyethylene-coated aluminium foil is extensively used as lidding material for pots and other containers. The PE coating that melts under heat and bonds the aluminium to the substructure provides the sealability of these foils[20].
Many of the PE films and containers used to package are printed to provide product identification, information on use, and decoration. Because PE has low surface energy, surface treatments are necessary to enable printing inks to achieve adequate adhesion. Corona discharge, flame, and ozone treatments are commonly used to increase the surface energy by imparting a degree of oxidation to the PE surface.
Introduction
1.2.2. Disposal of polyethylene
In the 1970s, all the technical advantages, which made hydrocarbon polymers so useful in the past (as biologically inert and resistant to peroxidation) become disadvantages. This was a consequence of the discarded polymer-based products at the end of their useful life, particularly when they appeared as litter in the environment. As the concentration of the PE used in packaging sectors such as in the manufacturing of shopping bags, bottles and containers is very large, the amount of problems relating the final disposal in landfills increases. Hence, the degradation and disposal options, or possibly the biodegradation of the used PE represent a very important subject from the point of view of both economic and environmental aspects.
As aforementioned, in an attempt to reduce the visible environmental pollution caused by post-consumer plastic materials, the members of EU States brought together to find a solution to plastic pollution. One of the objectives is the reduction of the waste through the recovery and recycling of these materials. However, recycling presents a great number of limitations. The most important is related to the technological problems, once this type of material often are disposed with organic products such as food, making recycling hard and sometimes impossible. Moreover, the costs of collecting, cleaning and sorting all these post-consumer plastics are high and the market for mechanically recycled plastics is limited, partly for this reason. Proper incineration of waste plastics would enable the recovery of most of the energy stored in them (polyolefins are excellent fuels) but modern incinerators are expensive.
Considering the aspects above, one possible solution for the problem of the PE disposal can be the partial or total replacement of PE for the named “Environmentally Degradable Plastics” (EDP). EDP can be considered to include a wide group of natural and synthetic polymeric materials or blends of both, that undergo chemical change under the influence of environmental factors[21]. The chemical changes must be followed by complete microbial assimilation of degradation products resulting in carbon dioxide and water[22]. The process of EDP degradation comprises two phases, disintegration and
mineralization. During the firs phase, disintegration is associated with the deterioration in physical properties, such as discoloration, embrittlement and fragmentation. In the second phase is assumed that a complete conversion of plastic fragments, after being broken down to low molecular weights should occurs[23].
1.3. Environmentally degradable plastics (EDP) 1.3.1. General considerations
The worldwide consumption of biodegradable polymers has increased from 14 million kg in 1996 to 68 million kg in 2001. Mainly markets for biodegradable polymers include packaging materials as shopping bags and food containers, hygiene products, consumer goods as fast-food tableware and toys, containers and agricultural materials as mulch films[12].
Several definitions are useful in understanding the complexity of the topic of biodegradable polymers. These begin with the concept of plastic waste following with that of natural polymers, degradable, biodegradable, hydrolytically degradable, and oxidatively degradable materials.
Natural polymers are by definition those biosynthesized by various routes in the biosphere. Proteins, polysaccharides, nucleic acids, lipids, natural rubber, and lignin, among others, are all biodegradable polymers. Moreover, the rate of the biodegradation may vary from hours to years depending on the nature of the functional group and degree of complexity of the macromolecule[24].
Degradation is a process where the deterioration in the polymer properties takes place due to different factors like light, heat, shear, etc[25]. As a consequence, the resulting smaller fragments do not contribute effectively to the mechanical properties and the material becomes brittle. Besides, the life of the material becomes limited[26]. The degradation of polymers may proceed by one or more mechanisms, including biodegradation, chemical degradation, photo and thermal oxidation, etc., depending on the polymer environment and desired application[27].
Introduction
Environmentally biodegradable polymers are designed to degrade upon disposal by the action of living organisms[12]. Biodegradation is defined as the conversion of a material to CO2, H2O and traces of inorganic chemicals under aerobic conditions or to CH4, CO2 and inorganic chemicals under anaerobic conditions by the action of Microorganisms (MO). So, biodegradation in aerobic (Eq. 1.1) and anaerobic (Eq. 1.2) environments may be described by the following chemical equations taking into account a hydrocarbon polymer[28]:
Polymer + MO + O2→ CO2 + H2O + biomass + residue (Eq. 1.1) Polymer + MO → CH4 + CO2 + H2O + biomass + residue (Eq. 1.2)
Biomass represents an important part of the organic carbon cycle, which has been assimilated by microorganisms.
It should be pointed out that though fragmentability of the polymer and loss of elongation (95 % is defined as the embrittlement point) should constitute inherent characteristics of degradable polymers, several additional features are required if the polymers are to be acceptable from the ecological point of view: (i) a predetermined service time (induction time) during which no properties change whatever; (ii) the end of induction period should be followed by an accelerated fragmentation stage; (iii) a final, total and innocuous assimilation of the fragmentary products by the ecosystem[29].
At the present time, there are three main classes of biodegradable polymers. In the first one, it is found the synthetic polymers. These polymers contain groups susceptible to hydrolysis attack by microbes such as polyesters, polyanhydrides, polyamides, polycarbonates, polyurethanes, polyureas and polyacetals[29, 30]. The second class of materials is composed of bacterial polymers as hydroxybutyrate) (PHB) and poly(3-hydroxybutyrate-co-valerate) (PHBV)[31]. Finally, it is considered the polymeric blends and bio-based composites as the third series of materials that are readily consumed by microorganisms. A classic example is the blends of PE with starch[30, 32, 33].
In this introduction, special attention will be given to the third class of EDP. In particular, it will be reviewed the literature related to materials based on oxo-biodegradable polyolefins, their preparation, its blends with natural polymers, the thermo and/or biodegradation mechanisms, the main applications, advantages and inconvenient of this family of materials.
1.3.2. Oxo-degradable polyolefins
There are two mainly applications for oxo-degradable polymers. The first is where biodegradability is part of the function of the product as for example in the biomedical or agriculture fields, and the second application is when degradability is desired at the end of the use of the product, as for packaging. An essential feature for both applications is a variable and controllable induction time to the beginning of peroxidation, which is the rate-controlling step in the overall biodegradation process[25, 34]. Carbon-chain polymers vary remarkably in their ability to resist peroxidation. The following sequence shows some common commercial hydrocarbon polymers in order of decreasing oxidative stability: Polyvinyl chloride (PVC) > Polyethylene (PE) > Polypropylene (PP)[35].
What is needed, is a way of controlling the time during which the polyolefin retains its normal, useful properties as well as a way of having it undergo subsequent oxo-biodegradation at a much higher than normal rate that is commensurate with the application and with the disposal environment[35]. The key to this control requirement is a sound understanding of the peroxidation mechanisms and kinetics[36]. In the environmental degradation of oxo-degradable polymers, the total degradation will be a synergistic effect of several agents[37]. The main degradant agents are UV-radiation, heat and oxidizing agents leaving to a brittle material with a higher susceptibility to biodegradation[22, 38]. The final end products of the total mineralization will be carbon dioxide and water. Before that stage is reached, many low molecular weight degradation products will be evolved, which in turn can increase or decrease the degradation[38].
Introduction
It is accepted that polyolefins are bioinert[38], which means that they are highly resistant to assimilation by microorganisms such as fungi and bacteria. This is expected, since the surfaces of materials and articles made from polyolefins are hydrophobic, which inhibit the growth of microflora on them. Besides, there are common mechanisms of biodegradation that involve bio-assimilation from the ‘‘ends’’ of substrate molecules. Since commercial polyolefins have relatively high molar mass values, there are very few ends of molecules accessible on or near the surfaces of materials made from these resins. Different approaches to render synthetic plastics degradable have been considered. It is generally found that photo and thermal-oxidation increases the biodegradation of polymers[21]. Photo and thermal-oxidation increase the amount of low molecular weight material by breaking bonds, increasing the surface area, through embrittlement and increasing the hydrophilicity by the introduction of carbonyl groups and all these effects promote biodegradation[39]. Although the family of polyolefins is considered to be not eco-friendly, it has been observed that its oxidation products are biodegradable[35, 40]. Such products have molar mass values that are significantly reduced, and they incorporate polar, oxygen-containing groups such as acid, alcohol and ketone. This is the basis for the term oxo-biodegradable polyolefins. This concept is used to distinguish polymers that biodegrade by a hydrolysis mechanism from those that are inert to hydrolysis but undergo oxidation. Oxo-biodegradation then denotes a two-stage process involving, in sequence, oxidative degradation, which is normally abiotic in the first instance, followed by the biodegradation of the oxidation products[35].
Oxo-degradable polymers can be produced by the addition of sensitizer additives that will promote the formation of free radicals in the presence of heat. Hence, peroxides will be generated and auto-oxidation will be consequently enhanced[41]. Oxo-degradable polymers can also be prepared by changing the polymer structure by introducing chromophores[41]. In this class of materials, the carbonyl groups can be introduced, for example, through the copolymerization of PE with a small amount of monomer such as carbon monoxide producing a degradable copolymer. Jones et al.[42] has formulated a
copolymer of vinyl ketones and styrene or ethylene where the ketone groups are part of the main polymer chain. These materials were shown to biodegrade and the degradation was monitored using respirometry.
Albertsson and Karlsson present different means of modifying otherwise relatively inert polymers (in particular PE) in order to obtain environmentally degradable polymers[39]. They concluded that the incorporation of transition metal complexes facilitates the photo-oxidation of inert LDPE, and that was also possible to induce early photo-oxidation by polymerization of ethylene with carbon monoxide or by the addition of other ketonic groups to PE. LDPE samples containing (1) iron dimethyldithiocarbamate, (2) iron dimethyldithiocarbamate and (3) 0.8% carbon black and iron dimethyldithiocarbamate and nickel dibutyldithiocarbamate were aging in a weatherometer where the temperature increased during ageing, achieving a mean value of about 50°C. The dithiocarbamates are effective processing stabilizers and heat stabilizers for polyolefins. Their photo-antioxidant activity depends on the metal ion, where iron and manganese complexes are the least stables. These metal complexes show a well-characterized induction period, which increases with their concentration in the polymer. The sulphur ligand iron complexes combine a high level of antioxidant activity during processing, storage and in the early stages of exposure to light. After this initiation, a very fast photo-oxidation occurs[39].
Polyolefins with enhanced degradability have been available commercially for more than three decades and have been successful used in agricultural products for most of this time. They can be obtained through the mixture of inert polymers with others from renewable resources as starch.
Starch is the lowest priced and most abundant worldwide commodity, it is the major form in which carbohydrates are stored by plants in the form of granules (mainly from potatoes, corn, and rice). Among other features, it is inexpensive and annually renewable. Starch granules vary from plant to plant but are in general composed of a linear polymer, amylase (in most cases up about 20 wt-% of the granule), and a branched polymer, amylopectin[43]. It is produced in most countries and is available at low cost in all countries. In
Introduction
Europe, it is industrially produced with a volume of almost 7 million tones/year. Nearly 50 % of the starch produced is already used for non-food applications and about 30 % of the starch production is industrially precipitated from aqueous solutions because of its very good film-forming properties[44]. Animals, plants and microorganisms are able to utilize starch as a source of energy. Microorganisms produce various starch hydrolyzing enzymes such as amylase and their wide distribution assures the biodegradation of starch in nature[39].
The first attempts to increase degradation of hydrocarbon chain polymers as PE, regards to the incorporation of natural polymers, in particular starch and transition metal pro-oxidants. Microorganisms initially attack this biopolymer leaving a brittle material with a greater surface/volume ratio. Hence, the sunlight, heat, oxygen, etc. promote auto-oxidation of the chemically unstable pro-oxidant, generating free radicals, which attack the molecular structure of the PE. With time, the molecular weight will have decreased so much that biodegradation of the PE can take place These materials are useful in applications such as mulching films[27, 39]. However, this type of blends usually leads a phase separation and reduction in mechanical properties due to the lack of compatibility between hydrophilic biopolymer and generally hydrophobic thermoplastic[26].
The idea of using starch inside synthetic polymer matrix was proposed by Griffin[45]. His study was based on introducing starch in its natural form into the synthetic matrix at amounts lower than 10 % while keeping the granular structure intact. In this case, starch is only a filler susceptible to enzymatic degradation but unable to affect the mechanical properties of the final material (20-30 MPa tensile strength and 700-900 % elongation at break point for a 90:10 PE:starch blend). The original concept has been improved also by the addition of unsaturated polymer, a thermal stabilizer and together with the formulation containing starch, a transition metal salt. The starch and other additives are mixed in a master batch (MB), which can be included in polymers in different concentrations. However, blends of LDPE with high amounts of starch exhibits poor mechanical properties owing to their inherent differences in polarity that results in immiscible blends[46]. The main areas of