USE OF THE “ROTHC” MODEL TO SIMULATE SOIL ORGANIC CARBON DYNAMICS ON A SILTY-LOAM INCEPTISOL IN NORTHERN
ITALY UNDER DIFFERENT FERTILIZATION PRACTICES
UTILISATION DU MODELE “ROTHC” POUR SIMULER LA
DYNAMIQUE DU CARBONE ORGANIQUE DU SOL SUR UN INCEPTISOL LOAM-LIMONEUX EN ITALIE DU NORD, SELON LES
DIFFÉRENTS PRATIQUES DE FERTILISATION
USO DEL MODELLO “ROTHC” PER SIMULARE LA DINAMICA
DEL CARBONIO ORGANICO DEL SUOLO IN UN INCEPTISUOLO FRANCO-LIMOSO IN NORD ITALIA SOTTOPOSTO A DIFFERENTI
PRATICHE DI FERTILIZZAZIONE
Rosa Francaviglia(1)*, Claudio Baffi (2), Antonio Nassisi (3), Chiara Cassinari (2), Roberta Farina(1)
(1) Consiglio per la Ricerca e la sperimentazione in Agricoltura, Centro di Ricerca
per lo Studio delle Relazioni tra Pianta e Suolo, CRA-RPS, Rome, Italy
(2) Università Cattolica del S. Cuore, Facoltà di Agraria,
Istituto di Chimica Agraria e Ambientale, Piacenza, Italy
(3) Area Analitica Ambientale (A.A.A.) Suolo e Rifiuti,
ARPA Emilia-Romagna, Piacenza, Italy
*Corresponding author: E-mail: [email protected] Abstract
We evaluated the efficiency of the RothC model in simulating Soil Organic Carbon (SOC) dynamics after 12 years of organic and mineral fertilization practices in a study area located in northern Italy, on a silty-loam Inceptisol with a rotation including tomato, maize and alfalfa. The model performance was assessed by RMSE and EF coefficients. RothC clearly simulated SOC decreases in 71 samples (RMSE=7.42; EF=0.79), while it performed with less accuracy when considering all samples (96 samples; RMSE=12.37; EF=0.58), due to the fact that the model failed in case of measured SOC increases (25 samples; RMSE=20.77; EF=-0.038). The model was used to forecast the SOC dynamics over a 50-year period under the same pedoclimatic conditions. Only clay contents >15% allowed to predict increasing levels of SOC above the starting values.
Keywords: cropping systems, fertilization practices, FYM, RothC, SOC Résumé
Nous avons évalué l'efficacité du modèle RothC pour simuler la dynamique du carbone organique du sol (SOC) après 12 ans de fertilisation organique et minérale dans une zone d'étude située dans le nord de l'Italie, sur un Inceptisol loam-limoneux avec une rotation de tomate, maïs et luzerne. La performance du modèle a été évaluée par les coefficients RMSE et EF. RothC a bien simulé une réduction
du SOC dans 71 échantillons (RMSE=7.42; EF=0.79), mais ne s’est pas montré efficace si l’on considère l’ensemble des échantillons (96 échantillons; RMSE=12.37; EF=0.58), principalement par suite de la faible précision dans le cas d'augmentation du SOC (25 échantillons; RMSE=20.77; EF=-0.038). Le modèle a été utilisé dans les mêmes conditions pédoclimatiques pour prédire la dynamique du SOC sur une période de 50 ans. Seules les teneurs en argile>15% ont permis de prévoir l'augmentation des niveaux de SOC au-delà des valeurs de départ.
Mots-clés: systèmes de culture, pratiques de fertilisation, FYM, RothC, SOC Riassunto
È stata valutata l’efficacia del modello RothC nel simulare la dinamica del carbonio organico del suolo (SOC) dopo 12 anni di pratiche di fertilizzazione organica e minerale in un’area di studio sita in Nord Italia, su un Inceptisuolo franco-limoso e una rotazione pomodoro-mais-erba medica. Il modello è stato validato tramite i coefficienti RMSE ed EF. RothC ha simulato bene le diminuzioni osservate in 71 campioni (RMSE=7.42; EF=0.79), mentre si è dimostrato meno efficiente considerando tutti i campioni (96 campioni; RMSE=12.37; EF=0.58), prevalentemente per la scarsa accuratezza delle previsioni nei campioni con aumenti di SOC misurati (25 campioni; RMSE=20,77; EF=-0,038). Il modello è stato utilizzato, nelle stesse condizioni pedologiche e climatiche, per prevedere la dinamica del SOC su 50 anni. Solo valori di argilla >15% hanno consentito di prevedere valori di SOC superiori a quelli iniziali.
Parole chiave: sistemi colturali, fertilizzazione, letame, RothC, carbonio organico del suolo
Introduction
Soil organic carbon (SOC) positively affects soil functions with regard to habitat, biological diversity, soil fertility, crop production potential, erosion control, water retention, substance exchange between soil, atmosphere and water, and the filtering, buffering and transforming capacity (Huber et al., 2001; Kirchmann and Andersson, 2001).
Soil Organic Matter (SOM) is constantly built up and decomposed, hence SOC contained in the organic matter is released to the atmosphere as CO2 and recaptured
through photosynthesis. Soil C sequestration is achieved by increasing the net flux of C from the atmosphere to the terrestrial biosphere, by storing more of the C from net primary production in the longer-term C pools in the soil, or by slowing down decomposition (Smith, 2005). As a consequence, C sequestration via agricultural soils has a potential to contribute significantly to climate change mitigation, and can be affected by management practices (Conant et al., 2001).
It is helpful to study SOC dynamics through the use of simulation models which take into account the interactions among climate, pedology, cropping system, soil and crop management (Francaviglia et al., 2012). Well-validated models can be used to predict SOC changes under the different management and climatic
conditions that may occur in the future (Jones and Donnelly, 2004). Among SOC models, CENTURY (Parton et al., 1994) and RothC (Coleman and Jenkinson, 1996) are particularly suitable to describe the turnover of the different SOC pools. RothC has been extensively applied in Europe for SOC modelling (Coleman et al., 1997; Falloon and Smith, 2002; Ludwig et al., 2007; Leifeld et al. 2009; Heitkamp
et al. 2012). In Italy, Farina et al. (2013) recently applied RothC to a long-term experiment on a Vertisol under semi-arid conditions in southern Italy, but no studies are available for northern Italy.
The aim of this paper was to evaluate the efficiency of RothC to simulate SOC changes observed over 12 years (1994-2005) on a silty-loam Inceptisol in northern Italy, with a rotation that included maize, tomato and alfalfa under different organic and mineral fertilization practices. Moreover, another goal was to verify the opportunity of using RothC to forecast SOC over a longer period of time (50 years) as function of clay content of the soil.
Materials and methods Study area and soil data
The study area (9 ha) is located in Gariga (Piacenza, northern Italy) and is part of an experimental regional farm, named Tadini. The climate, according to Köppen (1936), is sub continental temperate, with a yearly thermal excursion >19°C, and one to three months with mean T>20°C. The pluviometric regime is sub coastal with a yearly rainfall of 760 mm in 72 rainy days. Soils are classified as loamy, skeletic, mixed mesic, Udic Haplustepts (Soil Survey Staff, 2010), and Eutric Cambisols (WRB, 2006); they are characterized by a high gravel content, under which carbonates occur, and by a medium-high fertility. The management practices were monitored for 12 years (1994-2005). 96 soil samples were collected both in 1994 and in 2005 to the plough depth of 40 cm, using a georeferenced fixed sampling grid along the rows (Cassinari et al., 2011). Soil samples were air-dried, and the analyses were made on the < 2 mm soil fraction after sieving. Sand, silt and clay were determined by wet sieving and sedimentation (pipette method), organic C by elementary analysis by flash combustion (CHN analyser Model NA2000). The results of the chemical analyses are shown in Table n. 1. The other main soil parameters are reported in Cassinari et al. (2011).
Table 1 - Soil parameters at the start (1994) and the end (2005) of the experiment
Data Sand (%) Silt (%) Clay (%) SOC (g kg-1)
1994 2005 1994 2005 1994 2005 1994 2005 Max 19.4 24.8 73.4 78.8 27.0 26.5 26.4 24.6 Min 10.6 6.00 60.3 53.20 8.6 9.25 10.0 8.50 Average 15.3 ** 11.0 ** 67.3 ** 71.0 ** 17.4 ns 18.1 ns 17.7 ** 15.2 ** SE 2.10 3.63 4.03 4.93 5.46 3.89 4.88 4.51
Statistical analysis
The statistical analysis was performed with the SPSS© 15.0 software package. All data were tested firstly for normality with the Shapiro-Wilk test and Levene's test for equality of variances, and then the t test on independent samples was applied. Two well known statistical indicators were used to assess the model performance and to compare measured and simulated values: RMSE (root mean square error) and EF (modelling efficiency):
n i i iS
O
n
RMSE
1 2)
(
1
n 1 i 2 i n 1 i 2 i i)
O
O
(
)
O
S
(
1
EF
where Oi and Si are observed and simulated SOC at ith value, Ō is the mean of the
observed data and n is the number of the paired values. The lowest possible value of RMSE is zero, indicating that there is no difference between simulated and observed data. If the model accurately describes the data the RMSE should have approximately the same order of magnitude of the standard deviation (Smith and Smith, 2007). EF compares simulations and observations on an average level, and can range from - to 1, with the best performance at EF=1. Negative values indicate that the simulated values describe the data less well than the mean of the observations.
Crop management
The agronomic practices and the rotation during the 12 years (1994-2005) are shown in Table 2.
Table 2 - Yields, carbon inputs and fertilization practices carried out in the period
1994-2005 Year Crop Type Yield (t ha-1) Crop Residues Organic inputs Total organic inputs NPKf additions (kg ha-1) (t C ha-1) 1994 Tomato 52.0a 3.30 3.75d 7.05 no data 1995 Silage maize 60.0b 3.03 3.0d 6.03 166-70-175 1996 Alfalfa 1st 4.0c 0.14 - 0.14 28-84-84 1997 Alfalfa 2nd 12.5c 0.45 - 0.45 - 1998 Alfalfa 3rd 14.0c 0.51 - 0.51 - 1999 Alfalfa 4th 13.0c 0.47 - 0.47 - 2000 Silage maize 60.0b 3.03 - 3.03 166-0-175 2001 Tomato 61.6a 4.22 3.0d 7.22 123-80-140 2002 Silage maize 63.0b 3.18 3.0d 6.18 138-0-100 2003 Silage maize 65.0b 3.28 0.5e 3.78 205-0-210 2004 Silage maize 63.0b 3.18 0.5e 3.68 205-0-210 2005 Silage maize 53.5b 2.70 - 2.70 240-150-250
a fresh weight; b silage (66% moisture); c hay (91% moisture); d FYM; e vinasse; f P as P
The average composition of FYM and vinasse is reported in Table 3. FYM was applied to tomato in 1994 and 2001, to silage maize in 1995 and 2002. Vinasse was applied to silage maize in 2003 and 2004. Crop residues from the tomato crop were incorporated into the soil in 1994 and 2001.
Organic input
Dry matter Total N Organic C P2O5 K2O Table 3 Average composition of FYM and vinasse applied during the experiment
%
FYM 25.0 0.48 7.5 0.25 0.60
vinasse 45.7 3.00 14.2 0.00 6.00
Annual carbon inputs in t C ha-1 from crop residues (above and below ground)
were estimated by the following formulas given by Kong et al. (2005) and Stewart
et al. (2007):
Maize stovers = 0.1 x (AGB dry wt. yield) [1]
Maize roots = 0.23 x (AGB dry wt. yield) [2] Tomato AGR (dry wt. yield) =
0.001x (fresh wt. yield)2 +0.05 x (fresh wt. yield) + 0.34 [3]
Tomato roots = 0.30 x (AGB dry wt. yield) [4]
Alfalfa AGR = 0.325 x (AGB dry wt. yield) [5]
Alfalfa BGR = 0.43 x (AGB dry wt. yield)+(AGR) [6]
where AGB is above-ground biomass, AGR above-ground residues, BGR below-ground residues. Calculated data for each crop and year are expressed in t C ha-1 as
reported in Table 2.
The RothC model: description, parameterization and data treatment
RothC (Rothamsted Carbon model) simulates the turnover of C in non waterlogged soil as affected by soil type, temperature, moisture and plant cover (Coleman and Jenkinson, 1996); it does not contain a submodel for plant growth and yield, nor computes C inputs to the soil from above-ground and below-ground biomass. The data required to run the model are: monthly rainfall and evaporation or potential evapotranspiration (mm), monthly air temperature (°C), clay content (%), an estimate of the decomposability of the incoming plant material (the Decomposable Plant Material/Resistant Plant Material-DPM/RPM ratio), monthly soil cover (whether the soil is bare or vegetated), monthly input of plant residues (t C ha-1);
monthly input of FYM (t C ha-1) if any.
The model performs two types of simulations: "direct" that uses the known input of organic carbon to the soil to calculate the SOC, and "inverse" that evaluates the input of organic carbon required to maintain the stock of SOC. The IOM component (inert organic matter) can be calculated from SOC (Falloon et al., 1998). Soil bulk density, required to convert SOC to t C ha-1, was calculated after
The first step was to run the model to equilibrium according to Smith et al. (1997), on the 96 soil samples in the inverse mode to calculate the required carbon inputs needed to match the initial SOC content measured in 1994 to a depth of 40 cm, using a DPM/RPM=1.44 which is valid for most agricultural crops. As a second step simulations were run with the crop rotation until 2005, using the yearly carbon inputs reported in Table 2.
Moreover, we examined the distribution of the SOC stocks at the end of the experiment in 2005. Data were evaluated considering the following datasets: A) all the 96 samples; B) 71 samples with decreasing measured SOC in comparison with the initial value in 1994, and C) 25 samples where an increase of SOC stocks was observed.
RothC long-term simulations
RothC was used to simulate the SOC trend over 50 years, on the same soil type under a baseline climate generated with the weather generator LarsWG5 (Semenov and Stratonovitch, 2010) from the long-term climatic data collected from the local meteorological station (1981-2010). We assumed a 2-yr rotation tomato-silage maize, very common in this area, with additions of 50 and 40 t ha-1 of FYM
respectively that is normally locally available. To verify the effectiveness of the proposed rotation in increasing SOC, four clay classes were identified: clay 10 (<10% clay), clay 15 (10-15% clay), clay 20 (15-20% clay), and clay 25 (20-25% clay). The rationale for this exercise is that decomposition processes in the model (Johnston et al., 2009) are influenced by temperature, soil water content, plant cover and soil clay content (from which is calculated the soil moisture held between field capacity and wilting point and the proportion of CO2 that is evolved).
Results
RothC simulations (1994-2005)
The measured SOC decreased from 79.13 t C ha-1 to 73.72 t C ha-1 as average. The
average SOC decrease was 5.41 t C ha-1 (−6.8%, significant at p<0.001) equal to
0.45 t C ha-1yr-1.
When dataset A is considered (96 samples) the RothC model simulated the SOC stock changes (Figure 1) with a significant linear relationship (p<0.001) between observed and simulated C stocks. However the decrease simulated by the model was 9.0 t C ha-1 (−11%) equal to 0.75 t C ha-1yr-1.
For dataset B (71 samples) the linear regression was significant at p<0.001 (Figure 2). The observed SOC in 2005 decreased by 10.4 t C ha-1 (−13%) equal to 0.86 t C
ha-1yr-1. The model simulated a decrease of 9.1 t C ha-1 (−11%) equal to 0.76 t C
ha-1yr-1.
For dataset C (25 samples), the linear regression was significant at p<0.001 (Figure 3). But the observed SOC in 2005 increased by 8.7 t C ha-1 (+11%) equal to 0.72 t
C ha-1yr-1, while the model simulated a decrease of 9.0 t C ha-1 (−11%) equal to
y = 0.4924x + 33.779 R² = 0.6651 RMSE = 12.37 EF = 0.584 0 20 40 60 80 100 120 0 20 40 60 80 100 120 Si m ul at e d SO C ( t C ha -1) Observed SOC (t C ha-1) Figure 1 Observed vs. simulated SOC values for dataset A (96 samples) y = 0.6541x + 25.179 R² = 0.8406 RMSE = 7.42 EF = 0.793 0 20 40 60 80 100 120 0 20 40 60 80 100 120 Si m ul at e d SO C ( t C ha -1) Observed SOC (t C ha-1) Figure 2 Observed vs. simulated SOC values for dataset B (71 samples)
y = 0.5149x + 24.562 R² = 0.8455 RMSE = 20.77 EF = -0.035 0 20 40 60 80 100 120 0 20 40 60 80 100 120 Si m ul at e d SO C ( t C ha -1) Observed SOC (t C ha-1) Figure 3 Observed vs. simulated SOC values for dataset C (25 samples)
To evaluate the model performance we compared RMSE with the Standard Deviation (SD) of observed and simulated SOC values.
For dataset A (96 samples ) the SD of observed SOC after 12 years was 19.29 compared to a SD of simulated SOC of 11.65; the RMSE value was 12.37, i.e. lower than the SD of the observed values. But the EF value (0.58) was far from 1, so the linear regression was not the best model in this case. For dataset B (71 samples) the SD of observed SOC at the end (2005) was 16.42 compared to a SD of simulated SOC of 11.71; the RMSE value was 7.42, i.e. much lower than the SD of the observed values. In addition, the EF value (0.79) was closer to 1, so the model performance was fairly good. For dataset C (25 samples) the SD at the end (2005) was 20.84 compared to a SD of simulated SOC of 11.67; the RMSE value was 20.77, i.e. comparable to the SD of the observed values. But, the EF value (−0.035) was negative, so the model completely failed to simulate the SOC increase.
RothC long-term simulations
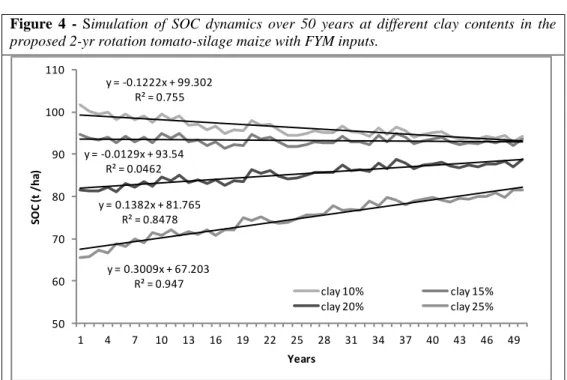
Results of the simulation over 50 years and the proposed 2-yrs rotation tomato-silage maize are shown in Figure 4. Yearly data were interpolated with a linear regression which was highly significant (p<0.001) for clay 10, 20 and 25, and not significant for clay 15. For clay 10 a decrease of SOC was observed in comparison with the initial value (−8.01±2.32 t C ha-1); for clay 15 a nearly steady-state
(−0.78±0.90 t C ha-1); for clay 20 (+8.79±2.34 t C ha-1) and clay 25 (+17.70±4.86 t
C ha-1) an increase of SOC. Average changes in t C ha-1yr-1 were −0.16±0.05 (clay
have shown that under these specific pedoclimatic conditions, the proposed rotation could increase the SOC levels only at higher clay contents (i.e. 15-20% and >20%) in comparison with the long-term rotation previously discussed and including maize, tomato and alfalfa with and without organic inputs.
Figure 4 - Simulation of SOC dynamics over 50 years at different clay contents in the
proposed 2-yr rotation tomato-silage maize with FYM inputs. y = -0.1222x + 99.302 R² = 0.755 y = -0.0129x + 93.54 R² = 0.0462 y = 0.1382x + 81.765 R² = 0.8478 y = 0.3009x + 67.203 R² = 0.947 50 60 70 80 90 100 110 1 4 7 10 13 16 19 22 25 28 31 34 37 40 43 46 49 SO C (t / ha ) Years clay 10% clay 15% clay 20% clay 25% Discussion
Our simulations have some sources of uncertainty to be considered: i) a fixed C content in FYM during the years was used, ii) the C content of vinasse was not measured but certified by the manufacturer, and iii) C inputs from crop residues were estimated. Moreover, SOC showed an increase in some areas of the plot, which can be ascribed either to a non homogeneous distribution of organic fertilizers or to a translocation of soil due to the tillage operations managed in the same operational manner over the years, which could have induced some changes in the physical protected SOC (e.g. microaggregates and silt+clay associated). Nevertheless, results highlighted that SOC conservation is highly dependent on the amount of organic inputs and crop residues returned to the soil. These inputs were actually adequate in the tomato crop, partially adequate in silage maize receiving FYM but with a lower input from crop residues. Vinasse addition did not prove effective in maintaining the C stock, at least at the rate applied. Where no organic inputs were added, SOC inputs from crop residues were inadequate to maintain the SOC levels.
Our results can be considered in agreement with previous results from long-term experiments using RothC for SOC modelling. Leifeld et al. (2009) explained the overall SOC decline by reduced carbon inputs from the start of the experiment, which were most pronounced in conventional management with and without mineral fertilizer. Yokozawa et al. (2010) observed a SOC decrease because the C input was lower than that required to maintain the baseline SOC level. Yang et al. (2003) indicated that the treatment without fertilizer/FYM addition led to a continuous decline in SOC, and mineral fertilizations were inadequate to maintain the SOC levels unless FYM was added.
We also investigated the effect on SOC dynamics due to a change in the crop rotation, to a 2-yr tomato-silage maize rotation receiving high C inputs from FYM. After 50-years of simulation the rotation proved to be effective in increasing SOC only if clay content was in the range 15-20% and 20-25%, thus confirming the importance of clay and the silt-clay protected C pool to stabilize SOC and limit its decomposition (Johnston et al., 2009; Six et al., 2002).
Conclusions
SOC sequestration is of special interest in Italy which is part of the Mediterranean area where SOC decreases are frequently observed, since returns of organic matter to soils are low and mostly rely on crop residues, while losses are high due to climatic and intensive farming practices.
In this study appreciable results were obtained for the most part (71 samples) of the total 96 samples, where SOC decreases were observed because the model assumes a first order kinetics for the decomposition of the different pools of organic matter, i.e. C stocks are linearly proportional to C inputs. In other words, the model predicts that soil C stocks can, in theory, be increased without limit, provided that the amount of C inputs is adequate to maintain or increase the C stock at the equilibrium. For this reason RothC failed to simulate the SOC increase in some points of the area, due to some inherent sources of uncertainty, including the non homogeneity of the plot.
Acknowledgments
We would like to thank Dante Tassi (Tadini Farm, Piacenza) for the field technical assistance, Matteo Cerini (Alberoni Observatory, Piacenza) for the assistance with climatic data, and Massimo Vincini (CRAST Catholic University, Piacenza) for the scientific assistance in data collection.
References
CASSINARI C., NASSISI A., TASSI D., BAFFI C. (2011) Effect of agronomical management on organic matter dynamic: the case study of an experimental farm in northern Italy. Environmental Quality EQA, GEOL@B ONLUS, 6:85–94.
COLEMAN K., JENKINSON D.S. (1996) RothC-26.3 - A model for the turnover of carbon in soil. In: Powlson, D.S., Smith, P., Smith, J.U. (Eds), Evaluation of Soil Organic Matter Models Using Existing Long-Term Datasets. Springer-Verlag, Heidelberg, 237–246.
COLEMAN K., JENKINSON D.S., CROCKER G.J., GRACE P.R., KLIR J., KORSCHENS M., POULTON P.R., RICHTER D.D. (1997) Simulating trends in soil organic carbon in long-term experiments using RothC-26.3. Geoderma 81(1–2):29-44. CONANT R.T., PAUSTIAN K., ELLIOTT E.T. (2001) Grassland management and conversion into grassland: effects on soil carbon. Ecological Applications 11:343–355. DEAN J.D., HUYAKORN P. S., DONIGIAN A.S., VOOS K.A., SCHANZ R.W., CARSEL R.F. (1989) Risk of unsaturated/saturated transport and transformation of chemical concentrations (RUSTIC). Volume II: User’s guide. United States Environmental Protection Agency, Environmental Research Laboratory, EPA/600/3-89/048b, 355 pp. FALLOON P., SMITH P., COLEMAN K., MARSHALL S. (1998) Estimating the size of the inert organic matter pool from total soil organic carbon content for use in the Rothamsted carbon model. Soil Biology and Biochemistry 30:1207–1211.
FALLOON P., SMITH P. (2002) Simulating SOC changes in long-term experiments with RothC and CENTURY: model evaluation for a regional scale application. Soil Use and Management 18 (2):101–111.
FARINA R., COLEMAN K., WHITMORE A.P. (2013) Modification of the RothC model for simulations of soil organic C dynamics in dryland regions. Geoderma 200-201:18–30. FRANCAVIGLIA R., COLEMAN K., WHITMORE A.P., DORO L., URRACCI G., RUBINO M., LEDDA L. (2012) Changes in soil organic carbon and climate change. Application of the RothC model in agro-silvo-pastoral Mediterranean systems. Agricultural Systems 112:48–54.
HEITKAMP F., WENDLAND M., OFFENBERGER K., GEROLD G. (2012) Implications of input estimation, residue quality and carbon saturation on the predictive power of the Rothamsted Carbon Model. Geoderma 170:168–175.
HUBER S., SYED B., FREUDENSCHUß A., ERNSTSEN V., LOVELAND, P. (2001) Proposal for a European soil monitoring and assessment framework. European Environment Agency, Technical report 61, Copenhagen, 58 pp.
JOHNSTON A.E., POULTON P.R., COLEMAN K. (2009) Soil organic matter: its importance in sustainable agriculture and carbon dioxide fluxes. Advances in Agronomy 101:1–57.
JONES M.B., DONNELLY A. (2004) Carbon sequestration in temperate grassland
ecosystems and the influence of management, climate and elevated CO2. New Phytologist
164:423–439.
KIRCHMANN H., ANDERSSON R. (2001) The Swedish system for quality assessment of agricultural soils. Environmental Monitoring and Assessment 72:129–139.
KONG A.Y.Y., SIX J., BRYANT D., DENISON R.F., VAN KESSEL C. (2005) The Relationship between Carbon Input, Aggregation, and Soil Organic Carbon Stabilization in Sustainable Cropping Systems. Soil Science Society of America Journal 69:1078–1085. KÖPPEN W. (1936) Das geographische system der klimate. In: Köppen, W. and Geiger, R. (Eds.), Handbuch der klimatologie, Vol 1 Part C pp. 1–44. Verlag von GebrüderBorntraeger, Berlin.
LEIFELD J., REISER R., OBERHOLZER R.H. (2009) Consequences of conventional versus organic farming on soil carbon. Results from a 27-year field experiment. Agronomy Journal 101:1204–1218.
LUDWIG B., SCHULZ E., RETHEMEYER J., MERBACH I., FLESSA H. (2007) Predictive modelling of C dynamics in the long-term fertilization experiment at Bad Lauchstadt with the Rothamsted Carbon Model. European Journal of Soil Science 58 (5): 1155–1163.
PARTON W.J., SCHIME D.S., OJIMA D.S., COLE C.V. (1994) A general model for soil organic matter dynamics: sensitivity to litter chemistry, texture and management, in: Bryant, R.B., Arnold, R.W. (Eds), Quantitative Modeling of Soil Forming Processes. SSSA Special Publication 39, Madison, WI, 147–167.
SEMENOV M.A., STRATONOVITCH P. (2010) Use of multi-model ensembles from global climate models for assessment of climate change impacts. Climate Research 41:1-14. SIX J., CONANT R.T., PAUL E.A., PAUSTIAN K. (2002) Stabilization mechanisms of soil organic matter: Implications for C-saturation of soils. Plant and Soil 241:155–176. SMITH P. (2005) An overview of the permanence of soil organic carbon stocks: influence of direct human-induced, indirect and natural effects. European Journal of Soil Science 56: 673–680.
SMITH P., SMITH J.U., POWLSON D.S., MCGILL W.B., ARAH J.R.M., CHERTOV O.G., COLEMAN K., FRANKO U., FROLKING S., JENKINSON D.S., JENSEN L.S., KELLY R.H., KLEIN-GUNNEWIEK H., KOMAROV A.S., LI C., MOLINA J.A.E., MUELLER T., PARTON W.J., THORNLEY J.H.M., WHITMORE A.P. (1997) A comparison of the performance of nine soil organic matter models using datasets from seven long-term experiments. Geoderma 81:153–225.
SMITH J., SMITH P. (2007) Introduction to Environmental Modelling. Oxford University Press, New York, 180 pp.
SOIL SURVEY STAFF (2010) Keys to soil taxonomy. 11th edition. Washington, DC, Natural Resources Conservation Service, USDA, 338 pp.
STEWART C.E., PAUSTIAN K., CONANT R.T., PLANTE A.F., SIX J. (2007) Soil carbon saturation: concept, evidence and evaluation. Biogeochemistry 86:19–31.
WRB (2006) World Reference Base for Soil Resources. World Soil Resources Report 103. IUSS, ISRIC, FAO, Rome, 145 pp.
YANG X.M., ZHANG X.P., FANG H.J., ZHU P., REN J., WANG L.C. (2003) Long-term effects of fertilization on soil organic carbon changes in continuous corn of northeast China: RothC model Simulations. Environmental Management 32:459–465.
YOKOZAWA M., SHIRATO Y., SAKAMOTO T., YONEMURA S., NAKAI M., OHKURA T. (2010) Use of the RothC model to estimate the carbon sequestration potential of organic matter application in Japanese arable soils. Soil Science and Plant Nutrition 56: 168–176.