Alma Mater Studiorum
Universit`
a degli Studi di Bologna
Facolt`
a di Scienze Matematiche, Fisiche e Naturali
Dipartimento di Astronomia
DOTTORATO DI RICERCA IN ASTRONOMIA Ciclo XXII
ANALYSIS OF THE NUCLEAR PROPERTIES OF
BRIGHTEST CLUSTER GALAXIES
AND COMPARISON WITH “NORMAL” RADIO GALAXIES.
Dottoranda: ELISABETTA LIUZZO
Coordinatore: Relatore:
Chiar.mo Prof. Chiar.mo Prof.
LAURO MOSCARDINI GABRIELE GIOVANNINI
Co-relatore: Dr. MARCELLO GIROLETTI
Settore Scientifico Disciplinare: Area 02 - Scienze Fisiche FIS/05 Astronomia e Astrofisica
QUESTA TESI E’ STATA SVOLTA
NELL’AMBITO DELLE ATTIVITA’ DI RICERCA
DELL’ ISTITUTO DI RADIOASTRONOMIA
DELL’ ISTITUTO NAZIONALE DI ASTROFISICA
Contents
Abstract i
1 General properties of BCGs 1
1.1 Observational properties. . . 1
1.1.1 Morphological types. . . 1
1.1.2 Position in the cluster. . . 5
1.1.3 Radii and Surface brightness. . . 5
1.1.4 Size-luminosity relation. . . 7
1.1.5 Ellipticity. . . 9
1.1.6 Dynamical mass. . . 9
1.1.7 The Fundamental Plane. . . 10
1.1.8 Faber−Jackson relation. . . 12
1.1.9 Stellar populations. . . 14
1.1.10 Emission line properties. . . 16
1.2 Theories on the origin of BCGs. . . 20
1.2.1 Cooling Flow. . . 20
1.2.2 Galactic cannibalism. . . 22
1.2.3 Galaxy merging. . . 23
1.3 Radio loud BCGs. . . 28
1.3.1 The cooling flow problem. . . 31
2 Pc scale properties of BCGs 37 2.1 The definition of a complete sample of BCGs. . . 37
2.2 The data set. . . 40
2.2.1 The data reduction. . . 40
2.3 Notes on Individual Sources. . . 42
2.3.1 NGC708 (B2 0149+35) in Abell 262. . . 42 2.3.2 NGC910 in Abell 347. . . 43 2.3.3 3C 75 in Abell 400 . . . 44 2.3.4 UGC2489 in Abell 407. . . 46 2.3.5 UGC3274 in Abell 539. . . 48 2.3.6 NGC2329 in Abell 569. . . 48 2.3.7 CGCG 261-059 in Abell 576. . . 51 2.3.8 NGC 2832 in Abell 779. . . 53 2.3.9 NGC3550 in Abell 1185. . . 53 2.3.10 4C 29.41 in Abell 1213. . . 54 2.3.11 IC 2738 in A1228. . . 56 2.3.12 IC 712 and IC 708 in Abell 1314. . . 56 2.3.13 NGC3842 and 3C 264 in Abell 1367. . . 60 2.3.14 NGC4874 in Abell 1656. . . 63 2.3.15 UGC10143 in Abell 2147. . . 65 2.3.16 UGC10187 in A2152. . . 67 2.3.17 NGC6086 in Abell 2162. . . 67 2.3.18 NGC6173 in A2197. . . 67 2.3.19 3C 338 in Abell 2199. . . 69 2.3.20 3C 465 in Abell 2634. . . 71 2.3.21 NGC7768 in Abell 2666. . . 73 2.4 Parsec-scale morphology. . . 74 2.4.1 Two-sided morphology. . . 74 2.4.2 One-sided morphology. . . 75 2.4.3 Unresolved sources. . . 80 2.4.4 Undetected sources. . . 80
2.5 Statistical considerations for the complete sample. . . 81
2.6 The extended sample. . . 84
3 Peculiar cases of BCGs 89 3.1 4C 26.42 in Abell 1795. . . 89
3.1.1 Introduction. . . 89
3.1.2 New VLBA Observations: data reduction. . . 94
CONTENTS iii
3.1.4 Modelfit results. . . 96
3.1.5 The parsec-scale spectrum . . . 100
3.1.6 Jet dynamics . . . 101
3.1.7 The physical conditions at equipartition . . . 102
3.1.8 Discussion on the parsec and kpc scale radio morphology. . . . 104
3.2 Hydra A in Abell 780. . . 107
3.2.1 Introduction. . . 107
3.2.2 The radio structure. . . 107
3.3 3C 84 in Abell 426 (Perseus Cluster). . . 113
3.3.1 Introduction. . . 113
3.3.2 The radio structure. . . 116
4 The comparison sample: BCS 125 4.1 The aim of the BCS study. . . 125
4.2 The Sample. . . 126
4.3 New observations and Data Reduction. . . 131
4.3.1 VLBA Observations at 5 GHz . . . 131
4.3.2 VLBA Observations at 1.6 GHz . . . 133
4.4 Notes on sources. . . 137
4.4.1 Sources of special interest . . . 137
4.4.2 Notes on other observed sources. . . 148
4.5 Results for the BCS sample. . . 186
4.5.1 Source Morphology . . . 186
4.5.2 Missing flux in parsec scale structures . . . 190
4.5.3 Jet velocity and orientation . . . 191
5 Conclusions 193 5.1 BCG versus BCS sample. . . 193
5.2 Jet velocity for one sided structures. . . 195
5.3 Jet velocity for two-sided structures. . . 195
5.4 Mildly relativistic jets: how to produce them? . . . 198
5.4.1 The jet propagation model of Rossi et al. 2008. . . 198
5.4.2 Dense surrounding medium in cool core clusters. . . 202
Appendix 207
Bibliography 213
Abstract
The aim of this PhD thesis is the study of the nuclear properties of radio loud AGN. Multiple and/or recent mergers in the host galaxy and/or the presence of cool core in galaxy clusters can play a role in the formation and evolution of the radio source. Being a unique class of objects (Lin & Mohr 2004), we focus on Brightest Cluster Galaxies (BCGs). We investigate their parsec scale radio emission with VLBI (Very Long Baseline Interferometer) observations. From literature or new data , we collect and analyze VLBA (Very Long Baseline) observations at 5 GHz of a complete sample of BCGs and “normal” radio galaxies (Bologna Complete Sample , BCS). Results on nuclear properties of BCGs are coming from the comparison with the results for the BCS sample.
The Chapters of this thesis are organized as follows:
• In the Introduction, Chap. 1, we give an overview of general properties of BCGs. Morphological types, position in the cluster, radii and surface brightness, stellar population, emission line and Fundamental Plane are for example presented in details. We summarize also the principal theories (cooling flow, galactic cannibalism and galaxy merging) on the origin of these objects. Finally, we describe how BCGs are special sources in radio band and we discuss their role in the cooling flow problem.
• In Chap. 2, we define a complete sample of BCG selecting all BCGs in nearby Abell clusters (distance class <3). No constraints on cluster conditions and/or BCG radio power are imposed. We report notes for all 27 source of the sample discussing new VLBA observations for 23 of them. We present statistical results on their parsec scale morphology. Finally, we define an extended sample of BCGs. The main results from this Chapter can be also found in Liuzzo et al. 2010.
• In Chap. 3, we analyze three peculiar BCGs of our sample that lie in cool core clusters: 4C 26.42 in Abell 1795, Hydra A in Abell 780 and 3C 84 in Perseus cluster (Abell 426). In particular, for 4C 26.42 we present multiepochs new VLBA observations at 1.6, 5, 8.4 and 22 GHz. We study its parsec scale structure and spectrum, its jet dynamics and we discuss the parsec and kpc scale morphology. The main results for this source can be also found in Liuzzo et al. 2009a.
• In Chap. 4, we present the BCS sample, a comparison sample for our BCG study. This sample is unbiased with respect to the orientation of the nuclear relativistic jet being selected at low frequency. It is composed by 94 sources. In Giovannini et al. 2005 VLBI observations for an initial group of 53 sources having bright nuclear emission are discussed. Here we present new VLBA observations at 5 GHz for 26 radio galaxies with a core flux density S5GHz > 5
mJy, 23 of them observed for the first time at mas resolution. We also present new VLBA observations at 1.6 GHz for 10 radio galaxies in order to study their extended nuclear emission. For all sources we report parsec-scale observations and discuss in detail their structures and properties. The main results from this chapter can be also found in Liuzzo et al. 2009b.
• In the Conclusions, Chap. 5, we compare results obtained from the study of BCG and BCS sample on their parsec scale radio emission. We present preliminary conclusion to explain the different nuclear properties found for BCG to respect “normal” properties. The main results of this chapter is also shown in Liuzzo et al. 2010.
• In the Appendix, we report some information on the VLBI technique and VLBA instrument from which our data set derives and we specify the definition of the core dominance and the jet sidedness used through our work.
Chapter 1
General properties of Brightest
Clusters Galaxies (BCGs)
1.1
Observational properties.
1.1.1 Morphological types.The most extensive morphological classification of Brigthest Cluster Galaxies (BCGs) is from the catalog of Struble and Rood (1984). Upon examining luminosity distributions, it is found that BCGs are generally distributed into three morphological types: gE (giant ellipticals), D and cD. A normal elliptical is represented by a smooth set of surface photometric profiles. On the low mass end of the sequence these profiles are exponential in shape (Binggeli, Sandage and Tarenghi 1984).On the high mass end these profiles become approximately r1/4 shaped. The
transition from exponential to power-law is smooth and a template profiles for ellipticals is avalaible in Schombert (1987). In a normal elliptical sequence, gE are the most luminous. They are a natural extension of the elliptical sequence, being roughly r1/4 in appearance, and lie on the same fundamental plane of structural
and kinematic properties (Djorgovski & Davis 1987) as normal ellipticals. On the other hand, the D class galaxies, similar in luminosity, size and mean surface brightness as gE’s, display special properties with respect to normal ellipticals on the fundamental plane. For example, their surface brightness profiles are more extended at a characteristic radius than normal ellipticals causing a shallower profile slope. The cD class is recognized by D-like interiors plus a large, low surface brightness (µ = 26 to 27 mag arcsec−2) envelope (Oemler 1976). All three types are shown in Fig.
1.1 where a surface brightness profiles for the four classes of normal elliptical, giant elliptical, D and cD galaxies are reported.
Figure 1.1: Surface brightness profiles (Tonry 1987) for the four classes of BCGs: normal elliptical, gE, D and cD. For more details and discussion on arrows, dotted line and tangent lines see Tonry 1987.
Individual examples of surface brightness profiles of all these morphological classes can be found in Schombert (1987). Most notable of these examples are some “classical” cD galaxies, such as the BCG in A2029, which, although being a very large D galaxy, does not have the extended envelopes that associates it with the cD class. Extreme cD examples are seen with the BCG in A1413 (Lenv = 7 ×
1011 L
¯ where Lenv is the luminosity of the envelope and L¯ the solar luminosity)
(Fig.1.2) and with the BCG in the southern cluster Shapley 8 (Lenv = 2 × 10¹² L¯).
Homology merger theory (Hausman & Ostriker 1978) predicts that cD galaxies should have depressed central surface brightnesses; however, as noted by Oemler (1976), most D and cD galaxies have high central surface brightnesses (central refers to the inner 2 kpc, not a core value). Nonetheless, there does exist a sub-sample of cD galaxies with depressed central surface brightness (e.g., A85 and NGC 6166, Schombert 1987 ). These objects are rare, but it is interesting to note that most are associated with emission lines, IR emission and other evidence of recent star formation in their cores.
Several characteristics are common to BCGs evidenced through comparison of their surface brightness types. The first is that almost all BCGs are of the D or cD class. This is true for poor clusters (Thuan and Romanishin 1981) as well as rich clusters (Schombert 1987).
1.1. OBSERVATIONAL PROPERTIES. 3
Figure 1.2: Deep optical imaging of the cD cluster Abell 1413 from Feldmeier et al. (2002).
The left panel shows the full 10 00 × 1000 view of the cluster, while the right panel shows
a close up of the clusters once a smooth elliptical fit to the cD cluster envelope has been removed. The oval shows the radius inside which the model has been subtracted.
1.2.1.1 cD galaxies.
It is important to note that not all D or cD galaxies are BCGs; however, no D or cD type galaxies have been found in the field despite an extended search of bright, field ellipticals from redshift surveys (Schombert 1987). Moreover, they are all positioned on local cluster density enhancements (Beers and Geller 1983).
The enormous size of their extended envelopes implies that the outer regions must be strongly influenced by the cluster potential and that they reflect the dynamics of the cluster orbits rather than the kinematics of underlying galaxies (Dressler et al. 1979). Information about the cD envelope yields knowledge of the cluster potential near the center of rich cluster. In fact, a correlation (Fig.1.3) between Lenv and the richness of the cluster NAbell exixts (Schombert 1988). It
is a direct measure of the depth of the cluster potential and a strong indicator that cD envelopes are directly linked to the evolution of the cluster potential. Of course the reverse situation must also considered; cD envelopes induce more rapid cluster evolution and, thus, the envelope itself may be responsible for the high X-ray luminosity and deeper potential (Schombert 1988).
A weak correlation between the luminosity of the cD envelope Lenv and the
luminosity of the underlying galaxy Lgal is also found (Schombert 1988). This
suggests a parallel process between cD envelope formation and the growth of the parent elliptical (Fig. 1.3).
Figure 1.3: On the top: Envelope luminosity Lenv versus cluster richness represented
by galaxy counts NAbell. The solid line indicates the predicted relation from models of
Malumuth and Richstone 1984. Solid symbols are for regular clusters and open one for
irregular clusters (Schombert 1988). In the center: Total cluster X-ray luminosity LX
versus luminosity of the envelope Lenv (Schombert 1988). On the bottom: The luminosity
of the underlying galaxy Lgal versus the luminosity of the cD envelope Lenv in solar unit
1.1. OBSERVATIONAL PROPERTIES. 5
1.1.2 Position in the cluster.
BCGs are located at cluster centers (Matthews, Morgan & Schmidt 1964) and they are located at the peak of the cluster X-ray emission (Rhee & Latour 1991). In Fig. 1.4 is reported the X-ray optical study of 26 Abell Clusters at redshift < 0.1 made by Rhee and Latour (1991). They found a very good agreement between the centroid of X-ray emission and the position of the BCG. This result is an important issue to analyse whether the BCG are at rest in the center on the potential well of the cluster. Oegerle and Hill (2001) concluded that, in the velocity space, BCGs typically sit near the rest frame of the clusters.
Figure 1.4: Histogram taken from Rhee & Latour (1991) of the difference (in Mpc) between the center of X-ray emission of the cluster and the position of the corresponding BCG of 26 nearby Abell Clusters (see text).
1.1.3 Radii and Surface brightness.
Being essentially gE, D and cD galaxies, the most striking characteristic of the BCGs is their enormous extent (>100 kpc, see Fig. 1.1). Their profiles also display a wide variety of shapes than do the cluster ellipticals. In general, the light distribution of the inner parts is similar to that of a normal giant elliptical. In fact, whether it is physically meanningful or not, Oemler (1976) decomposed these profiles into that of a normal elliptical plus an extended low-surface-brigthness halo. The core radii of BCGs may be compared with those of normal galaxies, like it is made in Fig.1.5, where the BCGs are plotted as crosses.
Figure 1.5: From Oemler (1976): The log of the core radii of galaxies (in kpc) versus their absolute reduced magnitudes. Crosses represent BCGs, filled and open circles indicate galaxies listed in Oemler (1976)
The first comparative study of the structure of giant ellipticals and cD galaxies was by Oemler (1976), which concentrated on the differences between BGCs and the normal ellipticals in nearby clusters.
One of the first surface photometry survey of nearby elliptical galaxies was done by King (1978), who measured the surface brighteness profiles of 25 ellipticals. Kormendy (1977) interpreted King’s profiles by fitting the r1/4 law de Vaucouleurs
(1948) to the data. The r1/4 law is expressied as
Log I = Log Ie - 3.33 [(r/re)1/4 -1]
where re is the effective radius (defined as the radius which contains one half of the
total light of the galaxy) and Ie is the surface brightness (in intensity units) at re.
In order to better describe the envelopes of ellipticals, Oemler (1976) fitted surface brighteness profiles to an exponentially truncated Hubble law of the form
I = I0e
(r/α)−2
(r + β)2
where α describes the exponential falloff and β is the Hubble law core radius. I0 is
the reduced intensity ( a number which represents a core-independent and envelope -independent parameter describing the power-law section of a galaxy profile) and it is related to the Hubble law central surface brigthness, S0, by I0=S0β2. Recent
1.1. OBSERVATIONAL PROPERTIES. 7
results of Gonzalez et al. 2005 demonstrate that the Sersic profile r1/n provides a
dramatic improvement relative to the r1/4 profile.
A survey of BCGs in poor clusters was completed by Thuan & Romanishin (1981). They found that BCGs in poor clusters are missing the extended envelopes discovered by Oemler (1976) and they tend to be brigther amd more diffuse than giant ellipticals in rich cluster. They deduced that, because of the lack of envelopes in poor clusters, the origin of the envelopes in rich cluster is a result of stripped matter falling onto the centrally located cD galaxy. On the other hand, the merger rate of galaxies in poor clusters should be higher than the rate in rich clusters because of the lower velocity dispersions. A higher merger rate could also be one possible explanation for why poor cluster cD galaxies are more diffuse than a typical giant ellipticals.
Concerning the nature of this excess luminosity at large radii, Schombert 1987 argued that the extended light is physically distinct from the central galaxy. In this picture, the excess light component is thought to arise from a population of intracluster stars produced by the tidal stripping and disruption of cluster galaxies (Dressler et al. 1979). Simulations predict that this intracluster light (ICL) is composed of old stars that are dynamically distinct from the stars in the BCG (Murante et al. 2004) and this production of intracluster stars is an ongoing process (Willman et al. 2004). If correct, this model implies that the properties of the ICL, including its fractional contribution to the total cluster luminosity and its spatial distribution, are sensitive probes of the physical processes that drive cluster formation and the evolution of cluster galaxies.
1.1.4 Size-luminosity relation.
The size and luminosities of elliptical galaxies have been shown (Fig. 1.6) to obey the proportional scaling with an exponent α∼0.6 (Bernardi et al. 2003a, 2003b, 2003c, 2003d, 2007). However, at the massive end, this relation steepens (Lauer et al. 2007).
Bernardi et al. 2007 argue this steepening is caused by an increasing fraction of BCGs, which have larger radii compared with the elliptical galaxies. Desroches et al. 2007 find the steepening is not solely attributed to contamination from a population of galaxies with intrinsically larger radii (BCGs).
Figure 1.6: From results of Bernardi et al. 2007 : BCGs define steeper size-luminosity relation (symbols) than does the bulk of the early-type galaxy population (solid line). Open diamonds and filled circles represent BCGs with spiral and E/S0 morphologies, respectively.
Von der Linden et al. 2007 demonstrate that BCGs are larger than non BCGs at all luminosities or stellar masses. Symmetric linear fits to the individual data points yield very similar exponents for the radius−luminosity relation for the BCG sample and the comparison sample. They found α =0.65±0.02 for the BCG sample and α =0.63±0.02 for the non-BCG sample. However, they also find that the relation displays curvature, i.e. it steepens with luminosity. The range of α that they found is broadly consistent with that of Desroches et al. 2007. Thus, they do not find the significantly steeper relations claimed by Bernardi et al. 2007 and Lauer et al. 2007. The problem concerning the steepening is open. Von der Linden et al. 2007 speculate that one possible source for the discrepancy could be the different definitions of size used in the different studies. Moreover, they show that both these samples of BCGs are contaminated by BCGs. Such contamination from non-BCGs is likely to be most important at lower luminosities, and will thus mimic a steeper slope.
1.1. OBSERVATIONAL PROPERTIES. 9
1.1.5 Ellipticity.
The majority of BCGs are round (Fig.1.7) as the non-BCGs sources (von der Linden et al. 2007) , with axis ratios typically b/a> 0.8.
0.8 1 2 4 6 8 10 0
0.05 0.1 0.15
Figure 1.7: From von der Linden et al. 2007; distribution of axis ratio. Blue histogram is for BCG sample and red one represents non- BCG sample.
It should be noted, however, that Porter et al. 1991 found that the ellipticity of BCGs increases (Fig. 1.8) as a function of the radius at which it is measured.
Figure 1.8: Ellipticity of BCGs as a function of the radius at wich it is measured (Porter et al. 1991).
1.1.6 Dynamical mass.
The larger radii and higher velocity dispersions of BCGs imply that they have larger dynamical-to-stellar mass ratios than non-BCGs. The dynamical mass Mdyn,50
within R50 (radius containing 50 per cent of the Petrosian flux) can be derived via
a projection of the scalar virial theorem on to observable quantities: Mdyn,50 = c2
σ2
vR50
G
where c2 depends on the profiles of both the dark matter and the luminous matter
components. If the dark matter follows an NFW profile (Navarro, Frenk White 1997), and the luminous matter a Hernquist (1990) profile, then c2= (1.65)2
(Padmanabhan et al. 2004). Results of von der Linden et al. 2007 find that the ratio of dynamical mass to stellar mass is indeed considerably larger for BCGs (Fig. 1.9).
Figure 1.9: From von der Linden et al. 2007: The ratio of dynamical mass to stellar mass
(within R50) for the BCGs (red) and the comparison sample non-BCGs (black). They
have assumed that c2= (1.65)2.
This difference is likely the consequence of the position of BCGs at, or near, the centres of galaxy clusters. As a result, there is a greater contribution from the dark matter halo to the dynamical mass of the BCG.
1.1.7 The Fundamental Plane.
Early-type galaxies seem to be well described by a two-parameter set of equations, as is evidenced by the Fundamental Plane: they lie on a plane in a coordinate system defined by the logarithmic values of velocity dispersion σv, effective radius
and average surface brightness within the effective radius (Djorgovski & Davis 1987). The plane is typically expressed as :
1.1. OBSERVATIONAL PROPERTIES. 11 2.2 2.4 2.6 -5.6 -5.4 -5.2 -5
Figure 1.10: From von der Linden et al. 2007: Projection along the Fundamental Plane BCGs (red) and the non-BCGs galaxies (black). The dashed lines show the respective best fit for a, keeping b= 0.8 .
While there is agreement that b∼ 0.8, the parameter a is dependent on filter bands and it may also be sensitive to a variety of selection effects and the precise definitions of σv, Re and Ie. Typical values of a∼1.2 - 1.6 are quoted in the literature (Bernardi
et al. 2003c). Fig.1.10 represents the projection along the Fundamental Plane BCGs (red) and non-BCGs (black). The dashed lines show the respective best fit for a keeping b=0.8. For the BCGs, a is significantly larger, indicating that BCGs do not lie on the same Fundamental Plane of ‘normal’ ellipticals. It is interesting to note that predominantly the small, low velocity dispersion BCGs deviate from the generic Fundamental Plane.
The Fundamental Plane relation is essentially an expression of the virial theorem. The deviation of the observed Fundamental Plane from the theoretical one ( a= 2 and b= 1 ) is referred to as the ‘tilt’ of the Fundamental Plane. If we define
M∗ = c1L and L = 2 πI50R50
the tilt implies that [(c2/c1) (M∗/Mdyn,50)] varies for different elliptical galaxies. The
proportionality constant c1 is an expression of the stellar mass-to-light ratio and
of both the luminous and the dark matter components. If c2 were constant, elliptical
galaxies would be structurally homologous systems. There are contradictory results in the literature as to whether it is predominantly non-homology or variation in L/Mdyn,50 that is responsible for the tilt of the Fundamental Plane. Linden et
al. 2007 found that (L/(Mdyn,50/c2)) varies little. This implies that the BCG
Fundamental Plane is closer to the expectations of the virial theorem ( a= 2 and b= 1 ). Moreover, it is for low-mass galaxies that BCGs differ most from non-BCGs. The similarity between BCGs and non-BCGs at high stellar masses implies that the process(es) which cause this ratio to be approximately constant for BCGs also apply to massive non-BCGs. Possibilities include assembly history (e.g. the influence of the orbital elements during dissipationless mergers (Boylan-Kolchin et al. 2006) , and the fact that both BCGs and massive galaxies in general are found in dense environments (Kauffmann et al. 2004).
BGCs define a tight correlation between luminosity and dynamical mass ∝ Reσ2
although this correlation is slightly steeper than it is for the bulk of the early-type population ( Fig. 1.11). This, with the steeper Re-L relation, implies that they
define a shallower σ-L relation than the bulk of the population (Fig. 1.12). These scaling relations are altered even for objects that are well described by classical de Vaucouleurs profiles . These changes to the scaling relations are consistent with previous and recent work based on smaller samples of local BCGs (Malumuth & Kirshner 1981, 1985; Oegerle & Hoessel 1991; Lauer et al. 2007). The change in slope of the σ−L relation may be related to studies of curvature in the Mbh−σ
relation. This is because the most massive galaxies are expected to host the most massive black holes. This expectation is based on the strong and tight correlation between Mbh and the velocity dispersion σ of the spheroid/bulge that surrounds it:
roughly Mbh∝ σ4 (e.g., Ferrarese & Merritt 2000; Gebhardt et al. 2000; Tremaine et
al. 2002 ). Note that Mbh also correlates with the luminosity of the bulge, although
this correlation is not as tight (Magorrian et al. 1998). 1.1.8 Faber−Jackson relation.
Several studies suggest that BCGs follow a different relation between luminosity and velocity dispersion than less massive elliptical galaxies (Oegerle & Hoessel 1991; Bernardi et al. 2007; Lauer et al. 2007). Parametrizing this relation as L∝σβ, the
1.1. OBSERVATIONAL PROPERTIES. 13
Figure 1.11: From Bernardi et al. 2007: correlation between dynamical mass Reσ2 and
luminosity in the bulk of the early-type population (straight solid line) and in the BCG sample (dashed line). Filled circles represent objects that are well described by a de Vaucouleurs profile, and open triangles represent objects that are not. The jagged solid line shows the median value as a function of L. BCGs define a slightly shifted and even
tighter correlation between dynamical mass Reσ2 and luminosity than does the bulk of
the early-type galaxy population (inset).
canonical value is β= 4 , assuming that [(c2/c1) (M∗/Mdyn,50) (1/I50)]= d is constant
and R50=(1/2πG)dσ2v. Most measurements reported in the literature are consistent
with β∼ 4 (e.g. Bernardi et al. 2003b ). However, for samples of BCGs (Oegerle & Hoessel 1991) and very massive galaxies (Lauer et al. 2007) , it is found that β>4 , i.e. σ increases less steeply with luminosity than predicted by the standard Faber−Jackson relation.
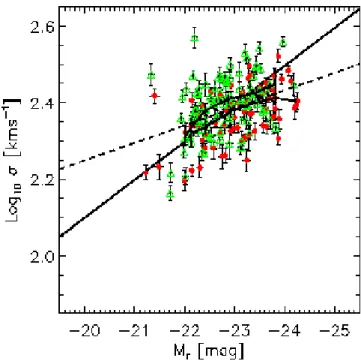
In Fig. 1.13, it is plotted the Faber−Jackson relation for the BCGs and non-BCGs. Linear fit works both for the BCGs and non-BCGs samples. The slope is compatible with the standard L∝σ4 relation for non-BCGs and σ rises less steeply
with luminosity for BCGs (von der Linden et al. 2007). The bottom panel of 1.13 shows that β changes with luminosity, result confimed also by Desroches et al. 2007. Boylan-Kolchin et al. (2006) found that in simulations of dissipationless mergers, β increases with the eccentricity of the merger orbit. They also argue that BCGs
Figure 1.12: From Bernardi et al. 2007: the σ-L relation of BCG sample (filled circles represent objects that are well described by a de Vaucouleurs profile, and open triangles represent objects that are not), which appears to flatten at high luminosities. This
flattening may be related to studies of curvature in the Mbh−σ relation. Straight solid
and dashed lines show linear fits to this relation for the early-type galaxy population and for this BCG sample, respectively. Jagged solid lines show the median value as a function of L for objects that are (lower line) and are not (upper line) well fitted by a single de Vaucouleurs profile.
are expected to form through anisotropic merging due to the filamentary structure surrounding galaxy clusters.
Von der Linden et al. 2007 calculated β in function of the cluster mass according to cluster velocity dispersion. They found that β is larger for BCGs in more massive clusters. If the scenario put forward by Boylan-Kolchin et al. (2006) is correct, this might imply that the merger orbit eccentricity increases with cluster mass. Another explanation might be that the number of (dissipationless) mergers is larger for BCGs in more massive clusters.
1.1.9 Stellar populations.
The stellar populations of the BCGs are old (von der Linden et al. 2007), as is generally found for galaxies in this mass range (Kauffmann et al. 2003).
1.1. OBSERVATIONAL PROPERTIES. 15 200 300 400 -21 -22 -23 -24 3 4 5 6 7 8
Figure 1.13: From von der Linden et al. 2007: In the top panel, there is represented the FaberJackson relation for BCGs (red) and for the comparison sample of non-BCGs. The dashed lines show the best linear fits to the relations. In the bottom panel, there is plotted
the variation of β with Magnitude r Mr. The dashed line shows the subset of these BCGs
located in clusters with cluster velocity dispersion σv,cl > 400 km s−1, the dashdotted line the subset of BCGs in clusters with σv,cl < 500 km s−1 . The typical error bars are displayed on the left.
(Thomas et al. 2003). The BCGs have a systematically higher [Mgb/<Fe>] value than non-BCGs, like shown in a Fig. 1.14.
However, this index is known to correlate strongly with velocity dispersion, so this result is not independent of result that BCGs have systematically larger velocity dispersions. Considering [Mgb/<Fe>] as a function of velocity dispersion, for the BCGs this ratio is systematically higher than in non BCGs (von der Linden et al. 2007). Higher [α/Fe] ratios can be interpreted as an indication that star formation in the galaxy occurred over a shorter time-scale (Granato et al. 2004).
0.8 1 2 4 6 8 10 0
0.05 0.1 0.15
Figure 1.14: From von der Linden et al. 2007: Distributions of the alpha-to-iron index Mgb/Fe for BCG sample (red histogram) and non-BCG sample (black histogram).
1.1.10 Emission line properties.
The strengths of the four emission lines Hα, Hβ, [O III](λ5007˚A) and [N II](λ6584˚A) are commonly used to classify galaxies according to whether their emission-line luminosity is driven by star formation or AGN activity (Baldwin, Phillips & Terlevich 1981). The emission lines in BCGs are in general weaker than in non-BCGs and it is particularly the high-mass non-BCGs in which the emission-line strength is suppressed compared to the non BCGs (von der Linden et al. 2007).
Edwards et al. 2007 found that the presence in a cooling flow is higly correlated with the presence of emission lines in BCG. In fact, looking at cluster velocity dispersion (a proxy for dynamical mass) as a function of the bolometric X-ray luminosity, most of the cooling flow clusters have larger X-ray luminosities for their mass, and these clusters are these that have a BCG with line emission. However, in non -cool core clusters, the fraction of emission-line BCGs is low. Hence, this trend is quite different from what is seen in non-BCGs, where almost all of the emission-line galaxies are fainter than Mk= −25 .
1.1. OBSERVATIONAL PROPERTIES. 17
Emission line properties in BCGs in cool core clusters.
Central galaxies of cooling flow clusters have long been known to show luminous line emission, spatially extended in filaments spread over the central 5−60 kpc of the cluster core (e.g. Hu et al. 1985; Johnstone et al. 1987 ; Heckman et al. 1989 ). The presence of such line emission is dependent on the cluster properties: large line luminosity extended emission-line regions are found in clusters with high cooling flow rates (Johnstone et al. 1987, Allen 1998 ), and so far such systems have not been found around BCGs in non-cooling flow clusters. Line emission is not, however, ubiquitous in BCGs contained in strong cooling flows (e.g., A2029, A2063 (Crawford et al. 1999) . The emission-line systems tend to be associated with those BCGs which contain a central radio source (Heckman et al. 1989; Crawford 1995) , though again not exclusively (e.g., A1060).
Moreover, only the cooling flow nebulae with a high line luminosity [L(Hα)> 1041ergs−1] are accompanied by an excess ultraviolet/blue continuum (Jonstone,
Fabian & Nulsen 1987). Both the line emission and the blue light are extended on scales of 5−60 kpc, and are seen to be spatially coincident from the flattening of the radial gradient of the Mg2 spectral index within the emission-line regions (Cardiel
et al. 1998). The morphology of the blue light also seems (in the few cases imaged) spatially related to that of the contained radio source (McNamara & O’Connell 1993; McNamara 1995; Sarazin et al. 1995b; McNamara et al. 1996a; McNamara 1997). The ultraviolet continuum has been successfully ascribed to massive young star formation, from both the spectra (once intrinsic reddening has been corrected; (Allen 1995) ) and from high-resolution images (McNamara et al. 1996, Pinkney et al. 1996). The line ratios observed in these systems have strong Balmer lines relative to forbidden lines such as [O III], [N II] and [S II] (Crawford et al. 1999). A good relation is found between the observed Hα luminosity (again corrected for intrinsic reddening) and that derived from photoionization by the O stars which is predicted to be present from the stellar fit to the dereddened continuum (Allen 1995). Detailed modelling of the BCG spectra (Johnstone & Allen 2002) indicates that the ionizing fluxes required to produce the emission-line ratios and luminosities observed in these systems can be fully accounted for by the observed O-star populations (assuming very hot stars, with T> 40 000 K, and a low mean ionization parameter, U∼4) in a high-metallicity environment (about solar; see also Filippenko & Terlevich 1992
and Allen 1995). Together with the spatial correspondence of the blue light and line emission (Cardiel et al. 1998) , it seems that the most line-luminous cooling flow nebulae are powered by a population of massive hot stars.
Large masses of X-ray-absorbing material are detected in the spectra of cooling flow clusters (White et al. 1991; Allen & Fabian 1997) , indicating that cold clouds can be an end-product of the cooling process. Such clouds might coagulate and condense to form a central reservoir of cold gas. As suggested by the double-lobed blue light morphology of A1795 and A2597, and as hypothesized by several authors (McNamara & O’Connell 1993; Pinkney et al. 1996; McNamara 1997) , the interaction between the outflowing radio plasma and this gas reservoir could induce a massive starburst. The distribution of stellar types inferred is weighted to lower mass stars (Allen 1995) , suggesting that such a starburst is triggered at irregular time-scales. Those galaxies requiring an excess population of just O stars (e.g., those in A291, Z3146, Z8276) may only have one very recent such starburst, whilst others may have aged such that few O stars remain. This scenario predicts that the very luminous systems are created by the combination of a central radio source and a surrounding mass of cold clouds accumulated from the cooling flow both a common consequence of a rich (but non-binary) cluster environment. Thus it is possible a central radio source will not induce star formation and luminous line emission unless the cooling flow has accumulated a reservoir of cold gas. Hence any BCG in a cooling flow cluster that contains a strong radio source, yet no optical anomalies, should also lack evidence for intrinsic absorption in the cluster X-ray spectrum.
The variation in the properties of the cooling flow nebulae form a continuous trend with line luminosity implying a gradual change in the dominance of ionization mechanism (Crawford et al. 1999). The cooling flow galaxies with a lower luminosity emission-line region have stronger forbidden line emission to Balmer line emission ratios (([N II]/Hα)∼2.4 and ([S II]/Hα)∼1, but [O III]/Hβ showing a large spread). Such line intensity ratios are traditionally difficult to explain, and require a steeper ionizing spectrum over 13.6−100 eV than can be produced by the O stars present in the higher luminosity systems.
Edwards et al. 2007 investigated also the dependence of line emission with the location of BCG in the cluster with the distance to the X-ray centre. Some BCGs
1.1. OBSERVATIONAL PROPERTIES. 19
are found close to the X-ray centre, while others can be found several hundred kpc away. In particular, all of the strongly emitting BCGs are within 50 kpc of the X-ray centre. Moreover, these emitting galaxies are also usually found in a cooling flow cluster. They concluded that only those BCGs that are close to the X-ray centre have significant line emission.
Edwards et al. 2007 tried also to correlate line emission of the BCG with the cluster mass, but no trend is found. However, they observed a clear correlation with the emission-line fraction decreasing with increasing number density, and so BCGs are less likely to show emission lines if they are found in the densest regions of clusters. The fact that it is observed an enhanced emission for those galaxies within the smaller 50-kpc scale of the X-ray centre of cooling flow clusters is therefore likely related directly to the presence of cooling, X-ray gas on small scales, rather than the overall gravitational potential.
1.2
Theories on the origin of BCGs.
BCGs appear to be quite homogenous being big, bright and with remarkably small dispersions in absolute aperture magnitudes compared to the other early-type cluster galaxies (∼0.3 mag, Collins & Mann 1998, Aragon-Salamanca et al. 1998). Therefore, they may be used as standard candles out to large distances. Their attractiveness as standard candles increases if their nature is understood. Photometric galaxy surveys semm to be necessary to identify large numbers of clusters to bigger redshift. This means that large BCG samples will also become available. If their nature is understood, then the BCGs themselves may provide complementary information about cosmological parameters. For example, the Fundamental Plane relation of BCGs can be used to determine the change in surface brigtheness due to stellar evolution with an accuracy of 25% (assuming no dynamical evolution) (Oergerle et al. 1991). However, the slope of Fundamental Plane for BCGs is steeper (see section 1.1.7) than for normal elliptical galaxies. This is one sign of unusual formation histories of BCGs since they are in the most of cases early-types.
In the ollowing, three major theories on the origin of BCGs are presented. 1.2.1 Cooling Flow.
One model proposed for the origin of BCGs is the star formation from cooling flows expected at the centers of clusters (Fabian et al. 1994). The most massive galaxies observed at z>0.5 have many properties that can be interpreted as due to a surrounding cooling hot medium. Cooling flows therefore must play some part in the formation of the most massive galaxies, i.e. the central cluster galaxies. Indeed, any theory of galaxy formation in which gas falls into potential wells, is heated to the virial temperature, and then cools with the possibility tcool&tgrav (Rees & Ostriker
1977, Silk 1977, White & Frenk 1991) , where tcoolis the radiative cooling time due to
the observed X-rays and tgrav is the gravitational free-fall time, requires cooling flows.
In most hierarchical models for structure formation, mass overdensities begin with tcool <tgrav and form “ normal” stars of which the most massive become supernovae.
The energy feedback from these leaves most of the gas uncooled. The supernova ejecta also enriches the gas in metals. It is then incorporated into the next stage of the hierarchy. Many small perturbations do not proceed beyond this condition and
1.2. THEORIES ON THE ORIGIN OF BCGS. 21
appear as “ normal” galaxies and loose groups. In larger preturbations, however, the total mass increases such that the object passes the cooling flow condition. Massive cooling flow are expected in young clusters and massive groups before they merge to form richer clusters. The exact mass level at which this occurs depends on the role and fraction of any nonbaryonic dark matter.
What happens at this stage can be deduced from studies of nearby cooling flows. The gas is multiphase at all radii and it lays down cooled gas according to M(<) ∝ r, (ρ ∝r−2). Much of the cooled gas is in the form of very cold clouds which
may efficiently form low-mass stars. Star formation may therefore switch from the “normal” IMF (Initial Mass Function) which occured during the early phases of the hierachy (giving to the observed galaxy) to an almost exclusively low-mass mode (Thomas & Fabian 1990). A massive isothermal dark halo is thereby assembled (Thomas 1988). While a cooling flow persists, the IMF of any star formation can only be “normal” for a small fracion of the cooled gas, or massive galaxies would appear even more luminous. The dark mass of the central galaxy is continuing to increase from the cooling flow.
Some process is required in order to account for the upper luminosity of the largest galaxies. These are inferred to occur at the boundary where tcool=tgrav and
some physical process is required to prevent more lumionous galaxies from forming. The role of cooling flows in galaxy formation has also been studied by Ahsmann & Carr 1988, 1991. They investigated the total mass fraction that can be processed through cluster cooling flows and they again argued that is smallunless significant heating occurs due to supernovae at the early stages of the hierarchy.
If giant galaxies are the result of a cooling-flow, observationally one would expect a soft X-ray background from the radiation of the cooling gas, although absorption in cooled gas may reduce the observed flux by large factors. Line absorption of background quasars by the dense cold clouds in the flow may explain some of the many absorption lines commonly seen in the spectra of distant quasars. The hypothesis predicts that massive protogalaxies will be turbolent, extended mass of rapidly cooling hot gas with a massive embedded population of dense cold clouds. The smallest clouds, or clouds fragments, may mix into the hot gas and produce absorption lines of high ionization, whereas the large cloud may be predominantly neutral and create damped Lyα lines. Lines from individual clouds may be narrow
but the spread from all clouds may be up to 1000 km s −1.
If the formation galaxies is due to cooling flow, it is worth taking a careful look at nearby cooling flows to learn how they operate. However, the nearby examples show that much of the action is not directly detectable at visible wavelengths (McNamara & O’connell 1989).
1.2.2 Galactic cannibalism.
Since the realization that close collisions and mergers between galaxies might be common phenomena (Toomre & Toomre 1972) , cD and D galaxies but in general BCGs were widely interpreted as merger products through dynamical friction and tidal stripping. In this theory, the orbits of cluster galaxies are assumed to decay slowly as the orbits of cluster galaxies move through the distributed dark matter that binds the cluster, until their orbital energies are sufficiently low that they can be captured by, and merge with, the “cannibal” at the center. In other words, the most massive objects in any self-gravitating system will gradually spiral towards the bottom of the cluster potential well and lose energy continuously more than less massive bodies. This effect may be viewed as resulting from the attempt of massive cluster members to reach equipartition of energy with the other objects in the part of the cluster they traverse. Under certain conditions the cumulative effect of encounters may be modelled by a frictional force resisting the motion of heavy particles (Chandrasekhar 1943). Such an approach to the problem of two-body relaxation in clusters has the advantage that the orbital evolution of a massive body can be computed relatively easily. In this scenario, bright galaxies spiral to the center of clusters on an equipartion time scale; there are swallowed by a central giant one which becomes BCG.
The galactic cannibalism picture fails when worked out in detail (Merrit et al. 1985, Lauer et al. 1985, Tremaine et al. 1990). In fact, it appears in retrospect that some of the assumption of the early cannibalism models were poorly chosen, and led to rather strong overestimates of the efficiency of this process. The very large growth rates predicted by Hausmann & Ostriker 1978 were based on the assumption that galaxies in clusters are surrounded by massive dark halos. The tidal field resulting from the distributed matter in a cluster is probably sufficiently strong to truncate galaxies almost to their luminous radii (White 1983, Merritt 1984) and N-body
1.2. THEORIES ON THE ORIGIN OF BCGS. 23
simulations of the clustering process suggest that this truncation is nearly complete by the time a cluster has reached virial equilibrium. Moreover, the dynamical friction timescales are generally too long and so the expected amount of accreted luminosity falls short by an order of magnitude for making BCG’s luminosity. At least, the lack of luminosity segregation (i.e. the expected systematic concentration of bright galaxies to the center) is an other argument for which this theory fails. Although it might be argued that cD galaxies themselves are the result of this segregation, it is nevertheless true that the majority of rich clusters contain neither a dominant central galaxy nor any strong evidence of luminosity segregation.
1.2.3 Galaxy merging.
This theory explains the formation of BCGs in a cosmological scenario. In particular, in the hierachical cosmological model, BCGs form through galaxy merging in the early history of the formation of the cluster (Merritt et al. 1985). The strong tendency for BCGs to align with their cluster population (West et al. 1994) seems to be a proof of an origin coinciding with cluster collapse. This model is an attractive one because it predicts for example that the properties of a cD galaxy should be correlated only with its initial (poor cluster) environment, and not necessarily with the properties of the rich cluster that forms later. It also explains why many dense clusters do not contain a dominant central galaxy, even though the time scales for orbital evolution in these clusters are apparently shorter than in other clusters containig cD galaxies. The fact that very bright galaxies sometimes appear in relatively poor environments has been emphasized by White et al. 1978.
According to Dubinski 1998 , most of the work on the formation of giant ellipticals has been based on studies of merging groups of several disk galaxies (Weil & Henquist 1996) or small virialized clusters of spherical galaxies (Bode et al. 1994, Athanassoula et al. 1997). These simulations reveal the high efficiency of dynamical friction in driving merging and the general tendency to produce remnants resembling elliptical galaxies. However, they are phenomenological studies that are still considerably detached from the context of hierarchical collapse in which elliptical galaxies and BCGs probably form.
In this framework, the formation histories of BCGs and ordinary elliptical galaxies are closely linked. Numerical simulations have long predicted that
early-type galaxies, with spheroid-dominated stellar light profiles, are a natural outcome of major galaxy mergers (e.g.,Toomre & Toomre 1972; Barnes & Hernquist 1996; Naab & Burkert 2003). However, both the timing and nature of the violent assembly of early-type galaxies remain frustratingly unclear. Look-back studies have recently become large enough to demonstrate a steady growth in the total stellar mass in the red-sequence galaxy population since z ∼ 1 (e.g. Bell et al. 2004b; Faber et al. 2006). The majority of these red-sequence galaxies are morphologically early type out to at least z ∼ 0.7 (Bell et al. 2004a). Indeed, recent works have confirmed a growth in the total stellar mass in morphologically early-type galaxies from z ∼ 1 to the present day (Cross et al. 2004; Conselice et al. 2005). Interestingly, relatively few blue galaxies bright enough to be the star-forming progenitor of a massive non-star-forming early-type galaxy are observed (Bell et al. 2004b; Faber et al. 2006). Thus, it has been suggested that mergers between non-star-forming early-type galaxies may occur (so-called “dry mergers”) and build up the massive early-type galaxy population (Bell et al. 2004b; Faber et al. 2006). Such mergers are observed at least in clustered environments (van Dokkum et al. 1999; Tran et al. 2005). Anyway, it is still unclear how important dry mergers are in driving the evolution of luminous, massive early-type galaxies, averaged over all cosmic environments. In fact, understanding why massive early-type galaxies are red and dead has proved to be difficult. The problem is to arrange for star formation to occur at a higher redshift than the actual assembly of the stars into a single massive galaxy. The most recent galaxy formation models arrange for this to happen by a combination of the dry mergers and active galactic nucleus (AGN) feedback (Hopkins et al. 2006; Croton et al. 2006; De Lucia et al. 2006; Bower et al. 2006). The dry merger hypothesis, as explained above, assumes that the assembly of massive galaxies occurs by merging smaller progenitor systems of old stars without additional star formation (which would otherwise lead to bluer colors). This happens either because the merging units were themselves gas poor, or because AGN feedback has prevented the hot gas reservoirs of the progenitors from cooling and forming stars after the merger. Together, these processes allow massive galaxies to be built from smaller systems while still remaining red.
In particular, combining the results that the dominant factor which determined whether or not a galaxy is radio-loud is its mass and that the distribution of
1.2. THEORIES ON THE ORIGIN OF BCGS. 25
radio luminosities was found to be the same regardless of the galaxy mass (Best et al. 2005) with a conversion between radio luminosity and the mechanical energy supplied by a jet to its surroundings (as estimated by Birzan et al. 2004), Best et al. (2006) estimated the time-averaged mechanical luminosity output associated with radio source activity for each galaxy, as a function of its mass. They found that, for elliptical galaxies of all masses, the time-averaged radio heating almost exactly balanced the radiative cooling losses from the hot haloes of the ellipticals. They argued that the radio-AGN feedback may therefore play a critical role in galaxy formation, preventing further cooling of gas on to elliptical galaxies and thus explaining why these galaxies are old and red (see also Benson et al. 2003; Scannapieco, Bower et al. 2006; Cattaneo et al. 2006; Croton et al. 2006).
The dry merger hypothesis is most necessary for the most massive galaxies that tend to be the BCGs in clusters and it is important considering the sizes of these BCGs and the other scaling relations. This is because, in a gas -rich (“wet ”) merger, gas from the merging components is able to dissipate energy, cool, contract, and eventually make new stars (Barnes & Hernquist 1992, 1996; Mihos & Hernquist 1996). Dry mergers, on the other hand, have no energy-loss mechanism (other than dynamical friction); having suffered less dissipation, their stellar components are not as centrally contracted, so the optical sizes of dry merger products are expected to be larger than if the mergers were wet (e.g., Kormendy 1989; Capelato et al. 1995; Nipoti et al. 2003 ), although the sizes may also reflect the orbital parameters of the mergers that formed the BCG (e.g., Boylan-Kolchin et al. 2006).
Other confirmations to this model come looking at the Fundamental Plane relation for BCGs. The Re-L relation of the bulk of the early-type galaxy population
is steeper than the correlation between the half-mass radius and the mass of dark matter halos. This is consistent with models in which galaxies in low-mass halos have suffered more dissipation (e.g., Kormendy 1989; Dekel & Cox 2006 ). If massive galaxies have suffered less dissipation than less massive galaxies, then BCGs have suffered even less dissipation than other massive galaxies of similar luminosities (Bernardi et al. 2007). Although some of the steepening of the Re-L relation
may be due to anisotropic mergers (e.g., Boylan-Kolchin et al. 2006 ), the larger than expected sizes of BCGs also suggest less dissipation, so they are consistent with the dry merger formation hypothesis. In addition, BCGs show a substantially
smaller scatter around the Fundamental Plane defined by the bulk of the early-type population than does the early-type population itself (see section 1.1.7).
This might indicate that the formation histories of BCGs involve less recent star formation than occurs in early-type galaxies of similar mass. Below average recent star formation rates would be consistent with dry merger formation histories. BCGs define the same g - r color-magnitude relation as the bulk of the early-type population (Bernardi et al. 2007).
Hence, if BCGs form from dry mergers, then BCG progenitors must lie redward of this relation (else the product of the merger would lie blueward of this relation). This suggests that BCG progenitors host older stellar populations than is typical for their luminosities and this may provide an interesting constraint on dry merger models (Bernardi et al. 2007).
Evidence of multiple nuclei BCGs.
Laine et al. (2003) used HST to study a sample of 81 giant elliptical galaxies in order to describe their nuclear morphologies. They found that about half of all BCGs have companions, or a secondary nucleus, located within a projected radius of 10 h−1 kpc (H
0= 100 h km s−1 Mpc−1) of the luminosity centre of the combined
system (Hoessel & Schneider 1985). These ‘multiple nuclei’ were at one time taken to be the best evidence for models which postulate that massive galaxies are growing at the centres of rich clusters by accreting their less massive neighbours (Hausman & Ostriker 1978). This is the case of brightest cluster galaxy IC 1695 (Fig. 1.15) in Abell 193 (Seigar et al. 2003). This source revealed a triple-nucleus structure. Even if the chance projection of a background or foreground galaxy falling within a projected radius of 10 h−1 kpc (H
0= 100 h km s−1 Mpc−1) is 10 per cent (Tonry
1984; Hoessel & Schneider 1985) Seigar et al. 2003 studying K band and spectral properties suggest that the three nuclei are gravitationally bound as parts of a common merged, or merging system.
1.2. THEORIES ON THE ORIGIN OF BCGS. 27
Figure 1.15: HST/WFPC2 F814W I-band image of the centre of IC 1695, BCG of A193 (Seigar et al. 2003). The image shows the triple nucleus in the centre of this galaxy.
1.3
Radio loud BCGs.
BCGs have long been recognized to show different radio properties to other cluster galaxies, being much more likely to be radio-luminous (Fig. 1.16) than other non-dominant cluster ellipticals (e.g. Burns, White & Hough 1981; Valentijn & Bijleveld 1983; Burns 1990). Best et al. (2005) showed that the probability of a galaxy to be a radio-loud AGN was dependent primarily upon its mass, determined either as the stellar mass (fradio−loud ∝M2.5? ) , or the black hole mass (fradio−loud ∝M1.6BH.
As discussed by Best et al. (2005) the difference between the slopes of these two relations arises mainly because of the increasing fraction of disc-dominated galaxies, with small black holes, at stellar masses M? 6 1011M¯ . These host fewer radio-loud
AGN, and thus decrease the radio-loud fraction at low stellar masses, leading to a steeper dependence on stellar mass.
Recent results of Best et al. 2007 revealed that BCGs of all stellar masses are more likely to host radio-loud AGN than other galaxies of the same mass. The probability of a BCG hosting a radio-loud AGN scales roughly linearly with stellar mass, which is shallower than the relation for all galaxies. BCGs are an order of magnitude more likely to host radio-loud AGN than other galaxies at stellar masses below 1011M
¯ , but less than a factor of 2 more likely at stellar masses above 5 ×
1011M
¯ . The distribution of radio luminosities of BCGs is independent of the mass
of the BCG, and the same as that determined for other galaxies. In fact, only the normalization of the radio luminosity function changes, not its shape (Fig. 1.16).
Moreover, the fraction of BCGs of a given stellar mass which host radio-loud AGN, and the distribution of their radio luminosities, do not depend strongly on the velocity dispersion of their surrounding group or cluster. This means that because BCGs in the richest clusters tend to be more massive than those in poorer clusters, the fraction of BCGs which host radio-loud AGN still turns out to be higher in more massive clusters, but it is the mass of the BCG, rather than the properties of its surroundings, which controls the likelihood of it being radio-loud.
Very often their radio morphology shows evidence of a strong interaction with the surrounding medium: some BCGs have a wide angle tail structure (WAT) very extended on the kiloparsec-scale , like 3C 465 (Fig. 1.17) in A2634, (Sakelliou & Merrifield 1999), or with small size such as NGC4874 (Fig. 1.18) in Coma cluster, (Feretti & Giovannini 1985).
1.3. RADIO LOUD BCGS. 29 1022 1023 1024 1025 1026 L1.4GHz / W Hz-1 0.001 0.01 0.1 1.0 10.0 100.0
% of gals with radio-AGN brighter than L
NVSS
11.25 < log(M*/Msun) < 11.75 11.00 < log(M*/Msun) < 11.25 10.75 < log(M*/Msun) < 11.00
All galaxies
Brightest cluster galaxies
Figure 1.16: The percentage of galaxies which are radio-loud AGN brighter than a given radio luminosity, for ‘all galaxies’ (black lines) and the subsample of ‘BCGs’ (red lines) in three different ranges of stellar mass. There is no evidence for any significant difference in the shape of the luminosity functions, either as a function of stellar mass, or between BCGs and all galaxies: only the normalization of the relation changes (Best et al. 2007).
Fig. 1.17 reports the radio map overimposed to X-ray emission of the radiosource 3C 465 which is prototype of WAT (Wide Angle Tail) source. The kiloparsec scale jets are asymmetric. Polarization maps confirm that there is no change in jet dynamics with increasing distance from the core (Venturi et al. 1995). X-ray emission is detected from the active nucleus and the inner radio jet, as well as a small-scale, cool component of thermal emission, a number of the individual galaxies of the host cluster (Abell 2634), and the hotter thermal emission from the cluster (Hardcastle et al. 2005).
Fig. 1.18 contains a radio image overimposed to optical one of NGC4874, one of the two dominant galaxies of the Coma cluster. This is an example of BCG with the radio emission completed embedded in the galaxy.
In other cases, BCGs can have diffuse and amorphous sources, either extended (3C 84 (Fig. 1.19) in Perseus cluster, Pedlar et al. (1990)) or with very small size (e.g., the BCG (Fig. 1.20) in A154, Feretti & Giovannini (1994)).
Fig. 1.19 shows radio image oveimposed to X-ray emission of 3C 84 that is one of the brightest compact radio sources in the sky and it has been studied in some detail by several authors (Vermeulen, Readhead & Backer 1994; Taylor & Vermeulen
Figure 1.17: Extended X-ray emission from Abell 2634. The grey-scale shows the 0.5−5.0 keV data from XMMNewton. The object to the north-east is the background cluster CL-37. Superposed are contours of the 5.4-arcsec resolution 1.4 GHz VLA map of 3C 465 at 1× (1, 4, 16, ) mJy/beam (Hardcastle et al. 2005 ).
1996; Silver, Taylor & Vermeulen 1998; Walker et al. 2000). In particular, it is known to undergo bursts of activity (Taylor & Vermeulen 1996) that could also drive the observed shocks and sound waves through the cluster. A clear extended radio structure is visible. The radio lobes are coincident with cavities present in the X-ray emitting gas which is sign of important interaction of the radio plasma with the surrounding medium.
In Fig. 1.20 it is presented the VLA radio map at 1.4 GHz of the BCG if Abell 154 which is double source with linear size of only ∼3 kpc (Feretti & Giovannini 1994).
WAT and amorphous sources are rare in the general radio population, but frequently present in BCGs and in particular in BCGs located in cooling core clusters of galaxies.
1.3. RADIO LOUD BCGS. 31
Grey scale flux range= 4.700 8.700 Kilo Cont peak flux = 7.3642E-04 JY/BEAM Levs = 5.000E-05 * (-1.50, 1, 3, 7, 10, 30, 50, 70, 100) 5 6 7 8 DECLINATION (J2000) RIGHT ASCENSION (J2000) 12 59 40 38 36 34 32 30 27 58 30 15 00 57 45 30 15 00 56 45
Figure 1.18: First Image (contour) of the NGC4874, BCG of A 1656 overimposed to the optical image (colours).
1.3.1 The cooling flow problem.
Radio loud BCGs has been proposed as a potential solution to the cooling-flow problem. Gas in the central regions of clusters of galaxies often has radiative cooling time-scales very much shorter than the Hubble time and, in the absence of a heating source, a cooling flow would be expected to develop, whereby the temperature in the central regions of the cluster drops and gas flows inwards at rates of up to ∼ 1000 M¯ yr−1 (see Fabian 1994, for a review). However, recent XMM-Newton and
Chandra observations of cooling-flow clusters have shown that the temperature of cluster cores does not fall below ∼ 30 per cent of that at large radii, and that the amount of cooling gas is only about 10 per cent of that predicted for a classical cooling flow (e.g. David et al. 2001; Kaastra et al. 2001; Peterson et al. 2001; Tamura et al. 2001). This implies that some heating source must balance the radiative cooling losses, preventing the gas from cooling further.
Figure 1.19: VLA observations at a frequency of 1.4 GHz were combined from in the A, B and C configurations overlay to Chandra X-ray observations of Perseus. The resulting radio image has been restored with a 5-arcsec synthesized beam. Contour levels start at 1 mJy/beam and increase by factors of 2 to just below the peak of 21.7 Jy/ beam.
Heating by radio sources associated with the BCGs has gained popularity in recent years, as X-ray observations have revealed bubbles and cavities in the hot intracluster medium of some clusters, coincident with the lobes of the radio sources (e.g. B¨ohringer et al. 1993; Carilli, Perley & Harris 1994; Fabian et al. 2000; McNamara et al. 2000; Blanton et al. 2001). These are regions where relativistic radio plasma has displaced the intracluster gas, creating a low-density bubble of material in approximate pressure balance with the surrounding medium, which then rises buoyantly and expands. Hydrodynamic simulations have been able to reproduce bubbles with properties similar to those observed (e.g. Churazov et al. 2001; Quilis, Bower & Balogh 2001; Br¨uggen & Kaiser 2002; Br¨uggen 2003) and they have also shown that, provided that radio source activity is recurrent, the total energy provided by AGN activity can be sufficient to balance the cooling radiation
1.3. RADIO LOUD BCGS. 33
Figure 1.20: VLA radio map at 1.4 GHz of the BCG of Abell 154. Contour levels are (-0.16, 0.16, 0.3, 0.5, 0.6, 1.5, 2, 2.5) mJy/beam. The linear size of the double source is ∼3 kpc (Feretti et al. 1994 )
losses through repeated production of jets, buoyant bubbles and associated shocks (e.g. Dalla Vecchia et al. 2004; Br¨uggen, Ruszkowski & Hallman 2005; Nusser, Silk & Babul 2006). Other authors (e.g. Omma et al. 2004; Brighenti & Mathews 2006) have argued that momentum-driven jets are an alternative means of distributing AGN energy throughout the intracluster medium.
Very deep Chandra observations of the Perseus and Virgo clusters (Fabian et al. 2003, 2006) have revealed the presence of approximately spherical weak shock waves in these clusters, extending out to several tens of kpc radius. Fabian et al. (2003) argued that these ‘ripples’ (Fig. 1.21) are excited by the expanding radio bubbles, and that dissipation of their energy can provide a quasi-continuous heating of the X-ray gas (see also Ruszkowski, Br¨uggen & Begelman 2004).
Fujita & Suzuki (2005) and Mathews, Faltenbacher & Brighenti (2006) argued, however, that if all of the wave dissipation occurs at the shock front then too much of the heat is deposited in the inner regions of the cluster, and not enough out at the cooling radius, leading to temperature profiles at variance with observations. Nusser et al. (2006) suggested that a natural solution to this problem is to consider the heating effects of AGN activity from all cluster galaxies, not only BCGs. More recently, Fabian et al. (2006) showed that the shocks occurring in the Perseus cluster are isothermal, meaning that thermal conduction must be important in mediating the shock. They argue that this prevents the accumulation of hot shocked gas in the inner regions, and that the energy of the waves can be dissipated at larger radii
Figure 1.21: Deep-unsharp mask, 0.3–1.5 keV (0.98-arcsec Gaussian smoothed image, with 9.8-arcsec Gaussian smoothed image subtracted) X-ray image of Perseus cluster. Regions brighter than the local average are light; those fainter are dark (Fabian et al. 2003)
by viscous effects.
One critical question for all of these models is whether the heating generated by an episode of radio-loud AGN activity is sufficient, during its lifetime, to offset the radiative cooling losses of the cluster. Viewed in terms of the radio bubbles (which are widely considered to be the driving force behind the shock and sound waves), for some clusters the (pV) energy contained within the evacuated bubbles has been shown to be sufficient to balance the cooling losses, at least for a short period of
1.3. RADIO LOUD BCGS. 35
time (a few ×107 yr ; e.g. Fabian et al. 2003; Bˆırzan et al. 2004; Dunn, Fabian
& Taylor 2005). However, Bˆırzan et al. (2004) showed that this is not true for about half of the clusters they studied (see also Rafferty et al. 2006). Nusser et al. (2006) and others have argued that the mechanical energy injected into the cluster by weak shocks may be up to an order of magnitude larger than pV, which would ease this problem. An alternative possibility is that the heat balance occurs in a quasi-static manner, with recurrent low-luminosity radio activity being punctuated by occasional major eruptions supplying much more energy (Kaiser & Binney 2003). An other important question is what the duty cycle of this AGN activity is. The duty cycle determines the rate of production of radio bubbles, or equivalently, the time-scale between the sound wave ‘ripples’, and hence is required to calculate the time-averaged heating rate associated with AGN activity. Burns (1990) showed that as many as 70 per cent of cD galaxies at the centre of cooling-flow clusters are radio-loud, but this result was based on a sample of only 14 such systems, and not all BCGs are cD galaxies.
Best et al. (2006) also concluded that, unless BCGs showed a different mode of radio activity to that of ordinary elliptical galaxies, then they could not provide sufficient heating to balance the cooling in clusters of galaxies. As discussed above, BCGs are found to be radio-luminous much more frequently than other cluster ellipticals, but the strong mass dependence of the radio-loud AGN fraction found by Best et al. (2005) means that this may solely be due to their very much higher masses.
These results support the argument of Best et al. 2005 that low-luminosity radio-loud AGN activity and emission-line AGN activity are independent physical phenomena. It is argued that the radio-loud activity is associated with the cooling of gas from the hot envelopes of elliptical galaxies and, in the case of central cluster galaxies, also from the intracluster medium. Accretion of hot gas from a strong cooling flow is able to explain both the boosted likelihood of BCGs hosting radio-loud AGN, and the different slopes of the mass dependencies of the radio-AGN fractions for BCGs and other galaxies.
Furthermore either the mechanical-to-radio luminosity ratio or the efficiency of converting the mechanical energy of the radio source into heating the intracluster medium must be a factor of 100−1000 higher in rich clusters than in poor groups in
order that radio-AGN heating balances radiative cooling for systems of all masses. If not, then radio-loud AGN heating either overcompensates the radiative cooling losses in galaxy groups, providing an explanation for the entropy floor, and or falls short of providing enough heat to counterbalance cooling in the richest clusters. Thermal conduction could provide the extra energy required in the richest clusters (Best et al. 2007).