Università degli Studi di Padova
FACOLTA’ DI SCIENZE STATISTICHE
Corso di Laurea Specialistica in Scienze Statistiche,
Economiche, Finanziarie ed Aziendali
T
ESI DIL
AUREAFIRM GROWTH AND PROFITABILITY:
WHICH COMES FIRST?
Relatore:
Prof. Andrea Furlan
Correlatore:
Prof. Adriano Paggiaro
Candidato:
Matteo Sambugaro
INTRODUCTION ...5
1 LITERATURE REVIEW ...7
1.1 One-dimensional approach: “Life-cycle” theory ... 7
1.2 Idiosyncratic approach ... 10
1.3 Multi-dimensional approach ... 11
1.3.1 The growth dimensions ... 12
a) Size growth ... 12
b) Relationship growth ... 12
c) Capability growth ... 13
1.3.2 Relationship growth and Size growth ... 14
1.3.3 Capability growth and Size growth ... 15
1.3.4 Relationship growth and Capability growth ... 16
1.3.5 Size growth, Relationship growth and Capability growth ... 18
2 FIRM GROWTH AND FIRM SUCCESS ...27
2.1 The key to success: “growth first, profitability later” ... 27
2.2 The key to success: “profitability first, growth later” ... 29
2.3 The Resource-based View Approach ... 30
2.3.1 Dynamic capabilities approach ... 32
2.3.2 Knowledge-based View theory ... 33
2.4 The framework proposed by Davidsson et al. (2009) ... 33
3 SAMPLE AND RESEARCH METHODOLOGY ...37
3.1 Objectives ... 37
3.2 Research question ... 37
3.3 Data Sources ... 38
4 ANALYSIS ...43
4.1 The Dependent Variables ... 44
4.2 The Independent Variables ... 45
5 RESULTS ...47 5.1 Employees analysis ... 47 5.2 Sales analysis ... 50 6 DISCUSSION...53 6.1 Major changes ... 55 6.2 Implications ... 56 7 CONCLUSIONS ...59 BIBLIOGRAPHY ...61 APPENDICES ...71
Appendix A: Theory of alliance formation ... 71
Appendix B: Critiques of the Resource-based View theory ... 73
Appendix C: Dataset’s descriptive statistics ... 75
INTRODUCTION
This thesis talks about the relationship between firm growth and firm performance.
A growing firm is almost universally considered as a successful company. Before the financial crisis in 2008, this common belief was shared amongst researchers, practitioners and policy-makers alike. Growth was considered a key factor in order to obtain above-average performances. The recent financial crisis -just to mention the most recent evidence- has however shown that high growth might also create numerous problems and challenges.
The instability that followed -and somehow still follows- the crack of Lehman Brothers in September 2008, has lead, amongst all the rest, to re-evaluate the relationship between firm growth and firm success.
Before the financial crisis, most businesses could coast along and rely on their credit lines to make up for shortfalls in sales. The goal was in most cases to grow. For the firm, slumping quarterly revenues and rising expenses could be carried forward by financial wizardry and leveraging a balance sheet.
While the lessons of doing business without credit and cutting expenses to the bone have been (hopefully) learned, how can one grow a business back to where it was and forward after the financial crisis? What is the best strategy to follow?
In trying to answer these questions, it is important to note that the financial crisis is not the sole responsible for poor firm performances. This thesis suggests the cause is more likely to lie in company strategy. In fact, who blames the financial crisis and the economic slowdown for poor performances should consider that even in good times just 1 out of 10 firms reaches high performances (Zook and Rogers, 2001).
The research question this thesis tries to answer is therefore the following: What is the
best strategy to achieve high overall firm performance?
The thesis is organized as follows.
are discussed: the “One-dimensional” approach, the “Idiosyncratic” approach and, lastly, the “Multi-dimensional” approach.
Chapter 2 examines the issue of profitable growth. Past literature review suggests that value of growth for the success of firms is viewed in two conflicting ways. On the one hand, the first perspective maintains that firm growth is the precursor to the achievement of a sustainable competitive advantage and profitability. On the other hand, the second perspective claims that growth should not be the input to strategic planning but the outcome of a sound investment strategy. That is, managers should make a fundamental shift in their strategic orientation from “growth first, profitability later” to “profitability first, growth later”. Chapter 2 also presents the Resource-Based View. This theory is of fundamental importance for this thesis because it provides the theoretical lenses on which the entire work is based upon. Chapter 3 introduces the sample and the research methodology. Chapter 4 deals with the actual analysis. The logistic regression are therefore presented and commented. Chapter 5 discusses the results and Chapter 6 outlines the main changes made with respect to previous work and by presenting several implications. The final chapter draws the conclusion to the whole thesis.
LITERATURE REVIEW
In the following sections a review of the most important growth theories is presented. Although there is a tendency to portray firm growth as more or less universally favorable, researchers and practitioners have not come yet to an agreement on how firms undertake their processes of growth. This thesis discusses three different streams of thought: the one-dimensional approach, the idiosyncratic approach and the most recent multidimensional approach.
While the following review is not meant to be complete (it would be almost impossible to summarize more than 50 years of firm growth theories), it is presented in order to create the context in which further analyses will take place.
1.1 One-dimensional approach: “Life-cycle” theory
This theory suggests that organizations grow and develop according to a sequence of predetermined stages, each of which follows the previous one in an incremental and progressive way. Also known as the “Stage of growth theory”, this is without any doubts one of the most common theories of new business growth (Greiner, 1972; Churchill and Lewis, 1983; Hanks et al. 1994). “The life-cycle approach posits that just as humans pass through similar stages of physiological and psychological development from infancy to adulthood, so businesses evolve in predictable ways and encounter similar problems in their growth” (Bhidé, 2000, pg. 244). Organizations are therefore seen as they were biological organisms that grow following prefigured sequences of stages. This approach brings with it three main propositions about firm growth (Kimberly and Miles, 1980):
LITERATURE REVIEW
2. as in a growing organism, the sequence and order in which a growing organization undergoes these recognizable stages is predetermined and thus predictable;
3. as in growing organisms that develop similarly to its own kind, all organizations develop according to pre-defined rules that bring them across different stages. An early and probably the most influential contribution to the development of this theory is made by Greiner (1972). The author posits that throughout their lives, firms follow five growth stages and that every stage ends up in revolutionary period (a period of substantial turmoil in the organization life). The five growth stages are:
1. growth through creativity; this period ends by a leadership crisis; 2. growth through direction, broken off by a crisis of autonomy; 3. growth through delegation, followed by a control crisis;
4. growth through coordination, broken off by a red tape crisis (bureaucracy); 5. growth through collaboration; this period ends by an internal growth crisis. In a more recent thesis, Greiner (1998) restates the crisis associated to the last stage by arguing that this is triggered by the impossibility to find internal solutions and resources rather than a “psychological” saturation of the human resources. The author also adds a sixth phase to his growth phases model suggesting that further growth can only come by developing partnerships with complementary organizations and by relying on these inter-firm relationships to get access to new resources. Figure 1 shows a visual representation of Greiner’s complete growth model.
Furthermore, the author maintains that each growth stage is described by five different parameters: management, focus, organizational structure, top management style, control system and management reward emphasis.
Although being considered as an important baseline model in the field, Greiner’s model along with other life-cycle stage models produced during the ’70s remain vague and general, making application to specific cases difficult (Hanks et al., 1993). During the following decades many new models of firm life-cycle growth based on empirical studies have been proposed. Hanks et al. (1993) compare ten life-cycle models produced until 1993. Three of the models (Miller and Friesen, 1984; Quinn and Cameron, 1983; Smith et al. 1985) were chosen because of their attempt to summarize several models and to achieve some synthesis among competing life-cycle models. Five other models (Adizes, 1989; Churchill and Lewis, 1983; Flamholtz, 1986; Scott and Bruce, 1987; Kazanjian, 1988) were included because of some elements of innovation. Two more models were also included in the analysis: Galbraith (1982), whose model focused on high-technology firms and Greiner (1972) because of its recognized relevance. Hanks et al. (1993) compare and contrast these models in terms of the number, nature and order of stages they entail, and the contextual and structural dimensions of business organisation they contemplate. Even though they have found a reasonably consistent pattern of organization growth as firms move from an early stage to a late stage of maturity, the authors have found no agreement upon the number and nature of the stages. In their thesis the authors also develop a new model whose growth stages are not defined a priori, but are created from a cluster analysis conducted on a sample of 126 high-technology firms. The authors describe the growth process as a sequence of four different stages:
1) start-up stage 2) expansion stage 3) maturity stage 4) diversification stage
Despite the fact that their approach has considerable intuitive appeal, the assumptions underpinning the organismic metaphor have clashed with the heterogeneity of actual firm growth processes.
LITERATURE REVIEW
Similar to Hanks et al. (1993), several subsequent thesiss have tried to shed light on life-cycle models. For instance, Phelps et al. (2007) analyze 33 different life-cycle models published between 1967 and 2003. Lichtestein et al. (2007) have found an even higher number of different models. According to their thesis, 63 different models have been developed between 1960 and 1996. These thesiss confirm that there is no consensus regarding the number of stages; the majority of models include three, four or five stages; most of the rest have between six and eleven stages. Also, researchers do not share yet the same believes on the way organizations move from one stage to the other and on the reasons firm are doing it.
To sum up, after four decades of efforts, the life-cycle approach has not yet come to an agreement on what a stage represents, how many stages there are, and why these stage transitions take place.
Despite this disconfirming evidence, however, new stages models continue to appear in the management literature and in new textbooks.
1.2 Idiosyncratic approach
During the ’90s a new stream of thought spreads among management scholars (Merz et
al., 1994; Garnsey, 1998; McMahon, 1998; Aldrich, 1999; Bhidé, 2000; Dobbs and
Hamilton, 2007). Questioning whether it is possible to model the growth of companies, the new philosophy is in clear contrast with the life-cycle theory. Instead of considering firm growth as a combination of sequential well-defined stages that the firm needs to go through in order to get bigger, the idiosyncratic approach maintains that the growth of a firm over a period of time is contingent on the interaction of a number of internal and external forces. Since every firm is somehow different from any other one, this approach argues that the nature and timing of a firm’s growth is a resultant of its own unique circumstances. Growth is therefore too complex to be reduced to a universal sequence of stages. Because of this heterogeneity amongst firms there is therefore no model or sequence of stages to be observed (Vinnell and Hamilton, 1999).
1.3 Multi-dimensional approach
This recent stream of thought maintains that firm growth is a multidimensional phenomenon. In order to model the growth of organizations in a manner that can be useful for the study of growth management, it is necessary to abandon the one-dimensional approach of the life-cycle models. In fact, despite their diversity, all the stage models refer to firm growth exclusively as size growth. Consequently, this naturally leads to depict the growth process as a sequence of pre-determined stages and therefore causes the disagreement upon what the stages are and how many they are (Lichtenstein et al., 2007). The multidimensional approach is somehow in line with the idiosyncratic approach. In fact, both these approaches aim at a more holistic view of growth that could overcome the one-dimensional, simplistic view of firm growth (Furlan and Grandinetti, 2011; Davidsson et al., 2009; Canals, 2001). This most recent approach agrees on abandoning the belief that firm growth is just the growth of its size, and introduces two more firm growth dimensions: relationship growth and capability
growth.
As for the life-cycle theory, a unique vision has been however not yet achieved. In the next sections a description of different multidimensional models is provided. First, the “hybrid model” by Wiklund and McKelvie (2010) is presented. Along with some other models, all relying on the “network perspective”, it maintains that firm growth is a combination of size growth and relationship growth. Second, two models produced by Lockett et al. (2011) and Phelps et al. (2007) are presented. Based upon Penrose’s (1959) Resource-based View theory, these authors consider firm’s growth as a result of a link between the development of new resources and capabilities (i.e. capabilities
growth) and the size growth of the firm itself. Singh et al. (2007) and Lorenzoni and
Lipparini (1999) believe in a third approach. According to these authors, firm growth, especially the one of organizations seeking to increase their vertical integration, depends on the growth of both capabilities and relationships. Lastly, Furlan and Grandinetti (2011) advance a framework where firm growth is conceptualized as a three-dimension phenomenon involving all three types of growth described so far (i.e. size growth,
relationship growth, and capability growth).
LITERATURE REVIEW
precise definition of what is it meant by size growth, relationship growth and capability
growth is therefore presented.
1.3.1 The growth dimensions
Along with firm size growth, two more growth dimensions (i.e. relationship growth and capability growth) are hereafter described.
a) Size growth
Following the definition given by Furlan and Grandinetti (2011, pg. 7), size growth is here defined as “the broadening of the boundaries of the firm over a given period of time”. Two different size growths can be distinguished: internal and external size growth (Penrose, 1959). The former occurs when organizations decide for investments that increase the size of existing firm units or through investments that aim at creating completely new units or subsidiaries; the latter mainly concerns with mergers or acquisitions.
b) Relationship growth
Relationship growth is here intended as the increase of the usage of external resources over a given period of time. According to Das and Teng (2000), external resources are assets (physical or otherwise) that a company is able to use only by creating a relationship with the firm that owns them. The more rare and critical these resources are, the more valuable is the relationship. Jarillo (1989) maintains that the use of external resources, conceptualized under the heading of “networks”, is fundamental in order to achieve and sustain a competitive advantage. The importance of external resources and relationships is also stressed by Gulati et al. (2000), that define what they call “strategic networks” as a firm’s set of relationships, both horizontal and vertical, with other organizations, being their suppliers, customers, competitors, or other entities. In their thesis, the authors claim that these strategic networks in which firms are embedded play an extremely important role in their conduct and performance. Beekman and Robinson
(2004) claim that the extent to which firms turn to external resources can vary by either increasing the value of already existing relationships or by creating completely new networks.
c) Capability growth
Capability growth is the development of new capabilities over a given period of time. A firm can acquire new capabilities by either undertaking an internal development or by turning towards the external environment and acquiring them on the market. The literature distinguishes between three different types of capabilities: functional,
relational and dynamic capabilities.
Functional capabilities refer to “the abilities to effectively and efficiently carry out the
core functions (operations, marketing and R&D) and the support functions (e.g. human resources management, accounting) of the firm” (Furlan and Grandinetti, 2011, pg. 8).
Relational capabilities are here meant as the firm’s capability to create, develop, and
make use of relationships with its business partners. This definition has been derived by combining the definitions of several authors. For instance, Dyer and Singh (1998) label
relational capability as the relation-building skills that are necessary to employ
effective governance mechanisms, make relation-specific investments, or develop knowledge-sharing routines. Lorenzoni and Lipparini (1999) regard relational
capability as the ability to successfully manage the existing network of relationships.
Croom (2001, pg. 35) maintains that “relational competencies are those competencies obtaining to the processes of communication, interaction, problem resolution and relationship development.” Jarillo (1989) refers to the ability to tap external resource through the building and maintaining of social relationships. Walter et al. (2005, pg. 546) define firm’s network capability as “its abilities to initiate, maintain, and utilize relationships with various external partners”.
Dynamic capabilities refer to the firm’s ability to generate, integrate and reconfigure
internal and external resources in order to match and even create market change (Eisenhardt and Martin, 2000). Also, according to Teece et al. (1997), dynamic
LITERATURE REVIEW
learning, including the capacity to reconfigure the whole value of the firm; its position, that is its access to specific competences by selecting suitable partners; and its path, that is its trajectory, because change is always path-dependent. Also, as Mitchell et al. (2007) claim, acquisition-based capabilities, providing new resources to the company, can also be considered as dynamic capabilities.
1.3.2 Relationship growth and Size growth
As mentioned earlier, the thesis will now deal with four different multidimensional models. Although they differ from each other in the way they take into consideration the interaction between the three aspects of firm growth (size, relationship and capability), they share the common belief that firm growth cannot be considered as a mere one-dimensional process.
With their “hybrid model” Wiklund and McKelvie (2010) maintain that firm growth depends on the extent to which an organization enlarges its physical boundaries (i.e. size
growth) and the way it increases its relationships. Their model follows the work of
several other authors such as Jarillo (1989) and Stevenson and Jarillo (1990). This stream of thought relies on the so-called “network perspective”, which states that by developing inter-organizational relationships the firm can acquire external resources that lead to nurture the growth of its size. Jarillo (1989) is among the first to quantitatively show that firms that rely more on external resources are more likely to grow faster. In his research study the author analyses 1902 companies in 233 different industries. Through his statistical analysis, Jarillo (1989) finds evidence that fast-growing companies use external resources 64% more than average, whereas slow-growing firms exhibit the opposite behavior. Furthermore, his work shows that firms that use more external resources grow faster. Lastly, he finds evidence of a size effect. That is, small firms tend to tap, more and in a more sustainable way, resources that are external to them in order to be flexible and to grow. In conclusion, Jarillo maintains that firms may leverage new resources provided by strategic alliances with the deliberate intent to initiate a size growth process. Following Jarillo’s work, other authors such as Coviello and Munro (1995), Barringer et al. (2005) and Zander and Zander (2005) have
found a causal positive relationship between the development of new or existing relationships and size growth.
1.3.3 Capability growth and Size growth
Mainly based on Penrose’s theory of firm growth, this second multidimensional approach attempts to build a bridge between the development of new resources and capabilities (or new combinations of existing resources and capabilities) and the size growth of the organization. Penrose (1959) has been widely recognized as being the most influential author of modern resource-based thinking. In her “The Theory of the
Growth of the Firm”, the author suggests that firm’s resources drive value through the
development of competitive advantage (Ireland et al., 2007). The basic assumptions of the Resource-based View are twofold: on the one side, heterogeneity of resources and/or capabilities. That is, different companies possess bundles of different resources and capabilities. On the other side, immobility of resources and/or capabilities, which refers to resources that competitors find either difficult and/or costly to obtain. Further studies have then found evidence that the sustainability of this advantage over competitors is contingent on the extent to which the firm’s resources reflect certain characteristics (Barney, 1991). These resources should be valuable, rare, inimitable and
organized (VRIO). They should be valuable, that is they should increase the efficiency
and/or effectiveness of the firm; they should be rare, as otherwise it would not be possible to gain any long-term competitive advantage. Furthermore, they should be
inimitable, that is to say imperfectly mobile or specialized to firm-specific requirements
(Peteraf, 1993, pg. 183). Lastly they should be organized, that is the firm can effectively exploit them. While fundamental for achieving competitive advantage over competitors, Penrose also maintains that the increase of capabilities is at the basis of size growth and that the growth of the size of the firm in turn generates an increase in capabilities. According to Lockett et al. (2011), this happens both in organic and acquisitive growth. The former occurs when the firm enlarges its boundaries through investment that increases the size of existing company units or through greenfield investments, that is investments in the creation of new production, logistics or commercial units. The latter
LITERATURE REVIEW
firm decide to acquire part or the entire of another company. Also, in order to simplify the integration process of the target firm into the acquiring one, acquisitions in many cases trigger the development of specific capabilities (Mitchell et al., 2007). As mentioned earlier, these acquisition-based capabilities can, in most cases, be considered as dynamic capabilities.
Size growth and capabilities growth do not necessarily have to follows each other; they can also happen simultaneously. This is the case when acquisitions aim at obtaining the resources and capabilities to enter a new business or to implement a new strategy (Canals, 2001).
1.3.4 Relationship growth and Capability growth
This third group of studies aims at tracing a link between the network perspective (i.e.
relationships growth) and the resource-based view (i.e. capabilities growth). According
to Lorenzoni and Lipparini (1999), companies need to develop appropriate capabilities to assess and select right partners in order to build new networks. Gulati et al. (2000) have found evidence that strategic networks allow a company to have a better access to information, resources, markets, and technologies and therefore lead the company to achieve better results. Similarly, Stuart (2000) offers additional evidence to confirm the prevalent assumption that strategic alliances -being, in the first instance, access relationship- can improve performance. In his study of the effect of horizontal alliances in the semiconductor industry, the author argues that the important determinants of the strength of the alliance-performance link are the attribute profiles of the firms that an organization is affiliated with, not the mere fact that it is affiliated. His study confirms that many of these coalitions have been created by corporations eager to acquire resources and capabilities (in particular devices or manufacturing technologies) from their strategic partners. Taken for granted that firms enter strategic alliances to acquire know-how or other resources, he finds evidence that well-endowed partners are, on balance, the most valuable associations. That is, organizations with large and innovative alliance partners perform better than comparable firms that lack such partners. In addition to purveying access to resources, large partners can also facilitate the entrance into new market niches and the launch of joint-developed products by providing access
to extensive distribution channels, long-lasting customer relations or a widely-adopt technology platform. Another important result of the study is that alliances also affect firm performance through their influence on an organization’s reputation. Results show in fact that enterprises -especially small ones- can benefit by partner up with large, highly skilled or well-known organizations mainly because when there is uncertainty about the quality of someone or something, evaluations of it are strongly influenced by the partner’s reputation (Merton, 1968; Podolny, 1994).
Other studies follow an opposite direction and analyze the positive effect of building strategic networks on firm’s internal capabilities. By creating relationships along its value chain, a firm can take advantage of strategic networks to have access to new resources and capabilities. Petroni and Panciroli (2002) and Furlan et al. (2007) have found evidence that the learning mechanism associated with these strategic alliances typically lead the firm to develop new capabilities in different functional areas. Other studies, focusing on “lean suppliers” in the Japanese, North American and European automotive industry, have shown that car manufacturers relying more and more on strategic alliances rather than competitive and adversarial relationships, increase their capabilities and their intense knowledge transfer to suppliers (Cusumano and Takeishi, 1991; MacDuffie and Helper, 1997; Kotabe et al., 2003). Most of these studies focus on the advantages of vertical integration. Evidence that investment in relation-specific assets are positively related to superior firm performance has been also proven by Dyer (1997) and Dyer and Singh (1998). These authors also argue that the systematic share of valuable know-how with strategic partners is the real source of competitive advantage. Strategic alliances, defined as “voluntary arrangement between firms involving exchange, sharing, co-development of products, technologies, or service” (Gulati, 1998, pg. 293), have been therefore considered as an important source of resources, learning, and thereby competitive advantage. Although cooperative relationships can also have negative aspects -for instance they can reduce revenue streams by forcing firm to share profits (Shan, 1990) or can lull firm managers into failing to develop important capabilities (Hamel et al., 1989; Teece, 1987) - strategic alliances are nowadays almost universally portrayed as a “must”. However, there is no final agreement about the main reasons these alliances are formed (Appendix A provides a brief summary of the most influential theories on alliances formation).
LITERATURE REVIEW
1.3.5 Size growth, Relationship growth and Capability growth
The last model presented in this thesis is the model produced by Furlan and Grandinetti (2011). In their thesis, the authors advance a framework where firm growth is conceptualized as a three-dimensional phenomenon involving size growth, relationship
growth, and capability growth. In addition to conceptualize firm growth as a
multidimensional phenomenon, the authors also maintain that these three different types of growth are interdependent. While the interdependencies between the different dimensions of firm growth were also suggested by all the multidimensional models presented so far, Furlan and Grandinetti’s model combines all three dimensions
simultaneously. They formulate this new model by empirically studying 16 different
firms in the North-East of Italy. This region is a highly industrialized area with a high concentration of, prevalently, small and medium-sized manufacturing firms, many of which characterized by relevant growth processes during the last two/three decades. After carrying a series of interviews with CEOs and managers of these companies, the authors were then able to compare their results with previous studies. Their final model of firm growth confirmed the entire expected model (i.e. the model suggested by combining previous multidimensional models) and also enriches it by adding three new interdependences that were not considered by previous authors (see Figure 2). Figure 3 shows Furlan and Grandinetti (2011)’s one, called final model from now on.
Figure 3. The final model of firm growth
In what follows a brief description of Furlan and Grandinetti (2011) most relevant findings is presented. For the sake of clarity, the combinations of the three dimensions are hereafter treated separately.
• Size growth and relationship growth
As far as concerns the interdependency between size growth and relationship growth, the authors maintain that these dimensions are not exclusive. On the contrary, they have found empirical evidence of their interdependency and –often- of their complimentary. For example, in industrial markets companies “new large customers often lead the suppliers to make further capacity investments” (Furlan and Grandinetti, 2011, pg. 16). Also, firms operating in the consumer market foster their size growth process by developing new networks and providing new partners with strategic services like marketing research, advertising, product design and the like. While past literature agrees that relationship growth may generate opportunities for size growth (this relationship is labelled E1 in the expected model and F1 in the final model), there was no previous evidence about what Furlan and Grandinetti label F2 and F3 in their model.
LITERATURE REVIEW
Figure 4. Interdependency between size growth and relationship growth
F2 refers to the “establishment of new relationships, expansion of the existing relationships or also the combination of both” (Furlan and Grandinetti, 2011, pg. 18). The authors have found evidence that this interdependency does not only involve downstream relationships but also upstream ones. For instance, several firms have
decided to move their manufacturing activities internationally through the creation of off-shore production plants that became in turn strategically important in creating relations with local subcontractor.
As far as concerns F3, the authors claim that the interdependency between size growth and relationship growth is not just causal in nature with a temporal lag that separates the cause from the effect. In fact, these dimensions can also grow simultaneously. In particular, this happens whenever an organization acquires -or merges with- another firm. The incorporation of the assets and the appropriation of the relationships belong to the acquired firm will in fact determine the simultaneous increase in the above-mentioned dimensions.
• Capability growth and size growth
With regards to the interdependencies between capability growth and size growth, the model presented by Furlan and Grandinetti (2011) follows the ones produced by previous authors. As shown in Figure 5, the interdependency labelled F4 in the final model corresponds to the interdependency labelled E2 in the expected model. As for the expected model, Furlan and Grandinetti have found evidence of the causal relationship between capability growth and the subsequent size growth. Specifically, the accumulation of capabilities leads to “three types of strategic shift that have triggered a discontinuity in the size growth of our firms” (Furlan and Grandinetti, 2011, pg. 20):
• internationalization strategies;
• repositioning strategies;
LITERATURE REVIEW
Figure 5. Interdependency between capability growth and size growth
With regards to the first strategic shift, the authors have found evidence that firms preparing for new internationalization strategies develop beforehand new marketing
capabilities, for example by organizing internal training programs or by recruiting skilled employees. Similarly, capabilities growth also anticipates size growth during repositioning (both horizontal and vertical) and diversification strategies.
Furthermore, interdependencies where capability growth chase size growth (labelled F5 in the final model and E3 in the expected one) have also been found in Furlan and Grandinetti’s work. “This happens when a sudden increase in the firm’s size, resulting in heightened organizational complexity, requires a substantial development of new capabilities. Here the timeframes of the two growths are very different: while size growth occurs in a short time, capabilities need more time to develop in order to adapt the organization to the new size” (Furlan and Grandinetti, 2011, pg. 22). This could happen during business acquisitions, especially if the acquirers are inexperienced. As found by Mitchell et al. (2007), these inexperienced firms have to develop dynamic capabilities from scratch in order to sustain the integration of the resources and capabilities of the two companies. Empirical studies have shown, however, that the faster this process is undertaken the more likely it is to become problematic (Homburg and Bucerius, 2006; Chatterjee, 2009). In line with these last authors, Furlan and Grandinetti (2011) have also found that acquisitions get tougher the more the acquirer and the target are different. In particular this happens if: a) the acquirer is not significantly bigger that the target company; b) the two firms are dissimilar in terms of other structural and organizational features.
With regard to the simultaneous interdependency between capability growth and size
growth, this is found both in the final model and the expected model, labelled F6 and E4,
respectively. Furlan and Grandinetti (2011, pg. 23) claim that “several acquisitions we analyzed were fundamentally driven by the willingness of the management to acquire the stock of capabilities of the target firm. These capabilities were necessary in order to implement specific strategies such as entry into a new strategic business area”.
• Capability growth and relationship growth
As far as concern the interdependencies between capability growth and relationship
growth, Furlan and Grandinetti (2011), in line with previous authors, have found
LITERATURE REVIEW
interdependency labelled F7 in the final model corresponds to the interdependency labelled E5 in the expected model).
For instance, investments in functional and relational capabilities allow firms to create relationships with new customers and suppliers. Additionally, investments in dynamic capabilities allow firms to undertake repositioning and diversification strategies that require a value network reconfiguration.
The opposite relationship is also true. That is, a change in an existing relationship or the formation of a new one can lead to the development of new capabilities (this interdependency is labelled F8 in the final model and E6 in the expected one).
In contrast with the expected model, Furlan and Grandinetti (2011) have also found evidence of a simultaneous interdependence between these two dimensions (labelled F9 in the final model shown in Figure 6). This is particularly true in the case of inter-firm collaborations. The authors maintain that these partners’ interactions lead to a twofold result: on the one hand, “it increases the resources the firms can get access to, thus increasing the value of the relationship (i.e. relationship growth). On the other hand, it increases partners’ capabilities (i.e. capability growth), including the refinement of relational capabilities” (Furlan and Grandinetti, 2011, pg. 26). In their study, the authors have found evidence that all the firms in their sample cooperate with some partners in order to develop new capabilities. While the most common situation of inter-organizational collaboration are with customers and suppliers, the authors have also found evidence that some companies are relying on “collaborations with non-profit organizations (e.g. universities), competitors (i.e. horizontal cooperation) and firms operating in other industries (i.e. lateral cooperation)” (Furlan and Grandinetti, 2011, pg. 26).
FIRM GROWTH AND FIRM SUCCESS
What top managers are looking for is sustained and profitable growth. Sustainable profitable growth is an important concern for all companies and one of the most critical challenges facing senior executives today. However, empirical investigations show that surprisingly few established companies manage to achieve growth in both sales and profits over the longer term (Zook and Allen, 2001). The question that arises is therefore why these firms cannot simultaneously reach a state of high profitability and
high growth? Is it a strategy issue? And, is there a specific path firm can undertake to reach such desired state?
Having presented a summary of the most influential theories about firm growth, the thesis turns now the attention to the relationship between the growth of the company and its success. Although the number of research on this topic has increased in recent years (Davidsson and Wiklund, 2000; Delmar, 1997), empirical evidence on this link remains mixed. The literature review suggests that value of growth for the success of firms is viewed in two conflicting ways.
In the following sections a brief presentation of these two different streams of thought and some relevant empirical works are presented. Then, an introduction to the Resource-based View is provided.
2.1 The key to success: “growth first, profitability later”
This first perspective maintains that firm growth is a precursor to the achievement of a sustainable competitive advantage and profitability. This is usually the perspective assumed by the majority of practitioners and policy-makers alike that consider growth as an indication of business successes. In fact, business media sources, policy programs
FIRM GROWTH AND FIRM SUCCESS
designed to stimulate and assist the growth of companies, as well as teaching cases and textbooks, all treat adverse growth as a rare exception (Davidsson et al., 2009).
As a matter of fact, the assumption that firm growth leads to higher levels of profitability and success also appears in a variety of literature ranging from scale
economies (Besanko et al., 2004), to experience effects (Stern and Stalk, 1998), first-mover-advantage (Lieberman and Montgomery, 1988) and network externalities (Katz
and Shapiro, 1985).
According to the economy of scale perspective, in fact, the bigger the firm (and, in particular, the bigger the scale of output), the lower the average unit cost should be. By producing at a lower unit price, firm are therefore able to become more profitable. Similarly, the experience effect theory maintains that the more often a specific task is performed, the lower the cost of performing it becomes; and this is more likely to happen for bigger companies. As for the economy of scale case, firms are therefore able to gain a competitive advantage by producing cheaper products compare to their competitors. With regards to the first-mover-advantage theory, there may be an advantage by entering a new market as first. A growing firm is more likely to expand into new markets and, as a consequence, to enter as a first mover. According to this perspective, first-movers can be rewarded with huge profit margins and a monopoly-like status. Lastly, the network externalities literature claims that a growing firm is more likely to benefit from this network effect. In fact, the bigger the company the more products is likely to sell. Consequently, since more people use them the value of the products or services increase, adding therefore profit to the firm.
The assumption that firm growth leads to higher level of profitability and success has been also empirically proved by several authors. For example, using a longitudinal database of 45,525 firms, Sexton et al. (2000), have found that firm profitability is correlated with sustainable growth. Firms that can finance growth through internally generated funding are more profitable than firms with uncontrolled or unbridled growth. In their research on possible connection between growth and profitability, Cox et al. (2002) affirm a positive relationship between sales growth rate and the growth rates for profitability and market share. Similar results have been achieved by studies conducted by Chandler and Jansen (1992) and Mendelson (2000). Authors such as Baum and
Wally (2003), Cho and Pucic (2005) and Peng (2004) obtained weaker results, yet statistically significant.
2.2 The key to success: “profitability first, growth later”
In sharp contrast to the above rationale, this second perspective maintains that “growth first, profitability later” might also create numerous problems and challenges (Churchill and Lewis, 1983; Greiner, 1972; Kazanjian, 1988; Shuman and Seeger, 1986).
With regards to the theories presented in the previous section (i.e. scale economies,
experience effects, first-movers-advantage and network externalities), “research in
industrial economics have shown that scale economies are not much of a barrier to entry; that surviving new entrants operate for long times at sizes far smaller than the industry average; that minimum efficient scale is typically reached at a rather small size; that very limited cost advantage are usually gained beyond that minimum, and even that it is possible to operate significantly below it without severe cost disadvantage” (Davidsson et al., 2009, pg. 390).
The belief that there is no relationship between growth and profitability (and, therefore, success) has been also confirmed by empirical studies. For example, in their thesis, Markman and Gartner (2002) have tested whether extraordinary high-growth firms can achieve profitability while growing, or whether such firms are likely to be unprofitable as they attempt to overcome the hurdles of change while achieving significant size. Using longitudinal data from three separate cohorts (from 1992 to 1996, 1993 to 1997, and 1994 to 1998) of Inc. 500 firms (that is, the 500 fastest-growing private companies in the U.S.), their analyses have shown that extraordinary high growth -in terms of sales and number of employees- is not related to firm profitability. In a review of research on the strategy of high-growth firms, Hoy et al. (1992) have found similar evidence. They conclude that the pursuit of high growth may be minimally or even negatively correlated with firm profitability. Shuman and Seeger (1986) have found no statistical relationship between firm growth and financial performance in their studies of small high-growth firms. Similarly, Chandler and Jansen (1992) have discovered that sales growth and profitability are not correlated. Capon et al. (1990) state that a significant positive association between growth and financial performance is only found in
across-FIRM GROWTH AND FIRM SUCCESS
industry studies, whereas the effect is very small and statistically non-significant in within-industry studies. Ramezani et al. (2002)’s results have also indicated that maximizing growth does not maximize corporate profitability or shareholder value. Therefore, “growth should not be the input to strategic planning but the outcome of a sound investment strategy that is geared to accepting value-creating projects” (Ramezani et al., 2002, pg. 65).
A recent study by Davidsson et al. (2009) has shown that growing for the own sake of growing is not necessarily the best strategy to follow. On the contrary, the authors have found evidence that “profitability first” rather than “growth first” is the preferable strategy in order to achieve the desirable state of high growth and high profitability. Their result is in line with Khanna and Palepu (1999) that also maintain managers should make a fundamental shift in their strategic orientation from “growth now, profitability later” to “profitable growth now”.
In summary, the empirical evidence on the relationship between firm growth and profitability is inconclusive (Davidsson et al., 2009). Despite the theoretical arguments there is little evidence of a sure relationship between firm growth and firm performance. This thesis aims at providing another empirical test that could shed some light on a still high-controversial topic.
2.3 The Resource-based View Approach
The Resource-based View is in its historical origin very closely connected with firm growth and, in particular, with the concept of profitable growth (Davidsson et al., 2009). Furthermore, with its focus on within-industry differences and on small- and medium-sized enterprises (SMEs) rather than large corporations (Davidsson and Wiklund, 2000; Peteraf and Barney, 2003), this approach seems to fit well with the dataset of manufacturing companies used in this study. It seems therefore reasonable to use the theoretical lens of this approach as a starting point in considering the relationship between firm growth and profitability. By the logic of the Resource-based View, firms should pursue growth opportunities that match their resource advantage. This would in turn allow them to grow profitably. However, if such companies pursue other
opportunities growth, they may destroy rather than create value (Kogut and Zander, 1992).
The Resource-based View maintains that superior performance is likely to be indicative of having built a resource-based competitive advantage. According to Davidsson et al. (2009)’s theoretical argument, building a valuable resource-based competitive advantage may at first constrain growth. However, “the underlying advantage itself and the financial resources generated through high profitability make it possible for firms in this situation to achieve sound and sustainable growth – which may require building a series of temporary advantages – without having to sacrifice profitability. By contrast, when firms strive for high growth starting from low profitability, the latter often indicates lack of competitive advantage” (Davidsson et al., 2009, pg. 389). The authors also argue that low-profitability firm cannot usually finance the creation of a hard-to-copy competitive advantage, while growing. As a consequence, their growth process will turn to be not sustainable and will not therefore improve the company future profitability. “Based on these Resource-based View arguments, we hold that although exceptions exist, it is advantageous in most situations to let profitability (and the competitive advantage it reflects) be the horse that pulls the growth cart, rather than the other way around” (Davidsson et al., 2009, pg. 389).
The Resource-based View does not deny the existence of other sources of superior firm results such as scale economies or first-mover-advantages. However, Barney (1991) suggests that if based on just scale economies a cost advantage is unlikely to be sustainable. Similarly, the author maintains that first-mover-advantages become sources of sustained competitive advantage only when companies are based on VRIO resources (i.e. valuable, rare, inimitable and organized).
Given its elegant simplicity and its immediate face validity, the Resource-based View’s core message is appealing, easily grasped, and easily taught. Yet the Resource-based View has also been criticized for several weaknesses. While a comprehensive presentation of this theory is not the main goal of this thesis, a brief summary of the criticisms is presented in Appendix B (for a more detailed overview of these critiques, the reader can refer to Kraaijenbrink, 2010).
In order to avoid some of the main criticism addressed towards this theory, this thesis refers to the Resource-based View in a rather broader sense. This notion will be in fact
FIRM GROWTH AND FIRM SUCCESS
extended with the dynamic capabilities approach and the Knowledge-resource View theory.
A brief description of these two approaches will be hereafter presented.
2.3.1 Dynamic capabilities approach
Helfat and Peteraf (2003) and Teece et al. (1997) have introduced this approach to the Resource-based View in order to incorporate a processual dimension and a better understanding of how advantage is gained and maintained over time. Dynamic
capabilities are the organizational and strategic routines by which firms achieve new
resources configurations as markets emerge, collide, split, evolve, and die (Eisenhardt and Martin, 2000). These resources cannot remain static. Although in static environments some static unique resources could lead to a sustainable competitive advantage, dynamic environments call for dynamic capabilities (Helfat et al., 2007). In today’s turbulent environment these capabilities must be continually evolving and developing. Therefore, companies must continue to invest in and upgrade their resources to create new strategic growth alternatives. In other words, dynamic
capabilities are directed at the creation of future valuable resources (Bowman and
Ambrosini, 2003). The dynamic capability perspective has lent value to the Resource-based View arguments as they transform what is essentially a static view into one that can encompass competitive advantage in a dynamic context (Barney, 2001). According to Teece et al. (1997), dynamic capabilities comprise four main processes:
reconfiguration, leveraging, learning and integration.
Reconfiguration refers to the transformation and recombination of assets and resources. Leveraging might involve replicating a process or a system that is operating in one area
of an organization in another, or by extending a resource by deploying it into a new domain. As a dynamic capability, learning allows tasks to be performed more effectively and efficiently as an outcome of experimentation, failure and success. Finally, integration relates to the ability of the firm to integrate its assets and resources, resulting in a new resource base (Jenkins and Ambrosini, 2007).
2.3.2 Knowledge-based View theory
Giving the multidimensional growth approach on which further analyses are based upon, it is therefore important to extend the notion of Resource-based View with the Knowledge-based thinking, which is enormously important for understanding a number of central topics in strategy, including acquisitions, alliances and strategic choices (Pettigrew et al., 2006). This perspective considers knowledge as the most strategically significant resource of the firm (Grant, 1996). What makes knowledge particularly interesting is that it can be explicit, that is being the knowledge that can be articulated to others, and tacit, that is being the knowledge that is embedded in people that they are not able to articulate. Polanyi (1966) famously characterized tacit knowledge when he said “we know more than we can say that we know”. In terms of strategy, both explicit and tacit knowledge can be very important. It is generally argued, however, that tacit knowledge is more strategically important as it is embedded in people and extremely difficult for competitors to replicate. Because knowledge-based resources (above all, tacit ones) are usually difficult to imitate, its proponents argue that heterogeneous knowledge bases and capabilities among firms are the main determinants of sustained competitive advantage and superior performance (DeCarolis and Deeds, 1999).
In conclusion, in the context of SMEs, the Resource-based View -considered in a broader sense- provides a plausible explanation for why firms in the same industry might differ in performance and it is therefore used as the rationale behind the analyses presented later.
In the following section a more detailed description of the dataset and the research methodology are presented. However, before diving into the more empirical part of the thesis, a more detailed summary of Davidsson et al. (2009)’s work is provided. Even though several major changes have been made with respect to their thesis, this has represented an important starting point for the whole project.
2.4 The framework proposed by Davidsson et al. (2009)
As briefly mentioned before, Davidsson et al. (2009) have used two longitudinal data sets of small- and medium-sized enterprises (SMEs) from Sweden and Australia to test
FIRM GROWTH AND FIRM SUCCESS
time. On the one hand, the first hypothesis questions whether firms that reach high profitability at low growth are more likely to success in subsequent periods. On the other hand, the second hypothesis argues whether a state of low growth and low profitability is more likely to be reached by companies that first showed high growth at low profitability (while important this latter hypothesis is, however, not tackle in this thesis). Their findings suggest that “profitability first” rather than “growth first” is the preferable strategy in order to achieve the desirable state of high growth and high profitability. That is, firms achieving high overall company performances are “much more likely to originate from profitable firms with low growth than from growing firms with low profitability. Firms in the latter category are instead more likely to retreat a low growth and low profitability state” Davidsson et al. (2009, pg. 403). High growth is therefore not direct evidence of value creation and success. In fact, when companies strive for high growth starting from low profitability, it usually indicates lack of valuable and difficult-to-imitate advantage. Conversely, creating a competitive advantage -which may at first constrains growth- and assuring financial resources through high profitability make it more likely for firms to achieve a more sustainable growth. Furthermore, the authors have found evidence that firms which embark on a growth path starting from low levels of profitability are unlikely to be able to finance strategies towards building valuable and hard-to-copy advantages. As their growth is unlikely to be sustainable (Ramezani et al., 2002) they run an increased risk of becoming low performers on both growth and profitability.
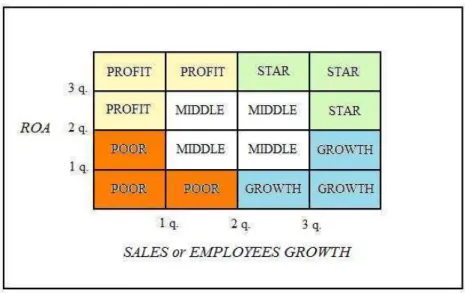
In order to achieve these conclusions the authors have had to first classify firms into five performance groups in any period of time based on two performance dimensions: sales growth and ROA (considered as a proxy of firm growth and profitability, respectively). Figure 7 shows how the firms are divided into the five different categories. In order to study how firms move from one category to the other over time, Davidsson
et al. (2009) have calculated the proportion of companies that moved to each group (or
ceased business). Then, they have tested the differences between these specific transition proportions using standard z-tests.
Following their work, the analysis presented in this thesis will use the same method to categorize the companies. However, some improvements are made. Chapter 6.1 discusses in depth these changes.
SAMPLE AND RESEARCH
METHODOLOGY
After having presented the theories about firm growth and the literature concerning profitable growth, this chapter deals with the empirical analyses performed on a set of Californian manufacturing companies.
The chapter is organized as follows: First, the objectives of the thesis and the research question are once again presented. Then, a description of the dataset, the variables used and the analyses performed are provided.
3.1 Objectives
The main goal of this work is to deeper investigate the topic of profitable growth. Following Davidsson et al. (2009), this thesis analyzes a set of Californian manufacturing companies in order to find further evidence of the relationship between growth and profitability. While most of the past literature considers growth as a synonymous of success, recent studies and events have shifted the attention towards profitability, pointing out that growth per se does not equate with business success.
3.2 Research Question
The thesis tries to answer a specific research question:
• What is the best strategy to achieve high overall firm performance? In particular, are firms that pursue profitability instead of growth more likely to reach a Star status over time?
SAMPLE AND RESEARCH METHODOLOGY
Consequently, a hypothesis about growth–profit configurations over time is developed.
Hypothesis: Firms that show high profitability at low growth are more likely to reach a
state of high growth and high profitability in subsequent periods than are firms that first show high growth at low profitability.
In order to answer this question and test the hypothesis, a pool of more than 200 companies have been gathered and analyzed.
3.3 Data Sources
The data used to run the regressions are sourced from Mergent Online. This database provides business and financial information for over 23,000 U.S. and international public companies. The analysis presented in this thesis, however, focuses solely on Californian public manufacturing firms.
California is the most populated state in the United States, accounting for more than 37 millions inhabitants1 (12% of overall U.S. population). It is located in the far west bordered by Oregon, Nevada, and across the Colorado River, Arizona, Mexico and the Pacific Ocean. The economy of California plays a very significant role in United States. California's economy is the eighth largest economy in the world, if the states of the U.S. were compared with other countries. According to data given by the California Department of Finance 2 , California's gross state product is $1.891 trillion. Manufacturing accounted for nearly 10% of the economic output with a contribution of $189 billions.
The chief manufacturing goods of the state are electronic and electrical equipment, computers, industrial machinery, transportation equipments and foods.
As of 2011 California places second (after New York State and ahead of third place Texas) with 53 Fortune 500 company headquarters, many of which are located in the Silicon Valley, a region in the Southern part of the San Francisco Bay Area in Northern
1 http://2010.census.gov/2010census/data/ 2 http://www.dof.ca.gov
California. Silicon Valley is the biggest high-tech manufacturing center in the United States, accounting for one third of all venture capital investment in the United States. Following the U.S. Census Bureau3, manufacturing companies are those whose SIC code (Standard Industrial Classification code) starts with the first two-digit ranging from 20 to 39, as shown in Table 1.
Table 1. Manufacturing SIC Code
Limiting the analysis to sole manufacturing companies insures that the dimension on which the success of the firms is characterized is of comparable importance. However, since manufacturing includes a large variety of industries exception can be found. Another restriction is also applied to the dataset. Since data are gathered for the years 2004 through 2009, only firms founded before or in 1999 are considered. The reason being that “young companies” (i.e. firms founded after 1999) are more likely to experience uncommon growth and profitability rates in their first years, and could therefore alter the results. As a consequence, even the youngest firms in the dataset have been operating in their business for at least five years.
After taking into consideration the geographic, industry and time frame constrains, the dataset accounts for 1,102 firms. Missing data on growth and/or profitability in addition to eliminating firms that merged or reorganized as part of a parent company have further reduced the analyzable sample to 218 companies for the “Employees analysis” and 239 for the “Sales Analysis” (refer to the next section to find out more about these two distinctive analyses). Even though in Chapter 1 mergers and acquisitions have been
SAMPLE AND RESEARCH METHODOLOGY
described as possible strategies companies use to grow, it is important to note that the focus of this thesis is on firms that maintain their original organizational structure. The main reason being that mergers and acquisitions envisage the participation of two or more parties, forcing firms to cope with different interests and not allowing them to be completely “masters of their own”.
With respect to their size, companies in the dataset vary from one-person firms to large multinational companies. The majority of firm is however considered small businesses. In the United States, the definition of small business is set by a government department called the Small Business Administration (SBA) office4. SBA defines a small business concern as “one that is independently owned and operated, is organized for profit, and is not dominant in its field”. Unlike the UK and the European Union which have simple definitions applied to all industries, the U.S. has chosen to set size standards for each individual SIC coded industry. This variation is intended to better reflect industry differences. With respect to the manufacturing industry, the maximum number of employees may range from 500 to 1500, depending on the type of product manufactured.
Among the 218 firms analyzed in the “Employees analysis”, 52.3% of them have less than 500 employees; 72% of the companies have less than 1500 employees. Similar percentages have been found for the “Sales analysis”.
In terms of foundation date, companies in the dataset range from 1849 to 1999. The median is 1986.
More complete descriptive statistics of the dataset are provided in Appendix C.
3.4 Measures
The analyses performed in this thesis require firm profitability and firm growth to be calculated for two different periods.
On the one hand, Period 1 includes years 2004, 2005 and 2006. On the other hand,
Period 2 combines years 2007, 2008 and 2009.
In line with Davidsson et al. (2009) and Arend’s (2006) recommendations, return on asset (ROA) is used as a proxy of profitability. In order to obtain more reliable results,
profitability is computed as the arithmetic mean between three subsequent years. Specifically, the following formula has been used:
1 2
, 3
t t t
ROA ROA ROA
ROA= + + + +
where t is 2004 and 2007 for Period 1 and Period 2, respectively.
With regards to firm growth -whether employees growth or sales growth- academics have not come to agree yet which is the most appropriate growth indicator. In order to avoid any critics and to obtain the most reliable results possible, both indicators have been used in two separate analyses. It is important to note that, given the complexity to measure capabilities growth and relationships growth, only size growth is considered. Even though the two other growth dimensions presented in Chapter 1 are not directly taken into consideration, Chapter 6 will discuss the possibility to interpret the results within the multi-dimensional approach proposed by Furlan and Grandinetti (2011). Following Jarillo (1989), the compounded rate of growth for each company in the two periods is calculated as follows:
1/
(( t n/ t) n 1) 100,
Growth= Employees+ Employees − ∗
where t is 2003 (for Period 1) and 2006 (for Period 2) and n = 3. The same formula is then used with Sales instead of Employees.