1
POLITECNICO DI MILANO
School of Industrial and Information Engineering
Master of Science in Management Engineering
Analysing hospital resilience capacities to cope with maxi
emergencies: a simulation approach
Advisor: Prof. Paolo Trucco
Correlator: Dr. Roberto Faccincani
MSc Thesis of: Claudio Nocetti Matr. 10471754
2
Abstract (Italian version)
Scopo di questa tesi è dare un contributo al miglioramento delle strategie e pratiche di resilienza e di continuità operativa nelle strutture ospedaliere. I risultati raggiunti si ritiene possano offrire utili raccomandazioni ai manager ospedalieri che devono preparare le loro organizzazioni a far fronte a un evento di maxi emergenza. All’interno di questa tesi viene valutata la risposta del sistema ospedaliero applicando le indicazioni proposte dal PEMAF (Piano di Emergenza per il Massiccio Afflusso di Feriti). La presenza di un PEMAF è un requisito di accreditamento per ogni ospedale italiano dotato di un Dipartimento di Emergenza e Urgenza. Una simulazione multi-method in condizioni di routine e di emergenza, basata sul caso dell’Ospedale San Raffaele, è la base della metodologia applicata per l'analisi. Sono state condotte due campagne di simulazione per analizzare due diversi scenari, quello diurno e quello notturno. Nel primo scenario, la risposta del sistema ospedaliero, applicando le indicazioni contenute nel PEMAF, viene confrontata con due diverse strategie sviluppate per promuovere la resilienza del sistema ospedale e per preservare i processi di cura sia urgenti che ordinari. Nello scenario notturno viene valutata la robustezza del Pronto Soccorso, simulando diversi scenari di aumento delle risorse per individuare quello più efficiente ed efficace. Per valutare e comparare le prestazioni misurate in diverse campagne di simulazione è stato sviluppato uno specifico set di indicatori (KPIs). I risultati indicano chiaramente che, in caso di allarme di maxi emergenza, è ragionevole destinare immediatamente tutte le risorse disponibili al Pronto Soccorso, al fine di garantire la massima capacità di erogazione dei servizi medici. Viceversa, la riallocazione graduale delle risorse dal Pronto Soccorso alle attività ordinarie, anticipando in questo modo la loro parziale ripresa (recovery), consente un miglioramento delle prestazioni complessive del sistema ospedaliero, in termini di servizio ai pazienti, sia urgenti che elettivi. Per quanto riguarda lo scenario notturno, è emersa la convenienza di aumentare il personale disponibile in termini di chirurghi generali e anestesisti. La metodologia proposta supera alcuni dei limiti dell'attuale approccio presente in letteratura verso l'applicazione di tecniche di simulazione alla valutazione delle prestazioni del sistema ospedaliero in condizioni di emergenza. Questa ricerca mostra inoltre come ulteriori indagini potrebbero essere svolte approfondendo la rappresentazione dei processi effettuati in Pronto Soccorso o modificando la natura e l'entità dell'emergenza.3
Abstract (English version)
The aim of this thesis is to contribute to the research and practice advancements on Resilience and Business Continuity Management in hospitals. The results achieved offer useful insights to hospital managers for orchestrating hospital resources to cope with a maxi emergency event. Specifically, the response of the hospital system to a maxi emergency event applying the indications proposed by the PEMAF (Piano di Emergenza per il Massiccio Afflusso di Feriti) is evaluated. PEMAF is a set of organizational and procedural provisions that allows a hospital to cope with maxi emergencies, and it is an accreditation requirement for Italian hospitals with Accident and Emergency Department (A&E). Multi-method simulation under routine and emergency conditions, based on a case study to support the likelihood of the simulated-performances evaluation, is the basis of the research methodology applied in the study. All the parameters quantified to develop the simulator are related to Ospedale San Raffaele in Milan. Two simulation campaigns were carried out to analyze two different scenarios: the daytime and the night one. In the first scenario, the hospital system response is compared with two different strategies developed to foster the resilience of the overall system and to integrate and preserve urgent and ordinary care processes. In the night scenario the ED robustness is evaluated, simulating different scenarios of resource release escalation to identify the most efficient and effective one. In both the simulation campaigns a specific set of KPIs was developed. The results clearly point out that, in case of a maxi emergency alarm, it is reasonable to immediately allocate all the available resources to the ED, in order to guarantee the maximum emergency services delivery capacity. Conversely, shifting resources gradually from ED to ordinary activities, anticipating this way the recovery to normal operating conditions, enables the improvement of the overall hospital system’s performance, considering both urgent and elective patients. For what concerns the night scenario, it emerged the suitability of improving the available staff in terms of general surgeons and anesthesiologists. The proposed methodology overcomes the limitations of the current approaches towards the application of simulation techniques to the evaluation of hospital system performance in emergency conditions. This research shows also how further investigations could be carried out deepening the representation of the processes carried out in ED or modifying the nature and the magnitude of the emergency.4
Executive summary
i. Introduction
In modern societies, infrastructures are becoming more and more relevant and human activities rely on their functioning (Ouyang, 2014) in day by day routines as well as in critical contexts: transportation, communication, health are just some of the areas of the network our society is based on and which strongly depend on the availability of infrastructures. As a result it raised along the years the necessity to designate critical infrastructure (Ci) to be protected in order to serve the population in case of emergency. In the most advanced countries, such as United States and Europe, but also Japan, Healthcare is considered as Ci. Indeed, Hospitals, clinics and public health systems have a critical position in the overall network of Cis for its role in delivering primary services to the population in the event of a crisis and in daily routines. Healthcare system criticality in case of disasters and high-stress events such as earthquake or terroristic attack is even more significant since, by one side, physical damage to these facilities or disruption of their operations could deteriorate the outcome of an emergency situation and, on the other side, demand of services and patients to be treated increases significantly with respect to day by day activities. This means that criticality does not emerge just from the necessity of protection, but also from the required flexibility to increase capacity. Towards the objective of a structured approach to guarantee the continuity of medical services in any circumstance, the concept of resilience is surely that with the highest momentum.
5 ii. Literature research and thesis proposition
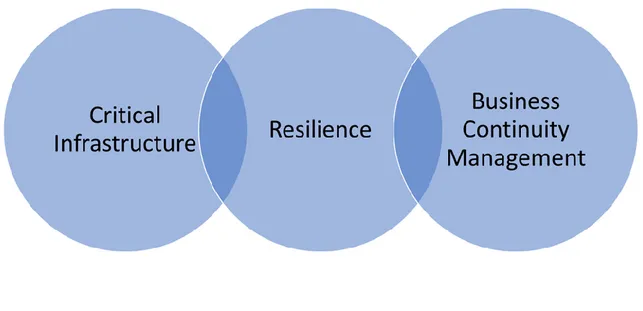
The first step of the thesis development process was a review of the already existing contributions, with the aim of understanding the state of the art and identifying knowledge gaps to be filled. In particular the research has been conducted around the concepts of Resilience, Business Continuity Management (BCM) and Critical Infrastructure concerning healthcare. A common logic has been identified laying behind the majority of the contributions retrieved and along its main building blocks a cross sectional analysis has been conducted focusing therefore on the scope of work, the threat considered and the KPIs analyzed in the literature basis.
The literature review revealed gaps in the areas related to the development of business continuity plans and resilience capabilities to deal with maxi emergencies. In particular when it comes to compare different allocation of resources strategies to reconfigure processes in case of maxi emergency. Indeed, the interruption of ordinary activities is currently the most diffused decision to guarantee the maximum medical services delivery capability to Emergency Department (ED) in serving urgent patients. In addition, no particular attention is dedicated in literature to the analysis of the transient from normal operations configuration of resources to the emergency one and reverse. It arises therefore room for improvement in the comparison of different approaches towards the management of transients, with the purpose of fostering resilience at an hospital system level. The focus of the thesis was thus set on assessing the suitability of different resources allocation strategies oriented to maximize the continuity of ordinary medical services without worsening ED capability to serve the demand arising from emergency. In addition, from the interaction with the Ospedale San Raffaele (OSR), it emerged the necessity of analyzing different scenarios, in particular to distinguish the one characterized by an emergency occurring in working hours from the one during the night. The study methodology was a quantitative assessment based on numerical and multi-method simulation. In particular the analysis has been based on the information derived from the Ospedale San Raffaele (OSR) case. The main idea was to set up a systematic comparison of the resilience level of the hospital system facing a maxi emergency under different strategies of resources allocation. In the scenarios simulating an emergency triggered during working hours, the logic driving the work was to determine a potential improvement with respect to the current
6
procedures to manage transients from normal operations resources configuration to the emergency one and reverse. Current strategies have been derived from the so called PEMAF (Piano di Emergenza per il Massiccio Afflusso di Feriti). On the other side, in the scenario simulating an emergency triggered during the night, it has been conducted an analysis with the purpose of identifying the critical resource determining ED medical services delivery capability to red patients in the temporal development of the emergency, and the most efficient way to improve it.
iii. Design of the simulation system and definition of the simulation campaigns
To sustain the research objective a simulator was developed through Anylogic, a multimethod simulation modeling tool. The simulation system design process was developed starting from a deep analysis of the processes carried out in OSR and on the available resources. The system was presented first in its normal operations conditions, so in its day by day routine. The overall scope of work has been split in sub-processes: for each of them it has been described activities, procedures and the rules that govern it. In particular it has been dedicated specific attention to the care processes undertaken in ED, in the Operating Block (ORs), in Intensive Care Units (ICU) and to those of hospitalization in wards. Each of these areas was analyzed independently and according to the way it interacts with the others in order to propose a schematization of the different processes. Thanks to this rationalization, all the resources consumed by the system are identified. Afterwards it was described the representation of the system in the software environment. The last phase corresponds to the description of the reconfiguration of resources to deal with maxi-emergencies.
The overall simulation system design relied on different sources of information, first of all a direct observation of the ED system and the interaction with the OSR ED SAD dr. Faccincani. In addition it was analyzed in depth the plan produced by OSR to accomplish with the legal requirement for all hospitals to have both external and internal emergency plans to cope with a Maxi-emergency maintaining a standard of treatment of patients comparable to that granted to the single patient. In particular it was considered the logic proposed by the so called PEMAF (Piano di Emergenza per
7
Two different streams of analysis were identified along the simulation system design process and they represent the main topics assessed through the simulator coherently with the objectives set for the thesis. They can be summarized as follows:
1. PEMAF rigidity in activation and deactivation; 2. Night scenario medical services delivery capability;
The first one refers to the on/off approach stated in the plan that consists in activating and deactivating resources reconfiguration in one single step. The main consequence of this approach is the ordinary activities interruption as soon as the plan is activated and resumption when it is stopped. This approach is the one suggested by the PEMAF, it is summarized in figure0A and along the thesis it has been named “As-is” strategy.
Figure0A Current medical services delivery capability distribution logic
Given these two premises, the simulator will be exploited to compare hospital system performance in responding to a maxi emergency applying the current strategy suggested by PEMAF and two more “flexible” strategies summarized in Figure0B and Figure0C. In particular, for this work thesis, ordinary medical services delivery capability is assumed as represented by the resources dedicated to ordinary patients in the operating block and wards. According to the logic proposed by the strategy named “StepsOnOff” ORs and beds scheduled to be assigned to ordinary patients are, conversely, allocated to demand arising from emergency progressively in time, as well as they are reallocated to ordinary patients gradually once the peak of patients arrival is over.
Me d ical se rv ice s d eliv ery cap ab ili ties Time - Emergency
"As-is" PEMAF logic
ED
8
The so called “StepsOff” strategy consists in an immediate allocation of all the available resources to the ED as in the “As-is” strategy, but a gradual reallocation of resources to ordinary activities in the transients from emergency configuration of resources to normal operations.
All the strategies were analyzed both in a scenario simulating an emergency triggered during the morning and during the afternoon.
0 0.1 0.2 0.3 0.4 0.5 0.6 0.7 0 2 4 6 8 10 12 14 0 15 30 45 60 75 90 105 120 135 150 165 180 195 210 Pa tient s ar riv al Me d ical se rv ice s d el. ca p . Time - Emergency
"StepsOnOff" Logic
ED medical services delivery capability
Ordinary medical services delivery capability EM arrival rate 0 0.1 0.2 0.3 0.4 0.5 0.6 0.7 0 5 10 15 20 Em erge cy p at ie n ts arriv al Me d ic als erv ic es d eli ve ry cap ab ility Time
"StepsOff" logic
ED medical services delivery capability Ordinary medical services delivery capability EM arrival rateFigure0B, “StepsOnOff” strategy
9
The second simulation campaign was focused on the scenario simulating an emergency triggered during the night. It was analyzed the current procedures and strategies to deal with maxi emergency in this scenario. It was proposed a time based analysis, in order to evaluate ED capacity of response to the sudden influx of patients in time, and not just according to the available staff, which is the current approach in OSR. Subsequently it was proposed an analysis on different scenarios proposing an increase in the availability of a different resource (staff or spaces) per scenario, in order to identify the one determining the highest improvement in ED medical services delivery capability. To structure the simulation campaigns to be undertaken, it was assessed each of the three variables characterizing the cross sectional analysis on the literature basis: threat, scope of work and KPIs. In particular it was established stochastically a stressful event to be replicated deterministically in each simulation. In Figure0D it is depicted the temporal development (morning scenario) of patients arrival in the emergency event simulated. Red patients are 18 while the remaining 27 patients are yellow. A traumatological external event is considered. It is important to notice that this is extremely realistic scenario since numbers and percentages of patients are similar to real recent events, such as terroristic attacks.
0 5 10 15 20 25 30 35 40 45 50 1600 1650 1700 1750 1800 1850 Age n ts in jec ted
Minutes from the beginning of the simulation
Daytime scenario - Morning
10
Particular attention was dedicated to the structuration of a proper set of KPIs, considered as a lever to achieve the results set for the thesis. For what concerns the first simulation campaign, patients waiting time was selected as the parameter to base the analysis on. The AHP method was applied to assign weights to patients waiting time in different steps and phases of their care processes. The results of the AHP are reported in table0A. They have been applied to create the indicator “I” as the weighted average of the different classes of patients’ (reported in the first column of table0A) waiting time for each minute of the simulation. It is assumed as waiting time representative of the 6 different categories of patients, the one of the last patient terminating its period of awaiting. In this way “I” is expected to give a representation of the overall hospital system performance (in terms of waiting time) along the simulation. 9 simulations have been run for each scenario, in order to compute the average trend of “I”.
Starting from “I” it was determined the indicators “R’ ” and “R” as described below.
𝑅′= ∫ "𝐼"
𝑅𝑒𝑡𝑢𝑟𝑛 𝑡𝑜 𝑛𝑜𝑟𝑚𝑎𝑙 𝑜𝑝𝑒𝑟𝑎𝑡𝑖𝑜𝑛𝑠 𝐹𝑖𝑟𝑠𝑡 𝑀𝐸 𝑝𝑎𝑡𝑖𝑒𝑛𝑡
𝑅 = 𝑅′𝐵𝑎𝑠𝑒𝑙𝑖𝑛𝑒 𝑅′𝑆𝑡𝑟𝑎𝑡𝑒𝑔𝑦
To complete the analysis of the first simulation campaign, beside “R” it was considered the number of red patients at risk (PAR) in ED, so those patients not starting the care process in a sufficiently rapid manner.
Yellow - ED
0.132
Yellow - OR
0.088
Green - ED
0.036
Red - OR
0.555
Ordinary - OR
0.153
Ward
0.036
11
For what concerns the second simulation campaign the KPIs selected are PAR and the number of patients treated at level of care lower than the standard (LLC), evaluated as the number of patients assigned to a team not composed by the expected staff.
iv. Results summary
Summarizing the results, the simulations run for assessing the hospital system performances in facing a maxi emergency through the PEMAF in OSR highlighted potential room for improvement. For what concerns the first simulation campaign, results are summarized in table0B.
Morning scenario Afternoon scenario
“R” PAR [pt/sim] “R” PAR
“As-Is” 0.60 0.11 0.87 0
“Steps On-Off” 0.72 1.7 0.89 2.1
“Steps Off” 0.66 0.11 0.91 0.11
An additional parameter evaluated for each scenario is the time necessary for the system to return to the average performance level characterizing normal operations.
The results suggest that in the transient from normal operations to the emergency configuration of resources, the most appropriate strategy is that allowing to allocate all the available resources in ED, to deal with the sudden influx of patients. In this case it has been found confirmation on the validity of the strategy currently applied in OSR. The second finding regards the transient from the emergency configuration of resource to normal operations. In this case the simulator suggested a potential improvement with respect to the PEMAF produced by OSR. In facts there are evidences highlighting the suitability of a gradual resources shifting from ED to ordinary activities. The main advantages are realized in a reduction of the disservice to elective patients and of
12
unwanted effects on the system. Particularly relevant is the possibility to reallocate ORs to the most urgent scheduled surgeries. Last, the analysis carried out on the first simulation campaign consisted in comparing two different scenarios, one in which the emergency is triggered during the morning and one during the afternoon. The results suggest a higher improvement in hospital system performance due to resilient strategies when the pression over the system is higher. Referring to the two scenarios, it seems reasonable to claim that the afternoon scenario is less critical than the morning one. For what concerns the second simulation campaign, results are reported in table0C which refers to the entire emergency lapse of time and proposes the comparison of ED performances in responding to the emergency in the “As-is” scenario and in scenarios in which the availability of one resource per simulation (first column) is increased (last column). 10 simulations have been run for each scenarios and
Resource increased Avg PAR
[#pat/sim] Avg Max WT [min] Avg Lower LOC [#pat/si] Units added As-is 8.2 37.7 5.4 ShockRoom 8.40 35.80 4.90 +1 6.67 35.35 5.26 +2 Anesthesiologist and general gurgeon 3.90 28.10 3.00 +1 3.63 29.10 1.09 +2
Nurse and Oss 7.20 38.30 3.20 +1
7.20 44.90 3.70 +2
Trauma Team 3.50 33.60 3.20 +1
2.20 30.40 3.70 +2
Comparing the results with the ones characterizing the “As-is” scenario, it seems evident how increasing simply the number of shock rooms, so in general spaces, instruments and technology, does not improve the capability of the ED to receive red patients. Results are clear enough to affirm that, very likely, adding 1 anesthesiologist and 1 general surgeon is sufficient to reduce significantly the number of patients at risk as well as the number of patients treated at a level of care lower than the standard. The
13
lapse of time in which the ED is able to serve the patients arising from the emergency passes from 95 minutes to 120, as a symptom of the higher robustness of the system.
v. Conclusions: implications, limitations and avenues for development
Beside the findings described in the previous paragraphs, it is worth to highlight the relevance of the methodology applied and the tool selected to sustain the analysis. In facts, the method developed for this work thesis is an evidence of the suitability of
events based simulation integrated with system dynamics to obtain a quantitative
assessment of the impact of an emergency on the overall hospital system processes. The methodology presented in this work study overcomes some limitations of the existing approaches towards the application of quantitative methods to evaluate the response of hospitals facing maxi emergency. In particular it suggests the possibility to maintain a systemic approach towards the overall hospital system keeping into considerations the most relevant processes and activities determining the performance of it. This is obtained both through a proper conceptualization and translation into the software of the care processes but also through a rational definition of KPIs able to integrate different dimensions of the hospital performance in serving patients in case of maxi emergency (Indexes named “I” and “R”). In particular, this work thesis proposed the application of this methodology towards the evaluation of different resources allocation strategies, highlighting the way resilient enabling strategies permit to improve the performance of the hospital system. This represents a contribution to fulfill the gap highlighted in literature, in the development of resilience capabilities in hospital, in particular to support the definition of business continuity plans. It is important to notice that the findings highlighted in the previous paragraphs can be viewed from two different perspectives, both helpful to fuel a more conscious resilient approach towards the resource management in hospital in case of maxi emergency. First of all, understanding and experimenting ways to reconfigure existing assets in order to determine the most appropriate one to face disruptive events is a resilience enabling practice. The second interpretation that could be given to the findings mentioned above, is the creation of a set of explicit knowledges that can sustain the HDM in the decision processes in case of emergency. In addition, the simulator developed can be considered
14
as an useful decision support tool for hospital managers both at a strategic and tactical level.
At the end of the thesis some questions and several ideas concerning the obtained results raised, starting from the limitations and the assumptions made in this work which can be the starting point for further improvement. First of all, it is possible to see a weakness of the model in the representation of the medical area of the ED (green and yellow patients). Along the simulation system design process, in facts, a lower level of detail has been achieved in describing this area with respect to the one achieved in representing the flow of red patients. A deeper analysis on this area could open a further stream of analysis which is the one related to the best practices to be put in place to favor the process of ED immediate emptying in case of emergency. One of the most interesting aspects of the simulator produced is, in general, the possibility to consider it as a platform, as the core of a wider model potentially developable by expanding the modules considered. In the present work the ordinary activity of the hospital is represented mainly by ORs and wards, but it could be, of course, included many other areas of the hospital, or disentangled the ones considered in sub-areas according to the different specialties. One last remark refers to the possibility, even considering the same structure of the simulator presented in this model, to expand the analysis modifying the event simulated, both in terms of intensity and nature.
16 L’emergenza è come una scatola di cioccolatini,
18
Table of contents
Abstract (English and Italian version) 2
Executive summary 4
Table of contents 18
List of Figures 20
List of Tables 22
1. Chapter1: Introduction 24
1.1. Hospitals as Critical Infrastructures 26
1.2. Moving from Security to Resilience 26
1.3. Room for improvement and research value 27
2. Chapter2: Literature research 29
2.1 Literature search 29
2.1.1 Critical Infrastructure concerning Healthcare domain 31
2.1.2 Resilience concerning Healthcare domain 39
2.1.3 Business continuity management concerning Healthcare domain 48
2.1.4 Analysis of synergies and intersections between segments 57
2.1.4.1Resilience and Business continuity management concerning
Healthcare domain 58
2.1.4.2. Resilience and Critical infrastructure concerning Healthcare
domain 59
2.1.4.3. Triple intersection 60
2.1.5. Literature cross sectional analysis 61
2.1.5.1. Threat 62
2.1.5.2. Scope of the study 63
2.1.5.3. KPIs 67
2.1.6. Gap identification and thesis objective 69
3. Chapter3: Simulation system design 73
3.1. Methodological approach 74
3.2. System representation 76
3.2.1. ED 76
3.2.2. ED – Hospital interfaces 103
3.2.2.1. Operating Block 103
3.2.2.2. Intensive care unit 113
3.2.2.3. Wards 117
3.2.3 “As-is” resources reconfiguration in case of maxi emergency:
PEMAF in OSR 126
3.2.3.1 OSR plan for resources reconfiguration in case of maxi
emergency 127
19
3.2.3.3 Resources reconfiguration in Anylogic 140
4. Chapter4: Simulation campaigns 154
4.1. Simulations development: Threat, Scope of the study and KPIs 157
4.1.1. Threat 157
4.1.2. Scope of the study 163
4.1.3. KPIs 165
4.2. Results validation 172
4.3. Simulations campaign 178
4.3.1. Simulation campaign 1 179
4.3.2. Simulation campaign2 192
5. Chapter5: Simulations campaigns: results discussion 195
5.1. Simulation campaign 1 196 5.2. Simulation campaign 2 220 6. Chpater6: conclusions 225 Annex1 233 Annex2 238 Ringraziamenti 240 References 242
20
List of figures
Figure 1 CI publications [2004-2018]... 32
Figure 2 CI publications, source ... 33
Figure 3 CI, representation logic ... 33
Figure 4 Resilience publications [2006-2018] ... 39
Figure 5 Resilience publications, source ... 40
Figure 6 Resilience, representation logic ... 40
Figure 7 BCM publications, [1994, 2018] ... 48
Figure 8 BCM publications, source ... 49
Figure 9 BCM representation logic... 50
Figure 10 Intersections analysis ... 57
Figure 11 Cross sectional logic ... 61
Figure 12 Cross sectional literature research logic ... 62
Figure 13 Sources of threats ... 63
Figure 14 Scope of the study ... 64
Figure 15 Vertical and Horizontal differentiation of activities ... 65
Figure 16 ED Rationalization ... 81
Figure 17 ED, Anylogic ... 85
Figure 18 ED interactions ... 86
Figure 19 Patients palette ... 87
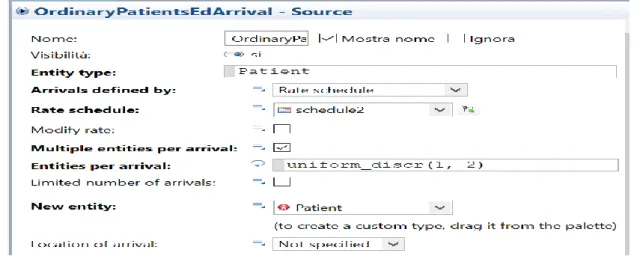
Figure 20 OrdinaryPatientsEdArrival source... 87
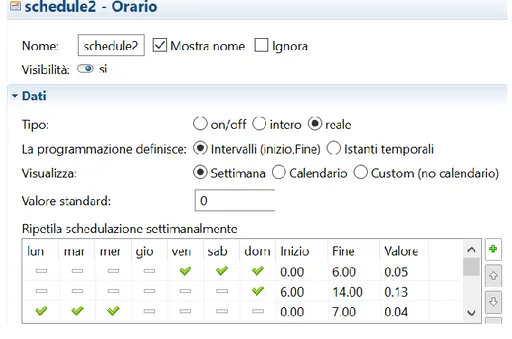
Figure 21 schedule2 ... 88
Figure 22 selectOutput12 ... 89
Figure 23 Medical area, Anylogic ... 91
Figure 24 queue2, Anylogic ... 91
Figure 25 Yellow patients waiting time computation ... 93
Figure 26 Yellow patients set of resources ... 94
Figure 27 ResourcePool, General Surgeons ... 96
Figure 28 Shock Rooms, Anylogic ... 97
Figure 29, ShockRoom ... 98
Figure 30 Seize7 ... 99
Figure 31 Seize6 ... 99
Figure 32 Red patients waiting time computation ... 100
Figure 33 selectOutput ... 102
Figure 34 Red patients destinations probabilities ... 102
Figure 35 ORs rationalization ... 105
Figure 36, ORs, Anylogic ... 109
Figure 37, ORs waiting time computation ... 110
Figure 38 ICU rationalization ... 114
Figure 39 ICU resources and descriptive parameters ... 115
Figure 40 ICU, Anylogic ... 116
Figure 41 ICUPatients source ... 116
Figure 42 New agents injection to ICU ... 117
Figure 43 Wards rationalization... 118
Figure 44 Wards, Anylogic ... 122
Figure 45 SurgicalWard delay ... 124
Figure 46 BedsFreed flow ... 124
Figure 47 ED desaturation rationalization ... 132
21
Figure 49 Patient pathway rationalization ... 137
Figure 50 ResourceReconfiguration event... 142
Figure 51 Resources reconfiguration transient in ED ... 145
Figure 52 selectOuput ... 146
Figure 53 seize1 ... 147
Figure 54 seize ... 147
Figure 55 Em7... 149
Figure 56 "Em7" afternoon scenario ... 150
Figure 57 Current medical services delivery capability distribution logic ... 156
Figure 58 Emergency arrival rates ... 160
Figure 59 Emergency event - morning scenario ... 161
Figure 60 Emergency event - afternoon scenario ... 162
Figure 61 Emergency event - night scenario ... 162
Figure 62 Waiting times collection ... 164
Figure 63 AHP hierarchy ... 168
Figure 64 Green patients waiting times - simulated ... 174
Figure 65 Green patients waiting times - real ... 174
Figure 66 Yellow patients waiting times - simulated ... 175
Figure 67 Yellow patients waiting times - real ... 175
Figure 68 Ordinary ORs waiting times ... 176
Figure 69 Yellow patients waiting times ORs ... 176
Figure 70 Hospitalization waiting times ... 177
Figure 71 Red patients waiting times ORs ... 178
Figure 72 medical services delivery capability PEMAF distribution ... 180
Figure 73 Emergency arrival rates ... 181
Figure 74 Steps On-Off strategy ... 182
Figure 75, Resource Reconfiguration ... 189
Figure 76, Baseline, "I" trend ... 197
Figure 77, Baseline, PAR... 197
Figure 78, As-is morning, "I" trend ... 198
Figure 79, "As-is" morning, PAR ... 199
Figure 80, "StepsOnOff" morning, "I" trend ... 202
Figure 81, "StepsOnOff" morning, PAR ... 203
Figure 82, "StepsOnOff" afternoon "I" trend... 204
Figure 83, "StepsOff" afternoon, "I" trend ... 208
Figure 84, "StepsOff" afternoon, "R" computation ... 209
Figure 85, OR Ord waiting time trend, "As is" scenario ... 216
Figure 86, "OR Ord" waiting time trend, "StepsOff" scenario ... 216
Figure 87, Analysis of the pression, afternoon scenario ... 218
Figure 88, Emergency temporal development, "As-is" scenario ... 221
Figure 89, Emergency temporal development, scenario +1gen surg, +1 anesth ... 224
Figure 91 Average patients arrival frequency along the day ... 233
Figure 92 Patients arrival frequency along the week ... 234
22
List of tables
Table 1 Queries ... 30 Table 2 Queries filtered per discipline ... 30 Table 3 Queries filtered on the source ... 31 Table 4 Queries filtered on the title ... 31 Table 5 Queries filtered on the abstract ... 31 Table 6 CI publications ... 38 Table 7 Resilience publications ... 47 Table 8 BCM publications ... 56 Table 9 Resilience AND BCM publications ... 58 Table 10 Resilience AND CI publications ... 59 Table 11 Triple intersection publications... 60 Table 12 Publications and services considered ... 67 Table 13 Understanding hospital disaster resilience criteria (adapted in Zhong 2013, from Bruneau et al 2003). ... 70 Table 14 ED processes, resources and parameters ... 82 Table 15 ED - Personnel ... 83 Table 16 ED – spaces ... 84 Table 17 ED - descriptive parameters ... 84 Table 18 ORs resources and descriptive parameters ... 106 Table 19 ORs staff ... 107 Table 20 ORs spaces ... 108 Table 21 ORs descriptive parameters ... 108 Table 22 ORs resourcePool modules ... 112 Table 23 schedule1 ... 113 Table 24 ICU resourcePools ... 117 Table 25 Wards resources and descriptive parameters ... 119 Table 26 Simulation modelling technique analysis ... 121 Table 27 Night shift resources ... 135 Table 28 Working hours resources ... 136 Table 29 Resources, descriptive parameters ... 138 Table 30 Parameters summary ... 153 Table 31 Emergency events delays ... 159 Table 32 Emergency events ... 160 Table 339A vector of weights ... 169 Table 34 Example - sequence of waiting times ... 170 Table 35 Simulated/real week parameters ... 172 Table 36Simulated vs real week - green and yellow patients ... 173 Table 37 StepsOnOff events ... 183 Table 38 Resource reconfiguration, EM2 ... 184 Table 39Em3, Em5 ... 185 Table 40 Em6, Em7 ... 186 Table 41 ORs steps on off allocation ... 186 Table 42 Steps off logic ... 187 Table 43 StepsOff events ... 189 Table 44 Em4, Em5, Em6, Em7 ... 191 Table 45 Final synoptic campaign1 ... 192 Table 46 Logic simulation campaign2 ... 193 Table 47 Final synoptic simulation campaign2 ... 194 Table 48, Baseline scenario ... 196 Table 49, As-is scenario ... 198 Table 50, "As-is" morning, R computation ... 199 Table 51, "As-is" afternoon, scenario ... 200
23 Table 52, "As-is" afternoon, "I" trend ... 200 Table 53, "As-is" afternoon, "R" computation ... 201 Table 54, "StepsOnOff" morning scenario ... 202 Table 55, "StepsOnOff" morning "R" computation ... 203 Table 56, "StepsOnOff" afternoon scenario ... 204 Table 57, "StepsOnOff" morning, "R" computation ... 205 Table 58StepsOnOff afternoon, PAR ... 205 Table 59 "StepsOff" morning scenario ... 206 Table 60 "StepsOff" morning, "I" trend ... 207 Table 61, "StepsOff" morning, "R" computation ... 207 Table 62, "StepsOff" afternoon scenario ... 208 Table 63, Simulation1, final synoptic ... 209 Table 64, "OR Ordinary" ... 211 Table 65, Yellow OR ... 212 Table 66, Hospitalization ... 213 Table 67, "OR Ord" ... 215 Table 68, Afternoon morning comparison, "R" ... 219 Table 69, Afternoon morning comparison, time for recovery ... 219 Table 70, "As-is" night scenario analysis ... 221 Table 71, "T" computation, “As-is” scenario... 222 Table 72, additional resources analysis... 223 Table 73, "T" computation, +1gen surg, +1 anesth scenario ... 224 Table 75,76,77 Patients arrival rate along the week ... 236 Table 76 Pairwise comparison matrix ... 238 Table 77 yellow patients in ED/OR weights ... 238 Table 78 Normalized matrix ... 238 Table 79 first level vector of weights ... 238 Table 80 Computation of the consistency ratio ... 239
24
CHAPTER1
INTRODUCTION
In modern societies, infrastructures are becoming more and more relevant and human activities rely on their functioning (Ouyang, 2014) in day by day routines as well as in critical contexts: transportation, communication, health are just some of the areas of the network our society is based on and which strongly depend on the availability of infrastructures.
However, recent catastrophic events threaten the functioning of infrastructures: natural disasters such as the hurricane Katrina (August 2015) and the Fukushima earthquake (11th march 2011), or terroristic attacks, like, of course, New York 11/09, but also the ones that hit Madrid (11th march 2004) or London (7th July 2005) and black outs like
the one that occurred in Italy on 28th September 2003 are example of events showing
the vulnerability of our society. Reasons for critical infrastructures becoming more vulnerable are generally recognized as the higher complexity and (Perrow, 1999), interconnectedness (Kröger, 2008) of our systems.
As a result it raised along the years the necessity to designate critical infrastructure (Ci) to be protected in order to serve the population. With this purpose, schemes, criteria and quantitative models are available, at a European level in an homogenous way, but also in the United States and in all the advanced countries of the world. Conversely, instruments to identify the necessity of protection of Ci, how to satisfy it, and to enhance its capacity to serve the population in disruptive events are still generic: of course Telecommunication, Transportations or Energy sectors acted as a tow in the process of
25
definition of such instruments and a consistent body of knowledge was developed; the same cannot be applied to all the domains presenting Cis, such as the Healthcare one. Consequences of this delay in some sectors are many, from a Ci protection culture growing slowly and unevenly in different areas of our societies to the inefficacy of instruments.
Despite the relevance of the topic, there is not yet an unanimous agreement on the criteria that make critical an infrastructure, and they differ from country to country. None of the definitions of what constitutes a CI, given over the years, could be considered rigorous. They bound the issue somewhat, but leave plenty of room for interpreting which infrastructures fit the definition (Moteff, Copeland & Fischer, 2003). In 2008 the European commission defined Cis as “asset, system or part thereof located in Member States which is essential for the maintenance of vital societal functions, health, safety, security, economic or social well-being of people, and the disruption or destruction of which would have a significant impact in a Member State as a result of the failure to maintain those functions'” (EC, 2008; art. 2a). As we can get from the definition, the understanding of critical infrastructure is necessarily negative, so understanding what may be the result of the critical infrastructure being lost or damaged. Therefore, according to the European commission, general areas of critical infrastructures are many, energy installations and networks, communications and information technology systems, banking facilities, health care facilities such as hospitals and research facilities, pharmaceutical production, means of food production and distribution, water storage and delivery, transport facilities, production, storage and transport of hazardous goods, and government services (European Commission, 2005). Similarly the latest PPD-21 (White House, 2013) identified 16 CI sectors in the US, namely: Chemical; Commercial Facilities; Communications; Critical Manufacturing; Dams; Defense Industrial Base; Emergency Services; Energy; Financial Services; Food and Agriculture; Government Facilities; Healthcare and Public Health; Information Technology; Nuclear Reactors, Materials and Waste; Transportation Systems; Water and Wastewater Systems. Even if lists and results are similar, we can say that CIs are of different importance in each individual country and each has defined its own CI sectors
26
1.1 Hospitals as critical infrastructures
In the most advanced countries, such as United States and Europe, but also Japan, Healthcare is considered as CI. Hospitals, clinics and public health systems, in particular, have a critical position in the overall network of Cis for its role in delivering primary services to the population in the event of a crisis and in daily routines. Healthcare system criticality in case of disasters and high-stress events such as earthquake or terroristic attack is even more significant since, by one side, physical damage to these facilities or disruption of their operations could deteriorate the outcome of an emergency situation and, on the other side, demand of services and patient to be treated increases significantly with respect to day by day activities. In addition, usually, hospitals are recognized as a point of reference to look for information or repair in chaotical situations. This means that criticality does not emerge just from the necessity of protection, but also from the required flexibility to increase capacity.
Despite the relevance of healthcare infrastructures, traditionally medical preparation for mass casualty and potentially disruptive events management have focused more on the scene and all the pre-hospital sectors, so more on what occurs out of the hospital, rather than on guaranteeing continuity of medical services in-hospital. A turning point in the approach towards this issue can be identified in the twin tower attack, 09/11, since it showed the vulnerability of the healthcare system and infrastructures. As a result, the homeland department of the US government produced the Medical and Health Incident Management System (MaHIM), (Barbera and Macintyre,2002) which is a comprehensive and highly detailed functional system description for mass casualty medical and Health Incident Management. This document is particularly relevant because, beside practical and technical indications, it highlighted the necessity to start approaching hospitals as a critical infrastructure, determining major functional areas, activities and services that are essential for providing care to the patients reaching the facility.
1.2 Moving from security to Resilience
Towards the objective of a structured approach to guarantee the continuity of medical services in any circumstance, the concept of Resilience is surely that with the highest momentum. Traditional approaches towards business continuity and security in
27
general, that are common in healthcare, have always been considered to offer efficiency under normal conditions but they may create gaps in care continuity and hide hazards that become evident when operations shift outside of normal conditions (C.Nemeth, 2010). However, during the 2005 World Conference on Disaster Reduction (Kobe, Japan) the model of ‘safe and resilient hospitals’ was promoted as a key component of disaster risk reduction planning in the healthcare sector and in October 2009, the National Infrastructure Advisory Council (NIAC or Council) issued “Critical Infrastructure resilience” a study that examined how critical infrastructures could become more resilient. These documents represent strong endorsements towards policies that “ensure that all new hospitals are built with a level of resilience that strengthens their capacity to remain functional in disaster situations” (World Conference on Disaster Reduction: 2005). In addition the NIAC introduced an interesting specification considering resilience not only to be a fundamental strategy that makes our communities better prepared, and our nation more secure but also to be often the most flexible and cost-effective strategy to ensure continuity of services and functions and to minimize the impact of disruptions
Despite its relevance, compared with some of the concepts developed along the years to define hospital capacity to cope with disasters, such as hospital preparedness, hospital security, hospital safety, surge capacity etc. resilience results to be the object of a smaller amount of studies and researches, despite these disaster concepts occur in isolation and therefore provide limited perspectives of disaster response capacity, in particular for highly uncertain, interdependent and dynamic environment, resulting in gaps, and, duplication (Zhong, 2013). On the other side resilience represents a property of the entire system and, if properly measured, can provide significant insights on hospitals capacity to ensure continuity of medical services in the event of crisis.
1.3 Room for improvement and research value
At the state of the art, hospital resilience is the new emerging trend, proposed and incentivized by international and local governments to ensure continuity. Different frameworks and tools have been proposed by international organizations such as World Health Organization or the Pan American Health Organization to assess safety and resilience of hospitals. A very wide range of concepts has been actually developed within the resilience framework, and some recurrent domains can be identified: hospital
28
disaster preparedness and resources (disaster planning and procedure, crisis communications, community connectedness, available resources and logistics management), continuity of essential medical services (emergency medicine, medical continuity and surge capacity), recovery and adaptation (recovery, evaluation and adaptation) (Zhong, 2013). In particular, the assessment of continuity of essential medical services reveals the necessity of procedures to identify, prioritize and maintain essential functions. Despite a significant body of knowledge is already available on the identification of essential functions, the analysis on the possible strategies to maintain them is still lacking. In fact, some studies present the topic of hospital disaster preparedness or crisis management, but a systematic and comprehensive analysis to evaluate possible strategies to improve hospital resilience is still missing. In this context, this thesis overarching goal is to contribute to fulfill this gap, proposing a model and a method to assess and compare possible strategies to guarantee continuity of medical services; this model and the subsequent analysis are developed to improve and support the transition from security to resilience, evaluating different strategies for business continuity in terms of resilience, both from a strategic point of view, so in terms of resources dimensioning and allocation, and a tactical one so to determine effective strategies to improve resources management.
29
CHAPTER2
STATE-OF-THE-ART REVIEW
In this chapter it will be described the starting point of the thesis which is a systematic review of the literature. First, it has been carried out a research in order to gather all the relevant contributions within the domains of interest of the thesis, having this way a general picture of the state of the art. In particular the research has been conducted around the concepts of Resilience, Business Continuity Management (BCM) and Critical Infrastructure (Ci).
Then it has been performed an analysis on the collected knowledge, categorizing and classifying contributions with the purpose of identifying potential gaps in literature. From this analysis it will be then proposed the thesis proposition in detail trying to highlight its significance and value
2.1 Literature research
In this paragraph it will be described the different steps of the process applied to gather the contributions from the literature around the topic of the thesis, and how they have been evaluated in order to reduce the initial amount to a body of knowledge relevant for the scope of the thesis, and exclude those contributions out of it. Later on, it will be discussed the way the analysis has been organized in order to represent all the contents recognized as relevant.
30
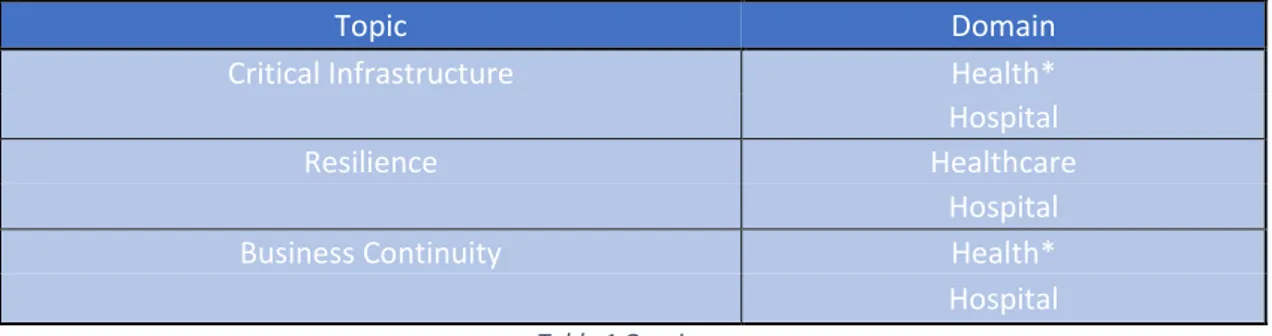
Major electronic databases for publications, Scopus and WebOfScience, were searched to retrieve relevant publications, including articles, conferences reports and documents that may be applicable to study aims and objectives. The very first scan of the available literature has been run through 3 search terms, namely, (1) “Business Continuity”, (2) “Resilience” and (3) “Critical Infrastructure”. To limit the research at the healthcare context, a domain has been set, fixing “health* or hospital” as key words. For what concerns the Resilience topic, “hospital” and “healthcare” have been fixed as domains since, researching “Resilience” AND “health*”, a big portion of non-coherent contributions were included in the research. So basically the three sets of terms have been “Resilience” AND “healthcare” OR “hospitals”, “Business Continuity” AND “health*” OR “hospitals”, “Critical Infrastructures” and “health*” OR “hospitals”.
Topic Domain
Critical Infrastructure Health*
Hospital
Resilience Healthcare
Hospital
Business Continuity Health*
Hospital Table 1 Queries
All the types of documents have been included, so articles, conference paper, review and conference review. Subjects areas have been limited to health professions, engineering, business, management and accounting and decision strategies etc. so excluding all the medical disciplines, such as Oncology, Psychology etc. Results have been ordered according to the relevance score assigned by Scopus and WebOfScience. Results, in terms of numbers, of this first round are summarized in the table2
Table 2 Queries filtered per discipline
The remaining items have been first filtered on the title of the source, in order to further exclude those topics out of the scope of the thesis. Results are summarized in table3, keeping the division into the three domains.
31 Table 3 Queries filtered on the source
Further step of the analysis consisted in filtering according to the title. Results are summarized in table4
Table 4 Queries filtered on the title
In order to define the final set of documents relevant for the scope of the thesis, a further step has been made analyzing the remaining items in terms of abstract and introduction in order to identify clearly the topic treated. Furthermore, from this analysis, it has also been possible to identify a structure to classify the knowledge gathered through this methodology. In order to be as complete as possible, relevant papers have been added snowballing from the publications already considered. Final results are described in table5
Table 5 Queries filtered on the abstract
These have been examined at an higher level of detail and contents have been classified in the structure considered as the most suitable to represent the body of knowledge collected. Starting from this classification it has been possible to develop a deeper understanding of the main areas of interest.
2.1.1 Critical Infrastructure concerning healthcare domain
To present the characteristics of the literature collected revolving around the concept of CI applied to the healthcare sector, it is worth to notice that actually it’s just from the early years of the new millennium that hospitals, and the healthcare system in general, have been designated as a CI. Some authors identify 2003 as the first time. In that year
32
Homeland security department of the Unites States, in the National Strategy for the Physical Protection of Critical Infrastructures and Key Assets (2003) identified a set of essential infrastructure systems that cover a large number of sectors, including also the public health networks. As a result, the first relevant contributions in literature on the topic can be found at the beginning of the century, with an increasing development in the subsequent years.
Figure 1 CI publications [2004-2018]
In addition, considering the time span within which the literature related to the subject developed, it results, reasonably, to be still “immature”, since knowledge emerges to be still technical and practical, rather than theoretical. The level of maturity can be assessed looking at how the collection of documents and productions is structured. As a matter of fact, less than half of it comes from articles and academic papers. On the other side, a significant portion of the production regarding the concept of CI applied to the healthcare domain is still available as a conference paper or a book chapter. This can be considered as a clue of the low level of maturity of the knowledge around this topic. N u m b er o f pu b licati o n s
33 Figure 2 CI publications, source
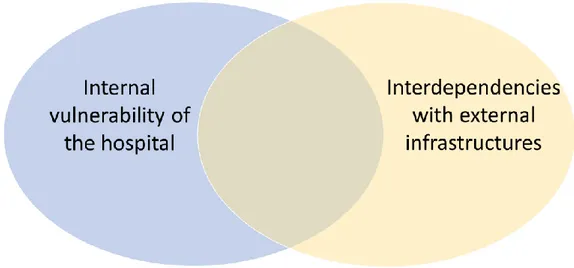
Moving to the analysis, it is possible to affirm that the CI concerning Healthcare domain literature can be segmented into two streams, one focusing on the internal vulnerability of the hospital, and one on the external interdependencies. Of course it exists a certain degree of overlapping among the two: the factor considered to split the two segments lays in the approach towards the hospital. In the first case the focus is within the boundaries of the hospital, while in the second one the hospital is analyzed as a node of a network. It will be discussed also the intersection among these two approaches.
Figure 3 CI, representation logic
The first segment is about the assessment of the internal vulnerabilities of the hospitals as a facility. All the papers collected, in fact, propose tools and methods to assess hospital performances and the impact of hazards on them. Methods are mainly qualitative, such as surveys or semi structured interviews. These are developed assessing the impact of the considered hazard in past events, so mainly in terms of
Critical Infrastructure concerning Healthcare
Article Book Chapter Conference Paper Review
34
“lessons learnt”. Approaches are rarely all hazard, more frequently they are strongly oriented towards a certain hazard such as terroristic attack or extreme weather events. The first driver of analysis in this stream of literature is the identification of all the critical factors that may result in a source of vulnerability, in order to deal with the complexity of the hospital, where the performance levels depend on different factors. In Miniati, Iasio, Alexander, 2011, “the assessment […] includes the availability of staff, organizational procedures, developmental factors and physical and architectural elements” so, to synthetize, structural, nonstructural and organizational factors. This classification of factors will be shared also by other authors. In addition, According to Yavari, Chang, Elwood (2010) “Hospital functionality may be disrupted by structural damage to medical facilities, damage to non-structural elements or medical equipment, disruption of internal and external utilities and lifelines, or lack of key personnel due to fatalities, injuries or inability to access the hospital”. This adds to the classification of factors mentioned before, also that of supplies. Structural, Non-structural, organizational and utilities are, to wrap up, the four major systems of hospitals treated in the body of knowledge revolving around the topic of Hospital as CI and that may induce its vulnerability. Non-structural factors represent a core topic for the majority of the papers and it is worth to detail how they are dealt. This is because, if on the one hand structural engineering has taken giant steps in making hospitals safe in its primary elements, it is not the same for what concerns non-structural factors. As an example, The California Seismic Safety Commission (CSSC 2000) found that the structural performance of hospitals in the Northridge earthquake (Los Angeles, 1994) was generally excellent. However, they also found that the nonstructural performance in these new facilities was often less than acceptable. The relevance of non-structural factors is the concern of many of the papers considered. Goulet in 2007 showed that as much as 80% percent of the earthquake damages to hospitals is due to nonstructural components (Goulet et al. 2007). A different degree of maturity in the readiness of structural factors compared with the one of non-structural factors is a common point to many of the papers considered. What differs is the category of non-structural factors representing the object of the research. In particular two different categories of factors are assessed: the vulnerability of non-structural physical elements, and the vulnerability of non-structural non-physical, so functions and processes. For what concerns the first category, in Reiser, Mahoney, 2012 it is proposed a list of non-structural elements that
35
resulted to be a threat to life safety during the earthquake in the Bio-Bio province (Chile, May 2010). It considers elevators, Equipment scarce anchorage, Equipment on Wheels and others. For what concerns the second category, it is worth to have as a reference the priority definition of hospital functional areas during disasters proposed by the Word Health Organization in the Operational Framework for Building Climate-Resilient Health Systems (2015). An index representing the importance in emergencies is assigned to all the clinical and support services. A similar analysis is proposed in Myrtle, 2005, in which it is stated that “Trauma Unit, Surgical Suites, and Intensive Care areas form the critical core patient care areas in case of emergency”. As it will be described later, these kind of considerations are conceptually linked with the two remaining domains (Resilience and BCM)
The second stream refers to the assessment hospital external interdependencies as a source of risks in case of cascading effects, and the evaluation of proposals and solutions to improve the response towards emergencies. Both direct and indirect effects of other infrastructures failures on the performances of the hospital are considered. In this case methods are mainly quantitative with a large application of simulation techniques, from Petri Net modelling to System Dynamics. The relevance of the topic is agreed by all the contributions collected; according to Rinaldi, 2004, “omitting interdependencies will at best limit the validity of analysis and at worst lead to bad or inappropriate policies and decisions during crises or severe infrastructure disruptions”. Also in Prieto 2012 it is stated that “identifying […] infrastructure interdependencies is essential since healthcare systems do not operate in isolation”. A factor identified as critical in many papers, and enhancing the level of interconnectedness of hospital with other infrastructures, is the dependence on technology. The level of vulnerability induced by the interdependencies of the hospital with other CIs is found to grow steadily as the diffusion of technology and IT systems. In Setola, 2007 it is described the negative side of the technological dependence of hospitals. If by one side this improves the service towards patients, on the other side "unfortunately, this [dependence on technological infrastructures] introduces many dependencies and interdependencies links among the different components”. As a result “even if a network-based healthcare system is more robust than a model composed of many single ‘assets’ with respect to components’ failure, it appears to be more fragile to ‘catastrophic’ events". Also in Moon, Lee, 2013 it is possible to identify this concern,
36
as it is recognized that “as infrastructures of a modern society have become increasingly interdependent, it is becoming more common to face unanticipated cascading failures, so-called rare disasters”. Similarly in Rejeb et. al, 2012, it is affirmed that “e-Health systems recognize the benefits of new Information and Communication Technology (ICT) in the delivery of healthcare services, but while these modern technologies have enhanced practices in the healthcare sector, the potential of failures to interrupt a process is still important”. On the other side, “the interconnectedness across scale and networks can encourage greater flexibility in planning and better coordinated response during disaster” and also "The key to the successful adaptation of an organization to a changing environment is to recognize and leverage the various sub-systems associated with that organization” (Barabasi and Crandall 2004). These last two contributions do not have a specific focus on healthcare, but resulted to be applicable to the healthcare sector as well.
Before going on it is necessary to specify that dependencies and interdependencies between infrastructures are treated as two different concepts. If by one side dependencies are univocal relationships, Rinaldi defines interdependency as a bidirectional relationship between infrastructures (Rinaldi 2004). One of the principal driver of analysis within this segment is exactly the identification of the interdependencies between the hospital and the overall network of infrastructures. Always in Setola 2007 the interdependencies with other networks are emphasized, focusing on three types of networks: In-hospital network, e-health services, National CIs (Setola 2007). Some complete frameworks for the identification of interdependencies and related risks are available. In Polinpapilinho F. Katina , 2014 six categories of interdependencies are proposed: Physical, Cyber, Geographical, Logical, Societal and Policy and Procedural healthcare interdependencies. It is worth to specify that the assessment of the impact of utilities failure represents an overlap between the first and the second stream, since, as utilities were a part of the analysis of the first one as a source of internal vulnerability of the hospital, in the second stream utilities are evaluated to highlight the potential cascading effects of the network failure on the hospital. To conclude the analysis of this stream it is necessary to mention also the topic related to the selection of performance parameters, so those parameters which are assessed to identify the effects of hazards in order to understand critical interdependencies. It is well accepted the necessity to consider time based parameters,
37
in order to keep under consideration all the cascading scenarios arising from the failure of a node of the network in which the hospital is inserted in, but then parameters can vary significantly. In Abdullah Alsubaie 2015 the performance indicator considered is the number of patients treated per hour, while in Loosemore and Chow 2012 different key performance indicators which best represent the successful functionality of a hospital are proposed and described: access index, index of care, adverse non-admit events, adverse hospital events, time under care. These are computed at different time distances from the failure event. The topic of performance parameters will be deepened later.
As a final comment, it is interesting to notice that it exists a very limited portion of literature integrating the two approaches described up to now. As a matter of facts, just three items have been identified describing methods and approaches to keep into considerations both the assessment of the vulnerabilities of the hospital as a single entity and as a node of the network. In Brauner 2015 it is proposed a two-step framework: “the first step of the framework is micro-CI-orientated and focused on the vulnerability of the organizational units within a specific hospital, while the second step is macro-CI-orientated and addresses the different relevancies of CIs in a district”. Differently, in Arboleda, 2007 and then in Arboleda, 2009 it is developed a system dynamics simulation model which is the integration of two sub models: one to analyze the external infrastructure system and one to analyze the internal capabilities of the hospital. Both are divided into three steps, a normal operations model, a response to disruption model and a restoration model. This model is the unique attempt to integrate in a quantitative way both the internal capabilities of the hospital to face disruptive events, and the influence of external dependencies.
38
Segment Papers
Internal vulnerability of the hospital
Mitrani-Reiser, Mahoney, et al. (2012), Guinet, (2015), R.ba, Masri, et al. (2005), Yavari, et al (2010), Chow, Loosemore, (2012), Chand, Loosemore (2013), Miniati Iasio Alexander (2011), Goulet (2007)
Interdependencies with external infrastructure
C Jacques, J Mitrani-Reiser (2014), C Balducelli, S Bologna (2005), C (2010), N.Nivedita, S.Durbha (2003), N.Nivedita, S.Durbha (2004), Achour (2014), Moon, lee (2013), M Loosemore, V Chow, (2013),
Polinpapilinho F. Katina (2014), ED Vugrin et al (2015), Loosemore, Chow (2012), Ariel Prieto (2012), Alsubaie, Alutaibi, Marti (2015), Hiete, Merz, Schultmann, (2011), N Nukavarapu, S Durbha, (2016)
Setola (2007), Rinaldi (2004), Rejeb et al (2012), Barabasi, Crandall (2004) Internal vulnerability of the
hospital And Interdependencies with
external infrastructure
Brauner et. al (2015), Arboleda (2007), Arboleda (2009)
39
2.1.2 Resilience concerning healthcare domain
In this paragraph it is described the research done on the existing literature about the concept of Resilience, specifically concerning the hospital and healthcare context. As it was highlighted with regards to the literature revolving around the concept of CI, it possible to affirm that the attention towards the concept of Resilience applied to the healthcare sector started from the second half of the 2000’s. Also in this case the profile of the curve describing the development of the production of papers is increasing until nowadays.
Figure 4 Resilience publications [2006-2018]
What differs from the previous stream of literature is the amount of contributions relevant for the research, much more consistent in this case, cumulating almost 60 relevant papers, showing the high level of attention and interest on the Resilience concept. This can provide a clue to explain the higher level of maturity, determined once more according to the types of documents collected. As it is possible to see in Figure5, the vast majority of the papers are articles, suggesting a strong theoretical basis. 0 2 4 6 8 10 12 2006 2007 2010 2011 2012 2013 2014 2015 2016 2017 2018 Pu b lic at ion s Years
Resilience
40 Figure 5 Resilience publications, source
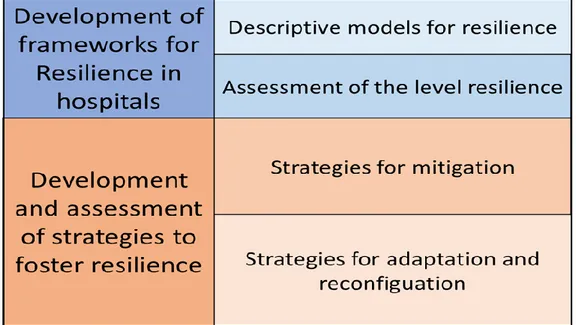
Moving to the analysis, it is possible to affirm that the literature focused on the concept of Resilience concerning Healthcare could be segmented into two macro areas of analysis (streams). The first one regards the development of frameworks to shape Resilience in hospitals, while the second one regards the assessment or development of strategies to enhance the resilience of the hospital system.
Figure 6 Resilience, representation logic
The first sub-group of papers regarding the topic of Resilience in healthcare contains all of those publications with the aim of giving a general overview on the attributes and features related to the resilience property of the hospital system. In this case it is possible to identify two segments of analysis: the first one refers to the definition of descriptive frameworks, so models and schema to represent the attributes of a resilient Hospital; the second one, on the other hand, refers to the development of methods and