Niobium pentoxide nanomaterials with distorted
structures as ef
ficient acid catalysts
Kai Skrodczky
1, Margarida M. Antunes
2, Xianying Han
1, Saveria Santangelo
3, Gudrun Scholz
1,
Anabela A. Valente
2*, Nicola Pinna
1* & Patrícia A. Russo
1*
Niobium pentoxides are promising acid catalysts for the conversion of biomass into fuels and chemicals. Developing new synthesis routes is essential for designing niobium pentoxide catalysts with improved activity for specific practical processes. Here we show a synthesis approach in acetophenone, which produces nanostructured niobium pentoxides with varying structure and acidity that act as efficient acid catalysts. The oxides have orthorhombic structures with different extents of distortions and coordinatively unsaturated metal atoms. A strong dependence is observed between the type and strength of the acid sites and specific structural motifs. Ultrasmall niobium pentoxide nanoparticles, which have strong Brønsted acidity, as well as Lewis acidity, give product yields of 96% (3 h, 140 °C, 100% conversion), 85% (3 h, 140 °C, 86% conversion), and 100% (3 h, 110 °C, 100% conversion) in the reac-tions of furfuryl alcohol, 5-(hydroxymethyl)furfural, and α-angelica lactone with ethanol, respectively.
https://doi.org/10.1038/s42004-019-0231-3 OPEN
1Institut für Chemie and IRIS Adlershof, Humboldt-Universität zu Berlin, Berlin, Germany.2Department of Chemistry, CICECO, University of Aveiro, Aveiro,
Portugal.3Dipartimento di Ingegneria Civile, dell’Energia, dell’Ambiente e dei Materiali (DICEAM), Università “Mediterranea”, Reggio Calabria, Italy.
*email:[email protected];[email protected];[email protected]
123456789
N
iobium pentoxides show high potential as acid catalysts for the sustainable production of fuels and chemicals from inedible biomass sources, but their performance needs to be improved for competing with catalysts currently used in industry1–5. The physical and chemical properties of niobium oxides, including the acid properties, depend on their structure1,2,4,6. Nb2O5 can be amorphous or crystalline, with many crystalline structures reported in the literature in which the main basic structural units are generally NbO6octahedra, linked through corner- or edge-sharing6. The structural diversity is
attributed to the many different arrangements of these building blocks that can lead to the Nb2O5 stoichiometry. Additionally, phase mixtures and defects (e.g. atom vacancies or incorporation of additional atoms) frequently occur in niobium oxides, further contributing to the structural variety6.
Hydrated amorphous niobium pentoxide (Nb2O5·nH2O, niobic acid) contains both Brønsted and Lewis acid sites, and has the ability to promote a large number of chemical reactions (e.g. hydrolysis, dehydration, isomerization, esterification, and ether-ification) even in the presence of water molecules1,7,8. Those
reactions are fundamental processes in biorefineries, in which water is likely present either as solvent or reaction side-product9, making Nb2O5 catalysts promising for biomass conversion to valuable chemicals1. Niobium pentoxide acid catalysts are in most cases amorphous solids, synthesized in aqueous solutions at room temperature or under hydrothermal conditions. By varying the metal oxide precursor, temperature, using water/solvent mixtures or employing surfactants, the morphology, porosity, surface area, and acid properties can be modified to a certain extent8,10–13.
Thermal treatment at high temperatures is normally employed to achieve structural modifications (crystallization and phase transformations) due to the lack of a suitable number of soft-chemistry routes6. However, thermal treatment is accompanied
by dehydration/dehydroxylation of the material, drastic decrease of the surface area, disappearance of the acid sites, and con-sequent decrease of the catalytic activity2, making it difficult to
correlate the type and strength of active sites with particular structures2,12,14–17, which in turn hinders the development of
high-performance catalysts for specific practical applications. Searching for new synthesis routes is therefore essential for producing nanosized niobium pentoxides exhibiting strong acidity, high surface area and different structural motifs, which
will also allow getting insights into the structure–acidity–activity relationships.
Syntheses in organic solvents are well-established approaches for producing metal oxide nanocrystals, but rarely applied to the fabrication of solid acids18. Alcohols, amines, and carboxylic acids are the most commonly used organic solvents18,19. Ketones have
attracted considerable less interest, although they were found to be suitable solvents for synthesizing ZnO20, TiO221,22, NiO23, γ-Al2O324, and MoO2nanoparticles25.
Here we present the synthesis of niobium pentoxide acid cat-alysts by reaction of NbCl5with acetophenone, which involves the aldol condensation reaction of acetophenone. It leads to highly hydroxylated ultrasmall niobium oxide nanoparticles (Nb2O5 -NP), spherical assemblies of nanoparticles (Nb2O5-NS), and nanoparticles supported on holey graphene oxide (Nb2O5-hGO), depending on the composition of the reaction mixture. The resulting oxides show structural similarities to different extents with orthorhombic Nb2O5 (T-Nb2O5). Structural variations among the oxides lead to changes in the type and strength of the acid sites, and allow assigning the type and strength of the acid sites to the presence of specific structural motifs. The niobium oxides synthesized via aldol condensation are considerably more efficient catalysts than conventional niobic acid Nb2O5·nH2O in the reactions of the carbohydrate-derived platform chemicals 5-hydroxymethylfurfural, furfuryl alcohol and α-angelica lactone with ethanol. These chemicals can be converted to ethyl levuli-nate, 5-(ethoxymethyl)furfural (from 5-hydroxymethylfurfural) or 2-(ethoxymethyl)furan (from furfuryl alcohol), which are compounds of commercial and industrial interest, particularly as biofuels26–29. Furthermore, the rate and product distribution of
these reactions are sensitive to the type and strength of the acid sites of the catalyst, making them useful for correlating the cat-alytic activity with the acid properties30.
Results
Structure of the niobium oxides. Figure 1 illustrates the pre-paration of the materials and shows the reaction of the formation of the niobium oxides. Mechanistic details of the syntheses are discussed in the Supplementary Information (Supplementary Figs. 1–3 and Supplementary Note 1).
The solvothermal reaction of NbCl5in acetophenone was used for synthesizing three niobium oxide nanomaterials: niobium
+ Co2+ + hGO a b Nb O -NP2 5 Nb O -NS2 5 Nb O -hGO2 5 O O Nb2O5 + 5 2 NbCl5+ 10 + 10 HCl O NbCl5 + O NbCl5 + O NbCl5 +
Fig. 1 Synthesis of the niobium oxides. a Reaction of NbCl5with acetophenone to produce Nb2O5.b Illustration of the preparation of different Nb2O5
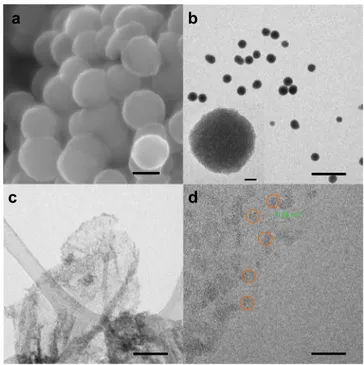
oxide nanoparticles (Nb2O5-NP), spheres (Nb2O5-NS), and nanoparticles supported on holey graphene oxide (Nb2O5 -hGO). The reaction of NbCl5 with acetophenone produces platelet-like nanoparticles with ultrasmall dimensions within the range 1.5–4 nm, which tend to form small agglomerates due to the absence of surfactant molecules in the synthesis (Fig. 2). High resolution transmission electron microscopy (HRTEM) images reveal the presence of lattice fringes, indicative of crystallinity, as well as the presence of defects in the particles, such as irregular surface boundaries and structural distortions. The image in Fig.2d and correspondingfiltered image in Fig.2c show more clearly the presence of structurally ordered regions (indicated by green arrows), disorder and highly distorted regions (indicated by red arrows) within the individual particles. Niobium oxide spheres (Nb2O5-NS) were produced by reaction of NbCl5 with acetophenone in the presence of Co2+ ions, which were found previously to lead to the assembly of Co-doped ZnO nanocrystals synthesized in benzyl alcohol31. Accordingly,
the Co2+ ions were used in this work for promoting the assembly of the small niobium oxide nanoparticles and potentially increase their surface area, which is beneficial for catalysis. Cobalt was not detected in the final product (Supplementary Fig. 4), indicating that it did not react to form an oxide. Figure 3a, b shows images of the spherical structures with sizes between ca. 100 and 200 nm. Imaging of the edges of the spheres at higher magnifications suggests that they are made of interconnected ultrasmall particles. Niobium oxide nanoparticles were also synthesized at the surface of holey graphene oxide (Nb2O5 -hGO). Figure 3c, d shows TEM and HRTEM images of the composite, consisting of small oxide particles with sizes between ca. 2 and 4 nm well dispersed on the surface of the hGO support. Some lattice fringes are seen in the HRTEM image (Fig. 3d), reflecting crystallization. We also used amorphous Nb2O5·nH2O, orthorhombic T-Nb2O5 (obtained by thermal treatment of Nb2O5-NP) and a commercial Nb2O5 (com-Nb2O5, which has
monoclinic H-Nb2O5 structure) for structural and/or catalytic comparisons. TEM images, X-ray diffraction (XRD) patterns, and Micro-Raman spectra of these samples are shown in the Supplementary Information (Supplementary Figs. 5–7).
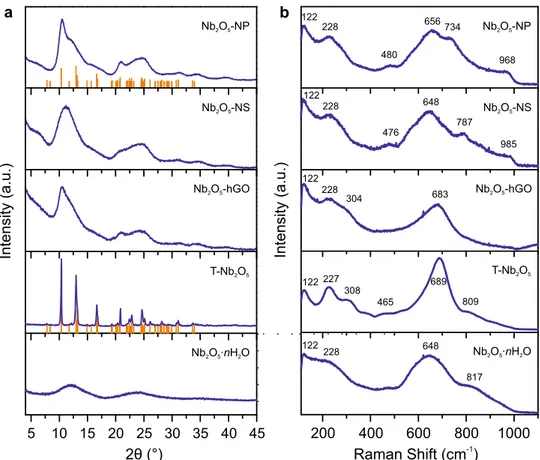
The XRD patterns (Fig.4a) of the niobium oxides synthesized via aldol condensation exhibit very broad reflections, indicative of small crystallites and low crystallinity. This is attributed to the ultrasmall size of the particles and to the structural distortions and disorder discussed above. The positions of the broad reflections match those of the orthorhombic (T- Nb2O5) phase of niobium pentoxide, which consists of NbO6 octahedra and NbO7pentagonal bipyramids corner- or edge-shared in the a–b plane and corner-shared in the c-direction6. The most intense
reflection in the diffractograms corresponds to the (001) reflection of the orthorhombic structure (d = 0.39 nm) in agreement with the interplanar distance determined from the HRTEM data (Figs. 2,3). It is worth mentioning that the broad reflections also match those of the TT-Nb2O5phase reported in the literature, which can contain different types of defects (atom vacancies or extra atoms such as Cl), and has been described as having pseudohexagonal or monoclinic structure, but it is often considered as a less crystalline orthorhombic structure6.
Raman spectroscopy provided additional structural informa-tion (Fig. 4b). In the lower wavenumber region of the spectra (<500 cm−1), the modes arising from the vibrations of octahedra as a whole (at 122 cm–1) and from the bending of Nb−O−Nb bonds (at 228 and 308 cm–1) are observed, as well as the stretching modes of long Nb−O bonds17,32–35. The vibration of
short Nb−O bonds occurs at higher wavenumbers. The spectra of Nb2O5-NP and Nb2O5-NS exhibit intense bands at 656 and 648 cm−1, respectively, which are found for niobium pentoxides with structures made predominantly of corner-shared octahedra synthesized at low temperatures (e.g. T-Nb2O5). These bands are broad and occur at wavenumbers typically observed for amorphous Nb2O5, indicating longer Nb−O bonds compared to the pure orthorhombic structure and some degree of structural
b
0.39 nm
a
d
c
Fig. 2 Nb2O5nanoparticles synthesized in acetophenone (Nb2O5-NP).
a TEM overview image (scale bar 50 nm). b HRTEM image (scale bar 5 nm).c Fourier-filtered image of the selected region in (b) (scale bar 1 nm). d Magnified view of the selected region in (b) (green arrows indicate ordered regions; red arrows indicate disordered and distorted regions; scale bar 1 nm)
c
a
b
0.39 nm
d
Fig. 3 Nb2O5spheres (Nb2O5-NS) and Nb2O5nanoparticles supported on
holey graphene oxide (Nb2O5-hGO).a SEM (scale bar 100 nm) and b TEM
(scale bar 500 nm) images of Nb2O5-NS.c Overview (scale bar 200 nm)
disorder. The spectra of Nb2O5-NP and Nb2O5-NS show an additional band between 700 and 800 cm−1that is not generally observed for low temperature Nb2O5phases. Bands in this region are instead common for some layered niobates with structures consisting of layers of edge- and corner-shared NbO6octahedra and cations intercalated between the layers (e.g. Ca2+, H+, K+, Na+)36,37. The position and relative intensity of the bands are associated with the extent of distortions in the structure, which in turn depends, among other factors, on the size and location of the intercalating cations. Bands in this region have also been assigned to the stretching mode of edge-shared (distorted) octahedral units (e.g. in K8Nb6O19)33. In particular, the spectra of Nb2O5-NP and Nb2O5-NS have some similarities with that of HNb3O8, which is a layered material formed by Nb3O8− sheets intercalated with protons, and displays a band at 780 cm−1, as well as a weaker band at 730 cm−110,38. The sheets are made of NbO
6corner- and edge-shared octahedra16. Therefore, since our oxides are composed of only Nb, O, and H, we attribute the bands at 734 and 787 cm−1 to distorted NbO6 structural units, likely proto-nated, with longer bond lengths and less structural rigidity than for undistorted Nb2O517. The difference in the position and intensity of these bands reflect the different extents of distortion in the structures of Nb2O5-NP and Nb2O5-NS, related to the exact local structure of the protons. The weak bands at 968 and 985 cm−1 in the spectra of Nb2O5-NP and Nb2O5-NS, respec-tively, (Fig. 4b) are attributed to the stretching vibration of terminal short Nb=O bonds present in highly distorted NbO6 octahedral units33,34. The spectral intensity between 800 and
1000 cm−1 in the spectrum of Nb2O5·nH2O has also been attributed to Nb=O bonds in highly distorted structures, with the broadening resulting from coordination of water molecules (upon dehydration the band shifts to ca. 980 cm−1)33,35. The
spectrum of Nb2O5-hGO is the most similar to that of pure
orthorhombic T-Nb2O5. It exhibits even less intensity between 800 and 1000 cm−1than the spectrum of T-Nb2O5, suggesting a structure composed predominantly of corner-shared NbO6 octahedra with a negligible content of highly distorted structural units. The FT-IR spectra of Nb2O5-NP, Nb2O5-NS, and Nb2O5·nH2O (Supplementary Fig. 8 and Supplementary Note 2) are consistent with the Raman results. The spectrum of Nb2O5·nH2O exhibits a broad band due to the vibration of Nb−O bonds, whereas those of Nb2O5-NP and Nb2O5-NS show two bands in the same region, indicative of two distinct types of Nb−O bonds. All three spectra show an additional band assigned to Nb=O bonds. The spectrum of Nb2O5-hGO shows the existence of epoxy, hydroxyl (at the basal planes), and carboxylic acid groups (at the edges and holes) on the surface of the carbon support.
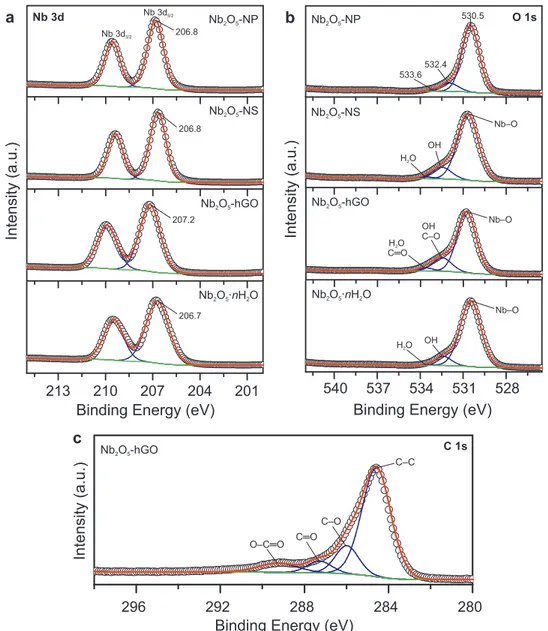
Figure5a displays the high resolution Nb 3d X-ray photoelec-tron spectra (XPS) of the niobium oxides synthesized in acetophenone and niobic acid. The Nb 3d5/2 binding energy ranges from 207.2 eV for Nb2O5-hGO to 206.7 eV for Nb2O5·nH2O. The binding energy of Nb2O5-hGO is within the range of values reported in the literature for Nb5+17,39, but is
slightly lower for the other materials17,39. Thus, niobium appears
to be more reduced in Nb2O5-NP, Nb2O5-NS, and Nb2O5·nH2O than in Nb2O5-hGO, suggesting the presence of oxygen vacancies in the former samples, i.e., coordinatively unsaturated niobium atoms. The O 1s XPS spectra (Fig. 5b) show main peaks at binding energies characteristic of O2−in metal oxides (530.5 eV), and two less intense contributions at around 532.4 eV and 533.6 eV, corresponding to OH species and adsorbed H2O, respectively40. Oxygen in C–O and COOH groups also originate signals at approximately the same binding energies of OH and H2O (532 and 533 eV, respectively)40. Consequently, the oxygen-containing functional groups of the carbon support of Fig. 4 XRD and Raman analyses of the niobium oxides. a XRD patterns (vertical bars represent the orthorhombic T-Nb2O5reference pattern—ICDD file no.
Nb2O5-hGO contribute to those regions of the spectra. Elemental analysis revealed that the Nb2O5-NP and Nb2O5-NS samples contain 0.3 and 1.8 wt.% carbon, respectively, from adsorbed organic molecules remaining from the synthesis in acetophenone. Those organic molecules are expected to give a small contribution to the O 1s spectra of these samples. The O 1s and C 1s spectra of Nb2O5-hGO confirm the presence of a high amount of oxygen-containing functional groups from the support at the surface of this solid.
The water and hydroxyl groups content of the oxides were evaluated by thermogravimetric analysis coupled with mass spectrometry (TG-MS). The results are shown in Supplementary Figs. 9, 10 and Supplementary Note 3. Nb2O5-NP, Nb2O5-NS, and Nb2O5·nH2O release a similar amount of water during heating. However, the water evolves at lower temperature from Nb2O5·nH2O compared to the oxides synthesized in acetophe-none, suggesting that the former has a higher proportion of physically adsorbed water and OH groups requiring lower dehydroxylation temperatures41.
Surface properties of the niobium oxides. The surface textural properties of the niobium oxides were determined by nitrogen
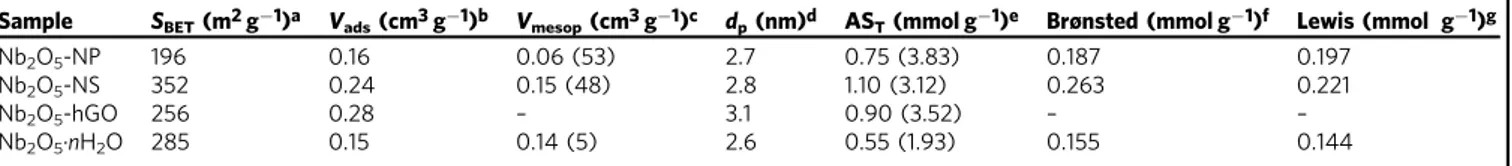
sorption at −196 °C (Table 1and Supplementary Fig. 11). The compounds synthesized via aldol condensation have high specific surface areas; in particular, Nb2O5-NS shows a surface area increase of almost 80% with respect to the nanoparticles. All materials contain mesopores: Nb2O5-NP, Nb2O5-NS, and Nb2O5·nH2O have mostly narrow mesoporosity whereas Nb2O5 -hGO exhibits a broader pore size distribution ranging from ca. 3–10 nm, with the larger mesopores arising from the support. The contribution of the narrow mesopores volume (Vmesop) to the total volume adsorbed (Vads) is, however, different for Nb2O5-NP (37%), Nb2O5-NS (62%), and Nb2O5·nH2O (93%).
The amount, nature, and strength of the acid sites were investigated using a combination of several techniques: acid-base titration, FT-IR of adsorbed pyridine, DRIFTS of adsorbed deuterated acetonitrile (CD3CN),1H MAS NMR, and31P MAS NMR of adsorbed triethylphosphine oxide (TEPO).
The total amounts of acid sites (Brønsted+ Lewis) were estimated by liquid-phase acid-base titration (AST, Table 1). The niobium oxides prepared via aldol condensation have higher acid sites density than Nb2O5·nH2O and the amounts of acid sites per unit surface area decrease in the order Nb2O5-NP > Nb2O5 -hGO > Nb2O5-NS » Nb2O5·nH2O. T-Nb2O5 and com-Nb2O5 have very low surface areas (<5 m2g−1) and extremely small acid
213 210 207 204 201
Binding Energy (eV)
Intensity (a.u.)
540 537 534 531 528 Binding Energy (eV)
Intensity (a.u.)
a
Nb O -NP2 5b
Nb O -NP2 5 Nb O -NS2 5 Nb O -NS2 5 Nb O -hGO2 5 Nb O -hGO2 5 Nb O ·nH O2 5 2 Nb O ·nH O2 5 2 Nb 3d O 1s 296 292 288 284 280Binding Energy (eV)
Intensity (a.u.) C 1s Nb O -hGO2 5
c
C–C C–O C═O O–C═O Nb 3d5/2 Nb 3d3/2 206.8 206.8 207.2 206.7 530.5 532.4 533.6 Nb–O OH H O2 Nb–O Nb–O OH C–O H O2 C═O OH H O2sites contents. For Nb2O5-hGO, functional groups of the support, specifically COOH and OH, contribute to the total acid sites content (specifically to the Brønsted acidity). It is worth mentioning that despite Nb2O5·nH2O, Nb2O5-NP, and Nb2O5 -NS releasing comparable amounts of water during heating, the acid sites density of Nb2O5·nH2O is significantly smaller, which is consistent with the latter having a higher content of adsorbed water, as inferred from the TG-MS data.
The FT-IR spectra of adsorbed pyridine revealed the presence of Brønsted and Lewis acid sites on the samples Nb2O5-NP, Nb2O5-NS, and Nb2O5·nH2O (Supplementary Fig. 12 and Table 1). It was not possible to evaluate the acidity of Nb2O5 -hGO through this method due to the low transmission of this dark sample, as the measurements are done using undiluted pellets of the materials. The sum of the Brønsted+ Lewis acid sites is lower than the ASTvalues measured by titration, because the adsorbed pyridine measurements were performed on the dehydrated samples that were pretreated under vacuum at 180 °C. This type of pretreatment on hydrated niobium oxide materials causes the elimination of acid sites, as well as an increase in the proportion of the Lewis sites compared to the Brønsted.
Nevertheless, the density of acid sites determined by FT-IR of adsorbed pyridine follows the same trend as the AST.
The nature of the acid sites was further investigated by DRIFTS of adsorbed CD3CN as probe molecule (Fig.6a), which allowed also the study of the Nb2O5-hGO material42,43. The bands at 2260 and 2247 cm−1(indicated on the plots by P and CD, respectively) are ascribed to the stretching of the C≡N bond of physically adsorbed CD3CN and to the asymmetric stretching of C–D bonds, respectively (the band at 2112 cm−1due to the symmetric stretching of C–D is not shown). The interaction of CD3CN with Lewis and Brønsted acid sites causes a shift of the C≡N vibration frequency to higher values compared to that of physically adsorbed CD3CN, which is often larger for Lewis acid sites (ca. 40–60 cm−1) than for Brønsted acid sites (ca. 10–40 cm−1)44. For
both types of sites, larger shifts correspond to stronger acidity. The spectra of Nb2O5-NP, Nb2O5-NS, and Nb2O5·nH2O show features similar to those of materials containing mainly Brønsted acidity in combination with Lewis acidity, such as some zeolites, aluminas, and aluminophosphates43–45. The band at ca. 2300 cm−1is assigned to OH groups with relatively strong acidity whereas the band at ca. 2280 cm−1 is assigned to less Table 1 Surface textural properties and acid sites content of the niobium oxides
Sample SBET(m2g−1)a Vads(cm3g−1)b Vmesop(cm3g−1)c dp(nm)d AST(mmol g−1)e Brønsted (mmol g−1)f Lewis (mmol g−1)g
Nb2O5-NP 196 0.16 0.06 (53) 2.7 0.75 (3.83) 0.187 0.197
Nb2O5-NS 352 0.24 0.15 (48) 2.8 1.10 (3.12) 0.263 0.221
Nb2O5-hGO 256 0.28 – 3.1 0.90 (3.52) – –
Nb2O5·nH2O 285 0.15 0.14 (5) 2.6 0.55 (1.93) 0.155 0.144
aBET specific surface area
bVolume adsorbed atP/P
0= 0.98
cVolume of mesopores determined by thet-plot (the external surface areas to the mesopores, in m2g−1, are shown in parentheses)
dMaximum of the pore size distribution
eTotal amount of acid sites determined by liquid-phase titration (the amounts of acid sites per unit surface, inμmol m−2, are given in parentheses)
f,gAmounts of Brønsted and Lewis acid sites determined by FT-IR of adsorbed pyridine, respectively
Fig. 6 Acidity of the niobium oxide materials. a DRIFTS spectra of deuterated acetonitrile (CD3CN) adsorbed on the niobium oxides (with background
subtracted).b1H MAS NMR spectra (ν
rot= 20 kHz) of the niobium oxides. c31P MAS NMR spectra (νrot= 10 kHz) of triethylphosphine oxide adsorbed on
acidic OH groups44,45. The band at ca. 2316–2311 cm−1 is
attributed to Lewis acid sites of medium strength, with the Lewis sites of Nb2O5-NS being slightly weaker than those of Nb2O5-NP and Nb2O5·nH2O. A band at similar wavenumbers (2320–2317 cm−1) has been found in the spectra of acetonitrile adsorbed on several different niobium compounds, including niobic acid, Nb2O5-silica materials, and niobium phosphates43. Nb2O5-hGO exhibits a different spectra that reflects an overall weaker acidity compared to the other three materials. The low spectral intensity above 2300 cm−1 indicates a negligible concentration of Lewis acid sites in this material. Based on the adsorbed CD3CN spectra, the Lewis acid sites proportion with respect to Brønsted decreases in the order Nb2O5·nH2O > Nb2O5 -NS > Nb2O5-NP > Nb2O5-hGO. These results are consistent with the XPS data, as Lewis acidity in the materials correlates with the presence of niobium in a more reduced state. On the other hand, this trend does not match the one arising from the pyridine adsorption experiments, which is attributed to the lower pretreatment temperature used prior to the CD3CN adsorption experiments in order to avoid significant changes in the acid sites of the samples, and especially to avoid the elimination of surface groups of the hGO in Nb2O5-hGO (also, the region of the spectra where the characteristic bands of CD3CN are observed is not affected by water, so lower pretreatment temperatures can be used). Therefore, in the CD3CN, as well as liquid-phase titration and NMR experiments, the surface of the materials is closer to the state of when the samples are used in the catalytic experiments. In addition to the bands at 2296 and 2281 cm−1, also found in the spectra of the other oxides, a band at 2270 cm−1 is seen for Nb2O5-hGO. This band is associated with CD3CN adsorbed on very weak acid sites or non-acidic hydroxyls that possibly belong to the support.
The hydroxyl groups of the solids were studied in more detail by 1H MAS NMR spectroscopy, as the 1H chemical shift may correlate with their acid strength, with larger chemical shifts corresponding to stronger Brønsted acidity16,46,47. The spectra of
the solids dehydrated at 120 °C under vacuum are shown in Fig. 6b. The spectra of Nb2O5-NP and Nb2O5-NS show resonances at 2.5 and 1.4 ppm, respectively, corresponding to isolated terminal Nb-OH groups. These values are in the range of chemical shifts of many weakly or non-acidic terminal OH groups, such as silanols46. The resonance at 4.8 ppm in the
spectrum of Nb2O5-NS is assigned to perturbed terminal Nb-OH groups and that at 7.1 ppm to more acidic bridging hydroxyls16,46–48. The spectrum of Nb
2O5-NP shows a broad resonance at 6.4 ppm, made of contributions from terminal (6.1 ppm) and bridging OH (7.9 ppm) that seem to be more acidic than the corresponding ones of Nb2O5-NS. The spectrum of Nb2O5-hGO shows very broad peaks made of at least two contributions at 3.8 and 0.6 ppm. The broadening of the resonances indicates a significant variation in the local structure of the hydroxyl groups. The contribution at 0.6 ppm corresponds to very weak or non-acidic hydroxyls, likely belonging to the support, which is consistent with the band observed at 2270 cm−1 in the spectrum of CD3CN adsorbed on Nb2O5-hGO. The broad resonance centered at 3.8 ppm suggests the presence of a large percentage of terminal Nb−OH groups in this solid. The disordered structure and consequent variable local structures of the hydroxyls in Nb2O5·nH2O lead to a broad resonance centered at 6.1 ppm, with a shoulder at 1.4 ppm, in agreement with the literature48. The spectrum shows some similarities with that of
Nb2O5-NP, suggesting that niobic acid contains both terminal and bridging hydroxyls. It is worth mentioning that protons from residual organics originating from the synthesis in acetophenone give a small contribution to the spectra, as well as possible residual amounts of adsorbed water (δH2O= 4.9 ppm)47. The1H
MAS NMR results correlate with the Raman data. Protons at terminal oxygen atoms (Supplementary Fig. 13) are associated with little structural distortion. Accordingly, the structure of Nb2O5-hGO has relatively low distortion due to being composed of predominately corner-shared octahedra, and contains mainly terminal hydroxyls. On the contrary, protons at bridging oxygen atoms (Supplementary Fig. 13) are associated with distortion in the structure, as they cause tilting of the NbO6units or occur at edge-shared octahedra. The presence of a higher amount of bridging hydroxyls in Nb2O5-NP and Nb2O5-NS compared to Nb2O5-hGO correlates with their more distorted structures.
The strength of the acid sites was examined further by 31P MAS NMR spectroscopy of adsorbed triethylphosphine oxide (TEPO). The interaction of TEPO with acid sites of increasing strength causes the 31P resonance to shift downfield49. The spectra of Nb2O5-NP, Nb2O5-NS, Nb2O5-hGO, and Nb2O5·nH2O are shown in Fig.6c. The resonances below 60 ppm are caused by TEPO physically adsorbed, crystallized or interacting with very weakly or non-acidic OH groups, and will not be discussed further. The signals between 100 and 60 ppm correspond to TEPO interacting with weak, medium and strong acid sites. The resonances at 71.9 and 70.2 ppm for Nb2O5-NP and Nb2O5-NS, respectively, correspond to weak and medium strength acid sites. The Lewis acid sites and terminal hydroxyl groups of these samples should interact with TEPO to give resonances in this region of the spectrum. The peaks centered at 79.9 and 78.2 ppm for Nb2O5-NP and Nb2O5-NS, respectively, correspond to strong acid sites. Bridging OH groups should originate resonances in this region of the spectrum. The ratio between the areas of the two resonances is 1.9 (A79.9/A71.9) for Nb2O5-NP and 1.2 (A78.2/A70.2) for Nb2O5-NS. The stronger acidity of Nb2O5-NP compared with Nb2O5-NS is consistent with the former having more acidic both bridging and terminal OH groups and less Lewis acid sites. Nb2O5·nH2O shows a broad resonance centered at 76 ppm, which indicates that most of the acid sites in the material are of medium strength. The Lewis acid sites of medium strength determined by CD3CN adsorption contribute to this broad resonance. A similarly broad resonance centered at 74 ppm is seen on the spectrum of Nb2O5-hGO, further confirming the overall weaker acidity of Nb2O5-hGO compared to the other solids. An additional discussion of the relationship between the structure and acid properties of the materials is provided in Supplementary Note 4.
Catalytic properties. The niobium oxides synthesized in acet-ophenone were investigated as acid catalysts for the reactions of furfuryl alcohol (FA), 5-(hydroxymethyl)furfural (HMF) and α-angelica lactone (AnL) with ethanol, and compared with Nb2O5·nH2O and com-Nb2O5. The catalytic performance of the materials is discussed in more detail in the Supplementary Information (Supplementary Figs. 14–18, Supplementary Tables 1– 4, and Supplementary Notes 5–8).
FA is a bio-based compound derived from hemicelluloses (sources of pentoses) that can be converted to 2-(ethoxymethyl) furan (2EMF) and ethyl levulinate (EL) in ethanol, in the presence of acid catalysts. 2EMF is an intermediate of the conversion of FA to EL50,51, which may occur through various
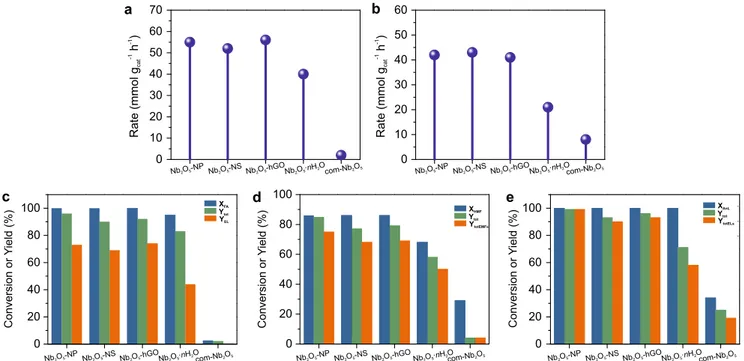
pathways, including the etherification of FA to 2EMF followed by 2EMF ring-opening to EL27. The niobium oxides synthesized via aldol condensation efficiently convert FA, leading to high total yields of EL plus 2EMF (Ytot) and high EL yields (YEL) of 69–74% within 3 h at 140 °C (Fig.7, Supplementary Table 2, Supplemen-tary Fig. 14). Furthermore, these catalysts are more active than Nb2O5·nH2O and com-Nb2O5 (Fig.7), converting FA at higher rates. The carbon support alone was considerably less active than
Nb2O5-hGO, leading only to 41% of Ytotat 140 °C for 3 h. Nb2O5 -NP exhibits the best catalytic performance, leading to the highest EL and total yields.
HMF is a platform chemical derived from carbohydrate sources of hexoses such as cellulose. The reaction of HMF in alcohol media in the presence of acid catalysts somewhat parallels that of FA, and can lead to the formation of 5-(alkoxymethyl) furfural and levulinate esters29,30. The reaction process involves
the etherification of HMF to 5-(alkoxymethyl)furfural, followed by ring opening to the ester; other pathways may be involved, depending on the reaction conditions and catalyst acid properties29.
The niobium oxide materials were investigated as catalysts for the conversion of HMF in ethanol at 140 °C (Fig.7, Supplemen-tary Table 3, and SupplemenSupplemen-tary Fig. 15). The initial reaction rates of Nb2O5-NP, Nb2O5-NS, and Nb2O5-hGO were similar and significantly higher than those of Nb2O5·nH2O and com-Nb2O5, which was essentially inactive. The main reaction products were 5-(ethoxymethyl)furfural (5EMF), formed via etherification of HMF, and 5-(ethoxymethyl)furfural diethyl acetal (5EMFda). The latter compound is generated through acetalization of 5EMF and reportedly interconverts with 5EMF to an extent that depends on the reaction conditions such as temperature and water content29,52. Nb2O5-NP, Nb2O5-NS, and Nb2O5-hGO converted 86% of HMF within 3 h and led to total yields of 5EMF plus 5EMFda (YtotEMFs) of 75%, 68%, and 69%, respectively, while the EL yields were low (Supplementary Table 3). Under these reaction conditions the catalysts are more selective for the etherification reaction than for the formation of EL, as opposed to what happens with FA.
Nb2O5-NP, Nb2O5-NS, and Nb2O5-hGO were also very effective catalysts for the reaction of AnL with ethanol, leading to 100% conversion of AnL (XAnL) within 1 h at 110 °C or 140 °C (corresponding to an initial reaction rate of at least 57 mmol gNb2O5−1h−1), and to high yields of EL (Fig. 7, Supplementary Table 4). Additional products formed were pseudo ethyl levulinate (pseEL) and levulinic acid (LA). pseEL is a reaction
intermediate in the conversion of AnL to levulinate esters over solid acids26,53. LA can be formed by the reaction of EL, pseEL or
AnL with water present in the system. Nb2O5-NP led to an excellent EL yield of 99% within 1 h at 140 °C or 3 h at 110 °C. Nb2O5-NS and Nb2O5-hGO also led to high EL yields, although slightly inferior to that of Nb2O5-NP. Nb2O5·nH2O performs considerably worse and the commercial Nb2O5(com-Nb2O5) led to very sluggish AnL reaction (Fig. 7, Supplementary Table 4), similar to the results obtained without a catalyst. The hGO support only led to 45% AnL conversion within 3 h at 110 °C and to an EL yield of 16%.
The catalysts prepared by the aldol condensation reaction performed considerably better than Nb2O5.nH2O and com-Nb2O5on all the reactions investigated. They are also compared in the Supplementary Tables 2–4 to literature data for different catalysts tested in the same reactions, and compare favorably with most catalysts reported. The almost complete inactivity of com-Nb2O5is attributed to its extremely low surface area and small acid sites content, in agreement with the poor catalytic performances generally found for niobium pentoxides prepared by calcination at high temperatures2.
As Nb2O5-NP, Nb2O5-NS, Nb2O5-hGO, and Nb2O5·nH2O are mesoporous materials, size exclusion effects and diffusional limitations are expected to contribute little to the different catalytic performances of the solids. The fact that the catalytic performances of Nb2O5-NP and Nb2O5-NS do not differ drastically, despite the percentage of mesopores contributing to the total volume of the solid being approximately two times higher for Nb2O5-NS, supports this hypothesis, and suggests the activity mainly correlates with the acid properties.
According to the literature, the etherification of FA and HMF can occur over Lewis or Brønsted acid sites, whereas the formation of levulinate esters is achieved with Brønsted acids28–30,50–52,54–57. However, both the etherification reaction
and ester formation seem to be favored by increasing Brønsted acid strength52. The conversion of AnL to levulinate esters is also
achieved with strong acid sites26.
Fig. 7 Catalytic performance of the niobium oxide materials. Initial reaction rates of a furfuryl alcohol and b 5-(hydroxymethyl)furfural conversion over the niobium oxides. Conversion (X) and product yields (Y) for the reactions ofc furfuryl alcohol, d 5-(hydroxymethyl)furfural, and eα-angelica lactone with ethanol. Reaction conditions: 140 °C, 3 h (forc, d, and e) catalyst loading equivalent to 5.8 gNb2O5L−1, initial concentration of FA, HMF or AnL= 0.33 M in
The relationships between activity and acidity were studied in more detail for the reactions of FA and HMF. A quantitative comparative study of the dependency of initial activity on the acid properties measured via different techniques (FT-IR of adsorbed pyridine, and solid–liquid-phase titration) was performed for the niobium oxide catalysts Nb2O5-NP, Nb2O5-NS, and Nb2O5·nH2O. For FA as substrate, no clear relationships between initial activity and the total amount of acid sites or specific surface area were found. Instead, a relationship between the initial activity and the acid sites density measured via different methods was verified (Supplementary Fig. 19). The initial activity for FA conversion (expressed as mmol gcat−1h−1 or mmol gNb2O5−1h−1) increased with increasing acid sites density, being highest for Nb2O5-NP (e.g. 45.3 mmol gcat−1h−1 vs 3.8 μmolASm−2, compared to 38–43 mmol gcat−1h−1 vs 1.9–3.1 μmolASm−2for the remaining catalysts). FA was mainly converted to EL, which involves a series of reactions. The adsorbed FA and 2EMF (intermediate that leads to EL) molecules in the vicinity of a higher density of AS can favorably drive the FA reaction forward. As opposed to FA, when HMF was used as substrate, no clear relationship could be established between the initial activity and the acid sites density. However, the activity for HMF conversion correlated with the amount of acid sites, where Nb2O5-NP and Nb2O5-NS, possessing higher amount of acid sites than Nb2O5·nH2O, were more active than the latter (Supplemen-tary Fig. 20). A difference between the HMF and FA systems is that HMF was mainly converted to the (primary product) furanic ether (5EMF) and the EL yields were low, whereas FA was mainly converted to EL, which involved consecutive reactions (via 2EMF as intermediate). On the other hand, HMF is a bulkier substrate than FA. Both these features account for the more important effects that the acid sites density has on the FA reaction than the HMF reaction. A broader comparative study to include the supported catalyst Nb2O5-hGO was carried out on the basis of mass of niobium oxide active phase in the loaded catalyst, although the results did not fall into the above relationships for the FA and HMF reactions, which is attributed to the presence of the support and its effect on the performance. An effect of the support is likely responsible for the improved performance. The hGO support alone showed poor catalytic activity on all reactions, in agreement with the mild acidity of the functional groups at the surface of graphene oxides, and consistent with the presence of weakly or non-acidic OH groups in Nb2O5-hGO associated with the support. Additionally, the trends in the performance of Nb2O5-NP, Nb2O5-NS, and Nb2O5-hGO remain the same whether the catalysts are compared on a basis of identical mass of oxide or identical total mass, further indicating that the activity of Nb2O5-hGO derives essentially from the oxide nanoparticles. To get further insights into the role of the support, we measured adsorption isotherms of HMF on the solids (Supplementary Fig. 21, Supplementary Table 5, and Supplementary Note 9). The results suggest that Nb2O5-hGO has higher adsorption affinity for the polar substrate molecules in solution than Nb2O5-NP, Nb2O5 -NS or Nb2O5·nH2O. This is attributed to a higher surface density of polar centers for adsorption on Nb2O5-hGO due to the high content of surface functional groups of the hGO support (C–O–C, OH, C=O, COOH). The strong adsorption of the substrate molecules near the acid sites can facilitate their conversion and contribute to the observed catalytic activity of Nb2O5-hGO.
Discussion
We report a novel synthesis route for the preparation of nanos-tructured Nb2O5 solid acids with varying structural motifs and acidity, based on the reaction of NbCl5with acetophenone. They
showed promise as efficient acid catalysts for the conversion of furfuryl alcohol, 5-(hydroxymethyl)furfural and α-angelica lac-tone with ethanol to produce valuable compounds such as bio-fuels. The catalysts consist of ultrasmall nanoparticles (1.5–4 nm) (Nb2O5-NP), spheres (Nb2O5-NS) and nanoparticles supported on holey graphene oxide (Nb2O5-hGO). The oxides have orthorhombic structures with different degrees of distortion and unsaturated niobium coordinations, and the acidity was found to be highly sensitive to the structural motifs of the oxides. Nb2O5 -hGO has orthorhombic structure with little distortion, resulting in a solid acid with mainly terminal hydroxyls that function as medium-weak Brønsted acid sites. Strong Brønsted acid sites originate from distortions in the orthorhombic structures of Nb2O5-NP and Nb2O5-NS, whereas Lewis acid sites arise from highly distorted octahedral units. The acidity of Nb2O5·nH2O appears to have the same origin. However, the synthesis in acetophenone produces compounds (Nb2O5-NP and Nb2O5-NS) with significantly higher acid sites densities, acid strength and catalytic activity than conventional amorphous Nb2O5·nH2O. The effect of the weaker acidity of Nb2O5-hGO on the catalytic activity was counterbalanced by a synergistic adsorption effect between the oxide and the carbon support.
Methods
Synthesis of niobium oxides. The niobium oxides were synthesized by sol-vothermal reaction in a microwave (MW) reactor Anton Paar Monowave 3000 at 220 °C for 20 min, with a heating rate of 5 min to reach thefinal temperature. For the synthesis of Nb2O5nanoparticles (Nb2O5-NP), 0.135 g of NbCl5(99%, abcr)
was added to 15 mL of acetophenone (99%, Sigma-Aldrich) in a 30 mL microwave glass vial, under argon, and stirred at room temperature for 10 min to dissolve the precursor. For preparing the Nb2O5spheres (Nb2O5-NS), 0.135 g of NbCl5and
0.128 g of cobalt (II) acetylacetonate (99%, Sigma-Aldrich) were added to 20 mL of acetophenone in a 30 mL microwave glass vial, and stirred for 48 h at room temperature under argon. For the synthesis of the Nb2O5nanoparticles supported
on holey graphene oxide (Nb2O5-hGO), 0.135 g of NbCl5and 50 mg of hGO were
added to 15 mL of acetophenone in a 30 mL MW vial, and the mixture was sonicated for 3 h to disperse the hGO. The solutions/suspensions were subse-quently heated in the microwave reactor. The products were collected by cen-trifugation, washed twice with 20 mL of absolute ethanol followed by two times with 20 mL of acetone, and dried at 70 °C under air. Niobic acid (Nb2O5·nH2O)
was synthesized as follows: 1 g of NbCl5was added to 40 mL of deionized H2O and
stirred at room temperature for 24 h. The white solid was separated by cen-trifugation and thoroughly washed with deionized water. Orthorhombic niobium pentoxide (T-Nb2O5) was prepared by calcination under air of Nb2O5-NP at 600 °C
for 2 h. Commercial Nb2O5(com-Nb2O5) was purchased from Sigma-Aldrich. The
synthesis of hGO is described in the Supplementary Information (Supplementary Methods).
Characterization. XRD patterns were recorded with a STOE MP diffractometer in transmission configuration using Mo Kαradiation (λ = 0.07093 nm). Transmission
electron microscopy (TEM) and high resolution TEM (HRTEM) images were acquired on a Philips CM 200 and FEI Talos 200S microscope operated at 200 kV. Scanning electron microscopy (SEM) images were recorded with a Hitachi SU-70 HR microscope operated at 15 kV. A NT-MDT NTEGRA—Spectra SPM spec-trometer, equipped with MS3504i 350 mm monochromator and ANDOR Idus CCD, was utilized to measure Raman scattering, excited by a solid-state laser operating at 2.33 eV (532 nm). The use of a very low laser power (250μW at the sample surface) prevented local heating of the samples and annealing effects. The scattered light from the sample was dispersed by a 1800 lines/mm grating and collected by a Mitutoyo high numerical aperture ×100 objective. In order to have a reliable picture of their bulk, spectra from several random positions on each spe-cimen were collected. X-ray photoelectron spectroscopy (XPS) measurements were performed using a Thermo Fischer Scientific ESCALAB 250Xi instrument, with an Al Kαsource, in constant analyzer energy mode with a pass energy of 50 eV and a
spot size of 400μm. A NETZSCH thermoanalyzer STA 409 C Skimmer system, equipped with BALZERS QMG 421, was used to record the thermoanalytical curves together with the ion current (IC) curves. An argon or synthetic airflow of 70 mL min−1and a heating rate of 10 °C min−1were applied. Fourier-transformed infrared spectroscopy (FT-IR) spectra of adsorbed pyridine were measured in a home-made transmission IR cell connected to a high vacuum system. The samples (25–30 mg) were pressed into pellets and pretreated at 180 °C for 12 h before pyridine adsorption. Spectra of the samples were collected before pyridine adsorption, and after pyridine adsorption followed by degassing at room tem-perature, 100 and 150 °C. Quantification was done using the molar absorption coefficients for pyridine adsorbed onto Brønsted and Lewis acid sites. Diffuse
reflectance infrared Fourier transform spectra (DRIFTS) of adsorbed deuterated acetonitrile (CD3CN) were measured using a PIKE Technologies DiffusIR
Envir-onmental chamber (HTV) and DiffusIR diffuse reflectance accessory. Prior to the measurements, the samples were degassed at 120 °C under vacuum for 12 h, contacted with 90 mbar of CD3CN and degassed for 30 min at room temperature
(for Nb2O5-hGO the degassing time was 1 min). All spectra were recorded on a
Thermo Fischer Scientific Nicolet iS50 spectrometer equipped with a MCT detector, at 2 cm−1spectral resolution over the range 4000–600 cm−1. Carbon elemental analyses were performed using a Leco TruSpec 630-200-200 elemental analyzer. The total acid sites content was evaluated by acid-base titration. 0.5 g of sample was dispersed in 5 mL of DI water and titrated with n-butylamine, under stirring. Care was taken to control experimental variables such as titration time and stirring to allow a meaningful comparison of the materials. The equivalence point was determined with a pH meter and the color indicator methyl red (for the white samples). Nitrogen sorption isotherms at−196 °C were acquired on a Micro-meritics ASAP 2020, after degassing the solids at 120 °C overnight. Solid-state MAS NMR spectra were acquired on a 400 MHz Bruker Avance 400 spectrometer. Before measuring the1H MAS NMR spectra, the solids were heated at 120 °C
under vacuum for 3 h. The1H MAS NMR spectra were recorded with a 2.5 mm
probe (Bruker Biospin) applying a rotation frequency of 20 kHz, a pulse lengths of 3.5μs and an accumulation number of 64. The spin lattice relaxation behavior was tested to ensure the completeness of the signals and following that, the1H spectra
were recorded with recycle delays of 5 s or 10 s. The acid strength was evaluated by
31P MAS NMR of adsorbed triethylphosphine oxide (TEPO). The adsorption of
TEPO was performed as follows: 0.15 g of solid was dehydrated at 120 °C for 3 h under vacuum. 0.022 g of TEPO dissolved in 7.5 mL of anhydrous n-pentane was added to the solid, and the mixture was stirred for 30 min under nitrogen, and then dried at 50 °C under vacuum. All31P MAS NMR spectra (ν
L(31P)= 161.9 MHz)
were taken with a 4 mm probe (Bruker Biospin) and a rotation frequency of 10 kHz. To ensure quantitative measurements the resulting recycle delays are completely different for every sample: 40 s for Nb2O5-NP, 20 s for Nb2O5.nH2O,
10 s for Nb2O5-hGO but even 3600 s for Nb2O5-NS. The latter led with 64
accu-mulations to a total measurement time of 64 h. Fitting of the spectra was performed using the DMfit software58. All isotropic chemical shift values are given with
respect to the TMS standard (1H) and H
3PO4(31P) using KHSi2O5and ADP as
secondary solid references. FT-IR spectra of the samples were acquired on a Thermo Scientific Nicolet iS50 spectrometer with a DTGS detector, using pellets of the solid diluted in KBr (4 cm−1resolution, 4000–400 cm−1range). The liquid-phase adsorption isotherms were measured by contacting 25 mg of sample with HMF solutions in ethanol of different concentrations, in closed vials, at 20 °C for 4 h. Subsequently, the solids were separated from the solution byfiltration and the amounts adsorbed were determined by UV–Vis spectrophotometry using a Thermo Fischer Scientific Evolution 220. The solvothermal stability tests (SolvoT) were carried out by contacting the original catalyst with ethanol (without substrate) for 24 h, at 110 °C, and subsequently testing the treated materials for the catalytic reaction of AnL at 110 °C (the obtained results were compared to those for a normal catalytic test). Additionally, the catalysts were recycled for three con-secutive 1 h-batch runs of AnL reaction at 110 °C. The solid catalyst after the SolvoT or a normal catalytic run, was separated from the reaction mixture by centrifugation at 10000 rpm, and washed using acetone (3 × 1 mL per 10 mg) and finally dried at ambient temperature overnight.
Catalytic reactions. The catalytic experiments were performed in tubular glass pear-shaped reactors, equipped with an appropriate polytetrafluoroethylene (PTFE)-coated magnetic stirring bar and a valve. The substrates investigated were α-angelica lactone (AnL, 98%, Alfa Aesar), furfuryl alcohol (FA, 99%, Aldrich), and 5-(hydroxymethyl)furfural (HMF, Shangai). In a typical catalytic experiment, the substrate (0.33 M), catalyst (in an amount equivalent to a niobium oxide load of ca. 5.8 g L−1), and 1 mL of anhydrous ethanol (≥99.9%, Carlo Erba) were added to the batch reactor. The reactor was immersed in a thermostatically controlled oil bath heated at 110 or 140 °C with a stirring rate of 1000 rpm, which was taken as the instant that the reaction began. The reactors were cooled to ambient temperature in cold water prior to sampling/analyses. The analyses were always carried out for freshly prepared samples. The evolution of the catalytic reactions was monitored by GC for the quantification of the substrates AnL and FA and the respective reaction products, or by HPLC for quantification of HMF. The GC analyses were carried out by using a Varian 3800 instrument equipped with a capillary column (VF-5ms, 30 m × 0.25 mm × 0.25μm) and a flame ionization detector, with H2as the carrier
gas. The HPLC analyses were carried out using a Knauer Smartline HPLC Pump 100 and a Shodex SH101H+300 × 8 mm (internal diameter) ion exchange column (Showa Denko America, Inc.), coupled to a Knauer Smartline UV detector 2520 (254 nm). The mobile phase was 0.005 M aq. H2SO4at aflow rate of 0.8 mL min−1,
and the column temperature was 50 °C. Calibration curves were measured for quantification. Individual experiments were performed for a given reaction time, and the presented results are the mean values of at least two replicates. The sub-strate (S) conversion (%) at a reaction time t was calculated using the formula 100 × [(initial molar concentration of S)-(molar concentration of S at time t)]/ (initial concentration of S). The yield (%) of product (P) at reaction time t was calculated using the formula 100 × (molar concentration of P at time t)/(initial molar concentration of S).
Data availability
All data are available from the authors.
Received: 30 May 2019; Accepted: 15 October 2019;
References
1. Xia, Q. & Wang, Y. in Nanoporous Catalysts for Biomass Conversion (eds Stevens, C. V., Xiao, F. S., Wang, L.) (Wiley, Hoboken, NJ, USA 2018). 2. Tokio, I., Kazuharu, O. & Kozo, T. Acidic and catalytic properties of niobium
pentaoxide. Bull. Chem. Soc. Jpn. 56, 2927–2931 (1983).
3. Siddiki, S. M. A. H. et al. Lewis acid catalysis of Nb2O5for reactions of
carboxylic acid derivatives in the presence of basic inhibitors. ChemCatChem 11, 383–396 (2019).
4. Nowak, I. & Ziolek, M. Niobium compounds: preparation, characterization, and application in heterogeneous catalysis. Chem. Rev. 99, 3603–3624 (1999). 5. Xin, Y. et al. Correlation of the catalytic performance with Nb2O5surface
properties in the hydrodeoxygenation of lignin model compound. J. Catal. 375, 202–212 (2019).
6. Nico, C., Monteiro, T. & Graça, M. P. F. Niobium oxides and niobates physical properties: review and prospects. Prog. Mater. Sci. 80, 1–37 (2016). 7. Nakajima, K. et al. Nb2O5·nH2O as a heterogeneous catalyst with
water-tolerant lewis acid sites. J. Am. Chem. Soc. 133, 4224–4227 (2011). 8. Nakajima, K. et al. Structure and acid catalysis of mesoporous Nb2O5·nH2O.
Chem. Mater. 22, 3332–3339 (2010).
9. Kamm, B., Gruber, P. R. & Kamm, M. Biorefineries—Industrial Processes and Products. (Wiley-VCH, Weinheim, Germany, 2006).
10. Kreissl, H. T. et al. Niobium oxides: correlation of acidity with structure and catalytic performance in sucrose conversion to 5-hydroxymethylfurfural. J. Catal. 338, 329–339 (2016).
11. Fan, W., Zhang, Q., Deng, W. & Wang, Y. Niobic acid nanosheets synthesized by a simple hydrothermal method as efficient Brønsted acid catalysts. Chem. Mater. 25, 3277–3287 (2013).
12. Murayama, T., Chen, J., Hirata, J., Matsumoto, K. & Ueda, W. Hydrothermal synthesis of octahedra-based layered niobium oxide and its catalytic activity as a solid acid. Catal. Sci. Technol. 4, 4250–4257 (2014).
13. Nakajima, K. et al. Facile formation of lactic acid from a triose sugar in water over niobium oxide with a deformed orthorhombic phase. ACS Catal. 8, 283–290 (2018).
14. Jehng, J.-M. & Wachs, I. E. The molecular structures and reactivity of supported niobium oxide catalysts. Catal. Today 8, 37–55 (1990). 15. Ko, E. I. & Weissman, J. G. Structures of niobium pentoxide and their
implications on chemical behavior. Catal. Today 8, 27–36 (1990).
16. Takagaki, A., Tagusagawa, C., Hayashi, S., Hara, M. & Domen, K. Nanosheets as highly active solid acid catalysts for green chemical syntheses. Energy Environ. Sci. 3, 82–93 (2010).
17. Kreissl, H. T. et al. Structural studies of bulk to nanosize niobium oxides with correlation to their acidity. J. Am. Chem. Soc. 139, 12670–12680 (2017). 18. Niederberger, M. & Pinna, N. Metal Oxide Nanoparticles in Organic
Solvents—Synthesis, Formation, Assembly and Application. (Springer-Verlag, London, UK, 2009).
19. Deshmukh, R. & Niederberger, M. Mechanistic aspects in the formation, growth and surface functionalization of metal oxide nanoparticles in organic solvents. Chem. Eur. J. 23, 8542–8570 (2017).
20. Goel, S. C., Chiang, M. Y., Gibbons, P. C. & Buhro, W. E. MRS Proc. 271, 3 (2011).
21. Steunou, N., Ribot, F., Boubekeur, K., Maquet, J. & Sanchez, Cm Ketones as an oxolation source for the synthesis of titanium-oxo-organoclusters. New J. Chem. 23, 1079–1086 (1999).
22. Garnweitner, G., Antonietti, M. & Niederberger, M. Nonaqueous synthesis of crystalline anatase nanoparticles in simple ketones and aldehydes as oxygen-supplying agents. Chem. Commun. 3, 397–399 (2005).
23. Beach, E. R., Shqau, K., Brown, S. E., Rozeveld, S. J. & Morris, P. A. Solvothermal synthesis of crystalline nickel oxide nanoparticles. Mater. Chem. Phys. 115, 371–377 (2009).
24. Zhou, S., Antonietti, M. & Niederberger, M. Low-temperature synthesis of γ-alumina nanocrystals from aluminum acetylacetonate in nonaqueous media. Small 3, 763–767 (2007).
25. Koziej, D. et al. Interplay between size and crystal structure of molybdenum dioxide nanoparticles-synthesis, growth mechanism, and electrochemical performance. Small 7, 377–387 (2011).
26. Al-Shaal, M. G. et al. Catalytic upgrading ofα-angelica lactone to levulinic acid esters under mild conditions over heterogeneous catalysts. Catal. Sci. Technol. 5, 5168–5173 (2015).
27. González Maldonado, G. M., Assary, R. S., Dumesic, J. A. & Curtiss, L. A. Acid-catalyzed conversion of furfuryl alcohol to ethyl levulinate in liquid ethanol. Energy Environ. Sci. 5, 8990–8997 (2012).
28. Lanzafame, P. et al. Etherification of 5-hydroxymethyl-2-furfural (HMF) with ethanol to biodiesel components using mesoporous solid acidic catalysts. Catal. Today 175, 435–441 (2011).
29. Balakrishnan, M., Sacia, E. R. & Bell, A. T. Etherification and reductive etherification of 5-(hydroxymethyl)furfural: 5-(alkoxymethyl)furfurals and 2,5- bis(alkoxymethyl)furans as potential bio-diesel candidates. Green. Chem. 14, 1626–1634 (2012).
30. Barbera, K. et al. The role of oxide location in HMF etherification with ethanol over sulfated ZrO2supported on SBA-15. J. Catal. 323, 19–32 (2015).
31. Han, X., Wahl, S., Russo, P. A. & Pinna, N. Cobalt-assisted morphology and assembly control of Co-doped ZnO nanoparticles. Nanomaterials 8, 249 (2018). 32. Kong, L. et al. Nanoarchitectured Nb2O5hollow, Nb2O5@carbon and
NbO2@carbon core–shell microspheres for ultrahigh-rate intercalation
pseudocapacitors. Sci. Rep. 6, 21177 (2016).
33. Jehng, J. M. & Wachs, I. E. Structural chemistry and Raman spectra of niobium oxides. Chem. Mater. 3, 100–107 (1991).
34. Hardcastle, F. D. & Wachs, I. E. Determination of niobium-oxygen bond distances and bond orders by Raman spectroscopy. Solid State Ion. 45, 201–213 (1991).
35. Pittman, R. M. & Bell, A. T. Raman studies of the structure of niobium oxide/ titanium oxide (Nb2O5.TiO2). J. Phys. Chem. 97, 12178–12185 (1993).
36. Bizeto, M. A., Shiguihara, A. L. & Constantino, V. R. L. Layered niobate nanosheets: building blocks for advanced materials assembly. J. Mater. Chem. 19, 2512–2525 (2009).
37. Byeon, S.-H. & Nam, H.-J. Neutron diffraction and FT-Raman study of ion-exchangeable layered titanates and niobates. Chem. Mater. 12, 1771–1778 (2000). 38. Xiong, J. et al. Ultrathin HNb3O8nanosheet: an efficient photocatalyst for the
hydrogen production. J. Mater. Chem. A 3, 20627–20632 (2015).
39. Li, M. et al. Solar-microbial hybrid device based on oxygen-deficient niobium pentoxide anodes for sustainable hydrogen production. Chem. Sci. 6, 6799–6805 (2015).
40. McCafferty, E. & Wightman, J. P. Determination of the concentration of surface hydroxyl groups on metal oxidefilms by a quantitative XPS method. Surf. Interf. Anal. 26, 549–564 (1998).
41. Zhuravlev, L. T. The surface chemistry of amorphous silica. Zhuravlev model. Colloid Surf. A. 173, 1–38 (2000).
42. Boronat, M. et al. Reactivity in the confined spaces of zeolites: the interplay between spectroscopy and theory to develop structure-activity relationships for catalysis. Phys. Chem. Chem. Phys. 11, 2876–2884 (2009).
43. Busca, G. The surface acidity of solid oxides and its characterization by IR spectroscopic methods. An attempt at systematization. Phys. Chem. Chem. Phys. 1, 723–736 (1999).
44. Pelmenschikov, A. G., van Santen, R. A., Janchen, J. & Meijer, E. Acetonitrile-d3 as a probe of Lewis and Broensted acidity of zeolites. J. Phys. Chem. 97, 11071–11074 (1993).
45. Chen, J., Thomas, J. M. & Sankar, G. IR spectroscopic study of CD3CN
adsorbed on ALPO-18 molecular sieve and the solid acid catalysts SAPO-18 and MeAPO-18. J. Chem. Soc., Faraday Trans. 90, 3455–3459 (1994). 46. Hunger, M., Ernst, S., Steuernagel, S. & Weitkamp, J. High-field 1H MAS NMR
investigations of acidic and non-acidic hydroxyl groups in zeolites Beta, H-ZSM-5, H-ZSM-58 and H-MCM-22. Micropor. Mater. 6, 349–353 (1996). 47. Takagaki, A. et al. Exfoliated nanosheets as a new strong solid acid catalyst. J.
Am. Chem. Soc. 125, 5479–5485 (2003).
48. Takagaki, A. et al. Exfoliated HNb3O8nanosheets as a strong protonic solid
acid. Chem. Mater. 17, 2487–2489 (2005).
49. Zheng, A., Liu, S.-B. & Deng, F.31P NMR chemical shifts of phosphorus
probes as reliable and practical acidity scales for solid and liquid catalysts. Chem. Rev. 117, 12475–12531 (2017).
50. Neves, P. et al. Production of biomass-derived furanic ethers and levulinate esters using heterogeneous acid catalysts. Green. Chem. 15, 3367–3376 (2013). 51. A. Russo, P. et al. Mesoporous carbon–silica solid acid catalysts for producing useful bio-products within the sugar-platform of biorefineries. Green. Chem. 16, 4292–4305 (2014).
52. Antunes, M. M. et al. Sulfonated graphene oxide as effective catalyst for conversion of 5-(Hydroxymethyl)-2-furfural into Biofuels. ChemSusChem 7, 804–812 (2014).
53. Yi, X. et al. Synthesis of butyl levulinate based onα-angelica lactone in the presence of easily separable heteropoly acid catalysts. ChemSusChem 10, 1494–1500 (2017).
54. Antunes, M. M. et al. One-pot conversion of furfural to useful bio-products in the presence of a Sn,Al-containing zeolite beta catalyst prepared via post-synthesis routes. J. Catal. 329, 522–537 (2015).
55. Nguyen, H. et al. Role of Lewis and Brønsted acidity in metal chloride catalysis in organic media: reductive etherification of furanics. ACS Catal. 7, 7363–7370 (2017).
56. Saravanamurugan, S. & Riisager, A. Solid acid catalysed formation of ethyl levulinate and ethyl glucopyranoside from mono- and disaccharides. Catal. Commun. 17, 71–75 (2012).
57. Schwartz, T. J., Allen, M., & Gramlich, W. M. Proc. 2017 AIChE Annual Meeting (AIChE, 2017).
58. Massiot, D. et al. Modelling one‐and two‐dimensional solid‐state NMR spectra. Magn. Reson. Chem. 40, 70–76 (2002).
Acknowledgements
The authors are grateful to the German Research Foundation (DFG, Grant no. RU2012/ 2-1) forfinancial support. We thank Dr. M. Feist for the help with the TG-MS mea-surements and C. Erdmann for the TEM meamea-surements. This work was partially developed in the scope of the project CICECO-Aveiro Institute of Materials, FCT (Fundação para a Ciência e Tecnologia) Ref. UID/CTM/50011/2019,financed by national funds through the FCT/MCTES. M.M.A. thanks the costs resulting from the FCT hirings which are funded by national funds (OE), through FCT, in the scope of the framework contract foreseen in the numbers 4, 5, and 6 of the article 23, of the Decree-Law 57/2016, of August 29, changed by Decree-Law 57/2017, of July 19.
Author contributions
K.S., X.H. and P.R. synthesized and characterized the material, M.A. and A.V. did the catalysis tests, S.S. conducted the Raman measurements, G.S. performed the NMR studies and N.P. and P.R. supervised this work. P.R., K.S., M.A. and A.V. prepared the manu-script. All authors discussed the results and commented the manumanu-script.
Competing interests
The authors declare no competing interests. Additional information
Supplementary information is available for this paper at https://doi.org/10.1038/s42004-019-0231-3.
Correspondence and requests for materials should be addressed to A.A.V., N.P. or P.A.R. Reprints and permission information is available athttp://www.nature.com/reprints Publisher’s note Springer Nature remains neutral with regard to jurisdictional claims in published maps and institutional affiliations.
Open Access This article is licensed under a Creative Commons Attribution 4.0 International License, which permits use, sharing, adaptation, distribution and reproduction in any medium or format, as long as you give appropriate credit to the original author(s) and the source, provide a link to the Creative Commons license, and indicate if changes were made. The images or other third party material in this article are included in the article’s Creative Commons license, unless indicated otherwise in a credit line to the material. If material is not included in the article’s Creative Commons license and your intended use is not permitted by statutory regulation or exceeds the permitted use, you will need to obtain permission directly from the copyright holder. To view a copy of this license, visithttp://creativecommons.org/ licenses/by/4.0/.