LIDAR DETECTION OF CULTURAL HERITAGE
DETERIORATING GASES
SIMONE SANTORO
ENEA - guest Department of Earth and Sea Sciences University of Palermo
GIOVANNI MAIO ENEA - guest ARES Consortium c/o University of Rome “Tor Vergata”
STEFANO PARRACINO
ENEA - guest Department of Industrial Engineering University of Rome “Tor Vergata”
LUCA FIORANI
Diagnostics and Metrology Laboratory, ENEA Frascati Research Centre
AGENZIA NAZIONALE PER LE NUOVE TECNOLOGIE, LʼENERGIA E LO SVILUPPO ECONOMICO SOSTENIBILE
LIDAR DETECTION OF CULTURAL HERITAGE
DETERIORATING GASES
SIMONE SANTORO
ENEA - guest Department of Earth and Sea Sciences University of Palermo
GIOVANNI MAIO ENEA - guest ARES Consortium c/o University of Rome “Tor Vergata”
STEFANO PARRACINO
ENEA - guest Department of Industrial Engineering University of Rome “Tor Vergata”
LUCA FIORANI
Diagnostics and Metrology Laboratory, ENEA Frascati Research Centre
I contenuti tecnico-scientifici dei rapporti tecnici dell'ENEA rispecchiano l'opinione degli autori e non necessariamente quella dell'Agenzia.
The technical and scientific contents of these reports express the opinion of the authors but not necessarily the opinion of ENEA.
I Rapporti tecnici sono scaricabili in formato pdf dal sito web ENEA alla pagina http://www.enea.it/it/produzione-scientifica/rapporti-tecnici
LIDAR DETECTION OF CULTURAL HERITAGE DETERIORATING GASES
SIMONE SANTORO, GIOVANNI MAIO, STEFANO PARRACINO, LUCA FIORANI
Sommario
L’inquinamento dell’aria ha un impatto negativo sul patrimonio culturale. I gas vulcanici contengono forti concentrazioni di biossido di zolfo, uno dei gas più deterioranti per monumenti di marmo. Questo effetto può essere molto importante in città antiche vicine a siti vulcanici. Per questo motivo e per i grandi vantaggi del rilevamento laser, lo sviluppo completo di lidar vulcanici è stato al Laboratorio Diagnostiche e Metrologia (FSN-TECFIS-DIM) dell’Agenzia Nazionale per le Nuove Tecnologie, l’Energia e lo Sviluppo Economico Sostenibile (ENEA).
Parole chiave: Patrimonio culturale, telerilevamento laser, lidar ad assorbimento differenziale, rivelazione di gas. Abstract
Air pollution have a negative impact on cultural heritage. Volcanic gases contain strong concentrations of sulfur dioxide, one of the most deteriorating gases for marble monuments. This effect can be very important in ancient cities close to volcanic sites. For this reason and for the great advantages of laser sensing, the thorough development of volcanic lidars has been undertaken at the Diagnostics and Metrology Laboratory (FSN-TECFIS-DIM) of the Italian National Agency for New Technologies, Energy and Sustainable Economic Development (ENEA).
Table of contents
Introduction ... 7
BILLI (BrIdge voLcanic LIdar) ... 9
VULLI (VULcamed Lidar) ... 11
Conclusions ... 12
Acknowledgements ... 13
Introduction
Air pollution deteriorates stone, wood, metal and glass1. In particular, stone monuments are affected by material loss, surface recession and blackening. One of the most deteriorating gases for marble is sulfur dioxide: this gas can dissolve in the water vapor in atmospheric clouds to form sulfurous acid and sulfuric acid, two components of acid rain, which then falls back corroding buildings and statues. Relevant concentrations of sulfur dioxide, one of the most dangerous gases for marble monuments, have been measured in volcanic gases2. This explain why the cultural heritage of historical cities surrounded by volcanic sites it is at high risk of fast degradation.
Ten active volcanos3 and many dormant volcanos are located in central and Southern Italy. Their craters are often very close to densely populated urban areas. In order to assess the potential risks, Italian Civil Protection National Service (DPC) supports continuous monitoring and restricts the access to dangerous zones. In this framework, the Diagnostics and Metrology Laboratory (FSN-TECFIS-DIM) of the Frascati Research Center of the Italian National Agency for New Technologies, Energy and Sustainable Economic Development (ENEA) carries out research on differential absorption lidar (DIAL)4 of carbon dioxide in volcanic plumes. Carbon dioxide has been chosen because its anomalous release has been shown to anticipate volcanic eruptions5. Nevertheless, once modeled or measured the SO2/CO2 ratio by conventional techniques, sulfur
dioxide can be accurately retrieved from carbon dioxide.
Two systems are under development: BrIdge voLcanic LIdar (BILLI)6, funded by the ERC (European Research Council) project BRIDGE, and VULcamed Lidar (VULLI) funded by the ERDF (European Regional Development Fund) project VULCAMED. The first one is based on injection seeded Nd:YAG laser, double grating dye laser, difference frequency mixing (DFM) and optical parametric amplifier (OPA), and the second one relies on injection seeded Nd:YAG laser and optical parametric oscillator (OPO).
BILLI has been mounted in a small truck and carried out the 3D profiling of the volcanic plume of Pozzuoli Solfatara in October 20147. It is the first time that carbon dioxide in a volcanic plume is retrieved by lidar, although laser remote sensing has already been applied to sound aerosol load8, sulfur dioxide9 and water vapor10 in volcanic plumes: up to now, to our knowledge, lidar soundings of CO2 have been performed, but not in volcanic plumes11, and differential absorption
measurements of volcanic CO2 have been carried out, but they were not range resolved12. VULLI
underwent a first test at the end of 2014, is under upgrade at FSN-TECFIS-DIM and it is expected to operate in a volcanic area within 2015. BILLI and VULLI can also be used for the measurement of wind speed10, thanks to their ability of aiming the laser beam in different directions. The main specifications of the two DIAL systems are listed on Table 1.
CO2 absorbs in the 15, 4.2, 2.1 and 1.6 µm bands (in order of decreasing strength)13. Unfortunately,
in the first two bands viable lasers are not available and atmospheric backscattering is rather low, so the 2.1 and 1.6 µm bands have been suggested for its detection14. Nevertheless, the DIAL measurement of CO2 remains a difficult task because the absorption lines are narrow and weak15.
As powerful, tunable and narrow-linewidth laser source we chose:
a dye laser with difference frequency mixing (DFM) and optical parametric amplifier (OPA) for BILLI,
an optical parametric oscillator (OPO) for VULLI.
Tm,Ho:YLF and fiber lasers have been discarded6 mainly for their limited tunability (few tenths of nm) that can prevent to choose the best absorption line16.
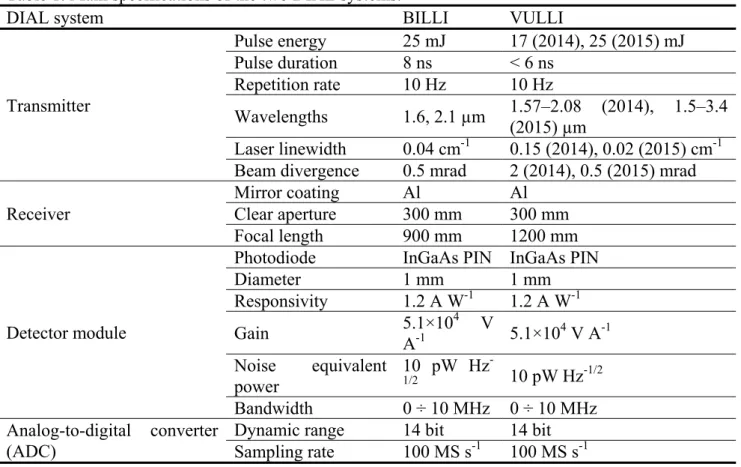
Table 1. Main specifications of the two DIAL systems.
DIAL system BILLI VULLI
Transmitter Pulse energy 25 mJ 17 (2014), 25 (2015) mJ Pulse duration 8 ns < 6 ns Repetition rate 10 Hz 10 Hz Wavelengths 1.6, 2.1 µm 1.57–2.08 (2014), 1.5–3.4 (2015) µm Laser linewidth 0.04 cm-1 0.15 (2014), 0.02 (2015) cm-1 Beam divergence 0.5 mrad 2 (2014), 0.5 (2015) mrad Receiver
Mirror coating Al Al Clear aperture 300 mm 300 mm Focal length 900 mm 1200 mm
Detector module
Photodiode InGaAs PIN InGaAs PIN Diameter 1 mm 1 mm Responsivity 1.2 A W-1 1.2 A W-1 Gain 5.1×10⁴ V A-1 5.1×10 4 V A-1 Noise equivalent power 10 pW Hz -1/2 10 pW Hz-1/2 Bandwidth 0 ÷ 10 MHz 0 ÷ 10 MHz Analog-to-digital converter (ADC)
Dynamic range 14 bit 14 bit Sampling rate 100 MS s-1 100 MS s-1
BILLI (BrIdge voLcanic LIdar)
From 13 to 17 October 2014, BILLI measured carbon dioxide inside the volcanic plume of Pozzuoli Solfatara in Contrada Pisciarelli (Campi Flegrei crater area, Naples, Italy)7. Lidar retrievals were in good agreement with conventional techniques, yet based on completely independent and significantly different approaches. Each CO2 profile was obtained averaging 200 lidar returns at 10
Hz, corresponding to a temporal resolution of 20 s. The spatial resolution was 1.5 m. A total plume scan was retrieved combining 20-30 profiles, i.e. in less than 10 minutes.
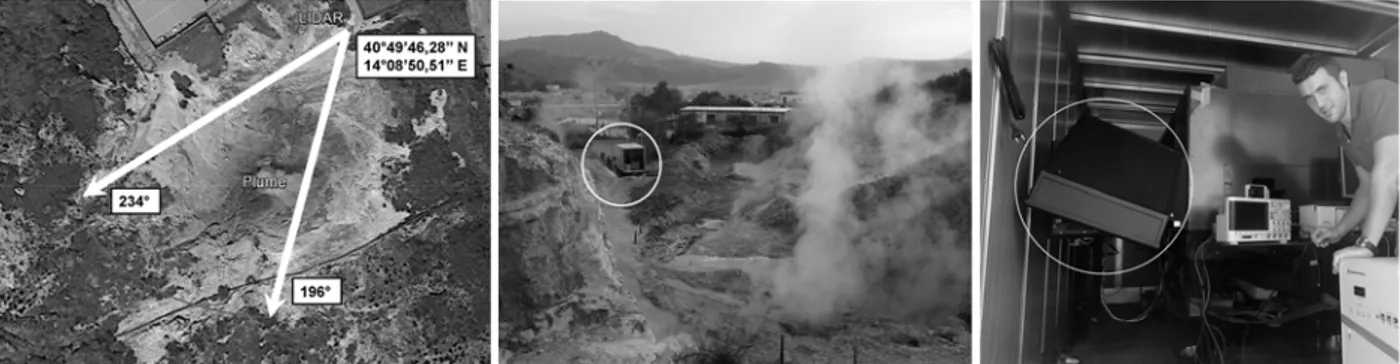
Figure 1. Left) Location of lidar and plume, and most northern/southern directions of the laser beam during the measurements. Center) Volcanic plume emitted by the Pozzuoli Solfatara in Contrada Pisciarelli. The lidar is mounted in a small truck (inside the white circle). Right) Lidar inside the truck. The laser beam is aimed by two large elliptical mirrors (major axis: 450 mm) mounted in two black boxes (inside the white circle).
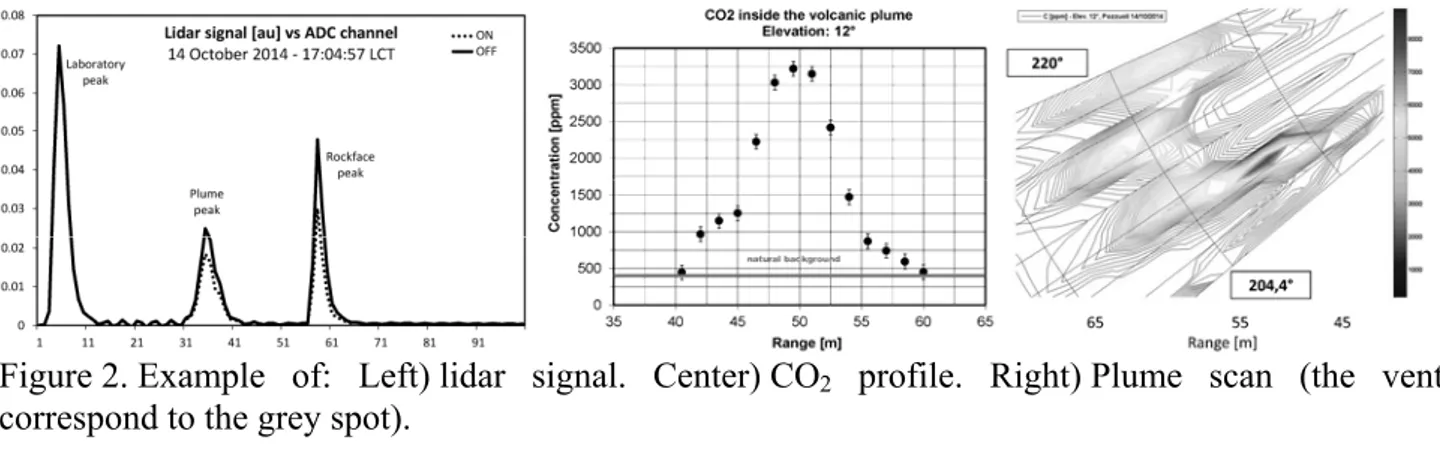
BILLI was located at latitude 40°49’46.28”N and longitude 14°08’50.51”E (Figure 1), and the laser beam scanned typically the heading angles from 196° to 234° at an elevation from 0° to 18°. The laser beam was backscattered by the plume and by the rockface (Figure 2). Each lidar return can be divided into two portions, one inside the plume and another outside it, where the CO2
concentrations equal to the natural background (C0=400 ppm). This latter includes two segments,
respectively before (length: L1) and after (length: L2) the plume interception. Assuming that inside
the plume the CO2 concentration corresponding to the i-th ADC channel (Ci), is proportional to the
lidar signal in the i-th ADC channel (Si), the optical depth of the laser path can be written as:
i i S k R L L C OD 0 1 2 , (1)where Δσ is the CO2 differential absorption cross section and k is the proportionality constant
between Ci and Si. The proportionality assumption is very reasonable because the light
backscattering is due to aerosol that is dominated by water droplets, and H2O and CO2 are usually
proportional in volcanic plumes. OD can be measured as follows:
ON L ON R OFF L OFF R S S S S OD ln , (2)where SR is the lidar signal from the rockface, SL is the signal due to the scattering, inside the
laboratory, of some photons of the transmitted laser pulse (this peak gives the exact time of pulse transmission and is proportional to the transmitted energy, thus providing the signal normalization) and λON/λOFF is the more/less absorbed wavelength used in the DIAL experiment.
Figure 2. Example of: Left) lidar signal. Center) CO2 profile. Right) Plume scan (the vent
correspond to the grey spot).
Once determined OD, equation (1) can be solved for k, the only remaining unknown, and Ci can be
simply calculated as the product of k and Si (Figure 2). Sometimes, the plume was so optically thick
that the rockface was not detected. In this case, in equation (2) the signal peak due to the plume was used instead of that due to the rockface, and carbon dioxide was retrieved only before the peak due to the plume, applying equation (1) with L2=0.
The measurement error was dominated by inaccuracy in wavelength setting. This is why, back to the Frascati Research Center, we implemented a photo-acoustic cell filled with pure CO2 at
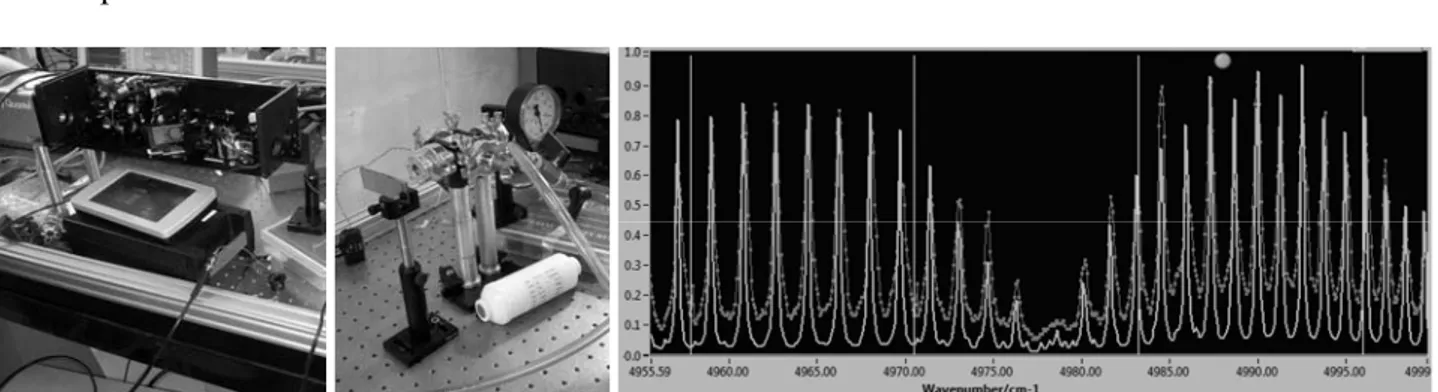
atmospheric pressure and temperature, close to the laser exit, as shown in figure 3. Using new software developed for this application, we are able to change the transmitted wavelength (by moving the stepper motor inside the resonator cavity of the dye laser) and to record the photo-acoustic signal (averaging 10 laser shots, corresponding to 1 s). Once corrected the wavelength for a small shift (0.12 cm-1), the agreement between experiment and theory15 is very good (figure 3).
Figure 3. Left) Photo-acoustic cell (inside the white circle). Right) Theoretical (line) and experimental (circles and line) CO2 absorption spectrum.
VULLI (VULcamed Lidar)
A first version of VULLI has been completed in 2014 (figure 4). It reached the following specifications:
spectral range 1.57–2.08 µm, linewidth 0.15 cm-1,
power 170 mW,
pulse duration less than 6 ns.
Figure 4. Left) The OPO opened during the test of the laser source of VULLI. Center) Photo-acoustic cell. Right) Theoretical (line) and experimental (circles and line) CO2 absorption spectrum.
The spectral purity of the laser source has been checked with a cell filled with CO2 (figure 4),
equipped with a microphone to record the photo-acoustic absorption spectrum. Theoretical15 and experimental spectrum are in excellent agreement (figure 4), demonstrating that VULLI is ready to be tested on the field, with the purpose of measuring carbon dioxide in the atmosphere.
Notwithstanding these encouraging result, the system will be upgraded in 2015, in order to reduce even more its linewidth, with the final goal of reaching a linewidth of 0.02 cm-1 (single longitudinal mode). Other specifications of VULLI will evolve as indicated in Table 1.
Conclusions
BILLI and VULLI, two differential absorption lidar for 3D profiling of carbon dioxide in volcanic plumes, are under development at the UTAPRAD-DIM laboratory of the Frascati Research Center of ENEA.
Both the laser sources developed for BILLI and VULLI are “single pieces”, realized according to our specifications by world leading manufacturers: the great challenge was to realize laser sources transmitting very narrow linewidths and operating in the harsh environment characteristic of volcanic zones. Moreover, they must reach high power and emit nearly simultaneously two wavelengths. The source chosen for BILLI is more conservative: it is more reliable and has a better quality of the laser beam (circular profile, smaller size and lower divergence). On the contrary, the source chosen for VULLI requires still development, but is less complex, large, heavy and expensive. Our strategic choice, effective up to now, was to differentiate the technical approaches, in order to increase the probability of success of our volcanic activity: in fact BILLI carried out the first lidar measurement of carbon dioxide in a volcanic plume and VULLI promises to follow the example of his older brother.
Acknowledgements
The authors are grateful to R. Fantoni and A. Palucci for constant encouragement. They thank: L. Cannilla for procurement assistance; Sirah and Laser Optronic for the BILLI laser customization (P. Jauernik and S. De Pascalis) and installation (A. Wloka and P. Stropiccioli); LaserSpec and Crisel Instruments for the VULLI laser customization (G. Penco) and installation (A. Peremans); Marcon Telescopes (L. Marcon) for telescope elements; LAV Coatings (E. Giannelli) for telescope coatings; Hamamatsu (M. Aversa) for custom detectors; TSC (M. Cesarini) for mechanical parts. The support from the ERC project BRIDGE, n. 305377, and from the ERDF project VULCAMED, n. D11D11000080007, is gratefully acknowledged.
References
[1] C. Varotsos, C. Tzanis, A. Cracknell, “The enhanced deterioration of the cultural heritage monuments due to air pollution,” Environ. Sci. Pollut. Res. 16, 590-592 (2009).
[2] A. Aiuppa, R. Moretti, C. Federico, G. Giudice, S. Gurrieri, M. Liuzzo, P. Papale, H. Shinohara, M. Valenza, “Forecasting Etna eruptions by realtime observation of volcanic gas composition,” Geology 35, 1115-1118, (2007).
[3] http://vulcani.ingv.it/en/
[4] L. Fiorani, “Lidar application to litosphere, hydrosphere and atmosphere,” in Progress in
Laser and Electro-Optics Research, V. V. Koslovskiy, ed., 21-75 (Nova, New York, 2010).
[5] A. Aiuppa, M. Burton, T. Caltabiano, G. Giudice, S. Guerrieri, M. Liuzzo, F. Murè, G. Salerno, “Unusually large magmatic CO2 gas emissions prior to a basaltic paroxysm,” Geophys. Res. Lett. 37, paper L17303 - 5 pp. (2010).
[6] L. Fiorani, A. Aiuppa, F. Angelini, R. Borelli, M. Del Franco, D. Murra, M. Pistilli, A. Puiu, S. Santoro, “Lidar sounding of volcanic plumes,” Proc. SPIE 8894, paper 7 - 10 pp. (2013).
[7] L. Fiorani, S. Santoro, S. Parracino, M. Nuvoli, C. Minopoli, A. Aiuppa, “Volcanic CO2
detection with a DFM/OPA-based lidar,” Opt. Lett. 40, 1034-1036 (2015). Early posting: http://www.opticsinfobase.org/ol/upcoming.cfm?page=7
[8] L. Fiorani, F. Colao, and A. Palucci, “Measurement of Mount Etna plume by CO2
-laser-based lidar,” Opt. Lett. 34, 800-802 (2009).
[9] P. Weibring, H. Edner, S. Svanberg, G. Cecchi, L. Pantani, R. Ferrara, and T. Caltabiano, “Monitoring of volcanic sulphur dioxide emissions using differential absorption lidar (DIAL), differential optical absorption spectroscopy (DOAS), and correlation spectroscopy (COSPEC),”
Appl. Phys. B 67, 419–426 (1998).
[10] L. Fiorani, F. Colao, A. Palucci, D. Poreh, A. Aiuppa, and G. Giudice, “First-time lidar measurement of water vapor flux in a volcanic plume,” Opt. Comm. 284, 1295–1298 (2011).
[11] G. J. Koch, J. Y. Beyon, F. Gibert, B. W. Barnes, S. Ismail. M. Petros, P. J. Petzar, J. Yu, E. A. Modlin, K. J. Davis, and U. N. Singh, “Side-line tunable laser transmitter for differential absorption lidar measurements of CO2: design and application to atmospheric measurements,” Appl. Opt. 47, 944-956 (2008).
[12] Queißer M., Burton M., Fiorani L. “Differential absorption lidar for volcanic CO2 sensing
tested in an unstable atmosphere,” Opt. Express 23, 6634-6644 (2015).
[13] P. J. Linstrom and W. G. Mallard, “The NIST Chemistry WebBook: A Chemical Data Resource on the Internet”, J. Chem. Eng. Data 46, 1059-1063 (2001).
[14] R. T. Menzies and D. M. Tratt, “Differential laser absorption spectrometry for global profiling of tropospheric carbon dioxide: selection of optimum sounding frequencies for high-precision measurements,” Appl. Opt. 42, 6569-6577 (2003).
[15] L. S. Rothman, I. E. Gordon, A. Barbe, D. C. Benner, P. F. Bernath, M. Birk, V. Boudon, L. R. Brown, A. Campargue, J.-P. Champion, K. Chance, L. H. Coudert, V. Dana, V. M. Devi, S. Fally, J.-M. Flaud, R. R. Gamache, A. Goldman, D. Jacquemart, I. Kleiner, N. Lacome, W. J. Lafferty, J.-Y. Mandin, S. T. Massie, S. N. Mikhailenko, C. E. Miller, N. Moazzen-Ahmadi, O. V. Naumenko, A. V. Nikitin, J. Orphal, V. I. Perevalov, A. Perrin, A. Predoi-Cross, C. P. Rinsland, M. Rotger, M. Šimečková, M. A. H. Smith, K. Sung, S. A. Tashkun, J. Tennyson, R. A. Toth, A. C. Vandaele, and J. VanderAuwera, “The HITRAN 2008 molecular spectroscopic database,” J. Quant.
Spectrosc. Radiat. Transfer 110, 533-572 (2009).
[16] L. Fiorani, W. R. Saleh, M. Burton, A. Puiu, and M. Queißer, “Spectroscopic considerations on DIAL measurement of carbon dioxide in volcanic emissions,” J. Optoelectron. Adv. M. 15, 317-325 (2013).
Edito dall’ENEA
Servizio Promozione e Comunicazione Lungotevere Thaon di Revel, 76 - 00196 Roma
www.enea.it
Pervenuto il 29.7.2015
Stampato presso il Laboratorio Tecnografico ENEA - C.R. Frascati Finito di stampare nel mese di settembre 2015