Anthropometric and reproductive factors and risk of esophageal
and gastric cancer by subtype and subsite: Results from the
European Prospective Investigation into Cancer and Nutrition
(EPIC) cohort
Harinakshi Sanikini 1, David C. Muller1, Marisa Sophiea1, Sabina Rinaldi2, Antonio Agudo3, Eric J. Duell 3, Elisabete Weiderpass4,5,6,7, Kim Overvad8, Anne Tjønneland9, Jytte Halkjær9, Marie-Christine Boutron-Ruault10,11,12,
Franck Carbonnel10,11,12,13, Iris Cervenka10,11,12, Heiner Boeing14, Rudolf Kaaks 15, Tilman Kühn15, Antonia Trichopoulou16, Georgia Martimianaki16, Anna Karakatsani16,17, Valeria Pala18, Domenico Palli19, Amalia Mattiello20, Rosario Tumino21, Carlotta Sacerdote22, Guri Skeie4, Charlotta Rylander4, María-Dolores Chirlaque López23,24,25, Maria-Jose Sánchez26,27, Eva Ardanaz28,29,30, Sara Regnér31, Tanja Stocks32, Bas Bueno-de-Mesquita1,33,34,35, Roel C.H. Vermeulen36,37, Dagfinn Aune1,38,39, Tammy Y.N. Tong40, Nathalie Kliemann2, Neil Murphy2, Marc Chadeau-Hyam1, Marc J. Gunter2and Amanda J. Cross1
1Department of Epidemiology and Biostatistics, School of Public Health, Imperial College London, London, United Kingdom 2Section of Nutrition and Metabolism, International Agency for Research on Cancer, Lyon, France
3Unit of Nutrition and Cancer, Cancer Epidemiology Research Program, Catalan Institute of Oncology (ICO-IDIBELL), Barcelona, Spain 4Department of Community Medicine, Faculty of Health Sciences, University of Tromsø, The Arctic University of Norway, Tromsø, Norway 5Department of Research, Cancer Registry of Norway, Institute of Population-Based Cancer Research, Oslo, Norway
6Department of Medical Epidemiology and Biostatistics, Karolinska Institutet, Stockholm, Sweden
7Genetic Epidemiology Group, Folkhälsan Research Center, Faculty of Medicine, University of Helsinki, Helsinki, Finland 8Department of Public Health, Aarhus University, Aarhus, Denmark
9Danish Cancer Society Research Center, Copenhagen, Denmark 10CESP, Faculté de Médecine, Université Paris-Sud, Villejuif, France
Key words:obesity, reproductive, hormones, esophageal, gastric, cancer
Abbreviations:BMI: body mass index; CI: confidence intervals; EA: esophageal adenocarcinoma; EPIC: European Prospective Investigation into Cancer and Nutrition; ESCC: esophageal squamous cell carcinoma; GC: gastric cardia; GNC: gastric noncardia; HC: hip circumference; HR: hazard ratio; WC: waist circumference; WHR: waist-to-hip ratio; WHtR: waist-to-height ratio
Additional Supporting Information may be found in the online version of this article.
Conflict of interest:None of the authors have any conflicts of interest to disclose.
Grant sponsor:Medical Research Council;Grant numbers:MR/M012190/1, 1000143;Grant sponsor:Cancer Research UK;
Grant numbers:C8221/A19170, C570/A16491, 14136;Grant sponsor:County Councils of Skåne and Västerbotten (Sweden);Grant sponsor:
Swedish Research Council;Grant sponsor:Swedish Cancer Society;Grant sponsor:Catalan Institute of Oncology (Spain);Grant sponsor:
Regional Governments of Andalucía, Asturias, Basque Country, Murcia;Grant number:6236;Grant sponsor:Health Research Fund (FIS);
Grant numbers:C53889/A20189, PI13/01162, PI13/00061;Grant sponsor:National Institute for Public Health and the Environment (Bilthoven, The Netherlands);Grant sponsor:Statistics Netherlands;Grant sponsor:World Cancer Research Fund (WCRF);Grant sponsor:Dutch ZON (Zorg Onderzoek Nederland);Grant sponsor:Dutch Prevention Funds;Grant sponsor:LK Research Funds;Grant sponsor:Netherlands Cancer Registry (NKR);Grant sponsor:Dutch Ministry of Public Health, Welfare and Sports (VWS);Grant sponsor:National Research Council (Italy);
Grant sponsor:Associazione Italiana per la Ricerca sul Cancro-AIRC-Italy;Grant sponsor:Hellenic Health Foundation (Greece);Grant sponsor:
Federal Ministry of Education and Research (Germany);Grant sponsor:Deutsches Krebsforschungszentrum;Grant sponsor:Deutsche Krebshilfe;
Grant sponsor:Federal Ministry of Education and Research (BMBF);Grant sponsor:German Cancer Research Centre (DKFZ);Grant sponsor:
German Cancer Aid;Grant sponsor:Institut National de la Santé et de la Recherche Médicale (INSERM, France);Grant sponsor:Mutuelle Générale de l’Education Nationale;Grant sponsor:Institut Gustave Roussy;Grant sponsor:Ligue Contre le Cancer;Grant sponsor:Danish Cancer Society (Denmark);Grant sponsor:International Agency for Research on Cancer;Grant sponsor:European Commission (DG-SANCO);
Grant sponsor:Stand Up to Cancer campaign for Cancer Research UK
DOI:10.1002/ijc.32386
This is an open access article under the terms of the Creative Commons Attribution License, which permits use, distribution and reproduction in any medium, provided the original work is properly cited.
History:Received 27 Nov 2018; Accepted 28 Mar 2019; Online 3 May 2019
Correspondence to:Dr Harinakshi Sanikini, Department of Epidemiology and Biostatistics, School of Public Health, Imperial College London, St. Mary’s Campus, Norfolk Place, London W2 1PG, United Kingdom, Tel.: +44-20-7594-9652, E-mail: [email protected]
International Journal of Cancer
IJC
Cancer
11Faculté de Médecine, UVSQ, INSERM, Université Paris-Saclay, Villejuif, France 12Institut Gustave Roussy, Villejuif, France
13Department of Gastroenterology, Bicêtre University Hospital, Assistance Publique des Hôpitaux de Paris, Le Kremlin-Bicêtre, France 14Department of Epidemiology, German Institute of Human Nutrition, Potsdam-Rehbrücke, Nuthetal, Germany
15Division of Cancer Epidemiology, German Cancer Research Center (DKFZ), Heidelberg, Germany 16Hellenic Health Foundation, Athens, Greece
17Pulmonary Medicine Department, School of Medicine, National and Kapodistrian University of Athens,“ATTIKON” University Hospital, Haidari, Greece 18Epidemiology and Prevention Unit, Department of Research, Fondazione IRCCS Istituto Nazionale dei Tumori, Milan, Italy
19Cancer Risk Factors and Life-Style Epidemiology Unit, Institute for Cancer Research, Prevention and Clinical Network-ISPRO, Florence, Italy 20Department of Clinical Medicine and Surgery, Federico II University, Naples, Italy
21Cancer Registry and Histopathology Department, "Civic - M. P. Arezzo" Hospital, ASP, Ragusa, Italy
22Unit of Cancer Epidemiology, Città della Salute e della Scienza University-Hospital and Center for Cancer Prevention (CPO), Turin, Italy 23Department of Epidemiology, Regional Health Council, IMIB-Arrixaca, Murcia, Spain
24CIBER in Epidemiology and Public Health (CIBERESP), Madrid, Spain 25Department of Health and Social Sciences, Murcia University, Murcia, Spain
26Escuela Andaluza de Salud Pública, Instituto de Investigación Biosanitaria ibs, GRANADA, Hospitales Universitarios de Granada/Universidad de Granada, Granada, Spain
27CIBER de Epidemiología y Salud Pública (CIBERESP), Madrid, Spain 28Navarra Public Health Institute, Pamplona, Spain
29IdiSNA Navarra Institute for Health Research, Pamplona, Spain 30CIBER Epidemiology and Public Health CIBERESP, Madrid, Spain
31Institution of Clinical Sciences Malmö, Skåne University Hospital, Lund University, Sweden 32Department of Clinical Sciences, Lund University, Lund, Sweden
33Department for Determinants of Chronic Diseases (DCD), National Institute for Public Health and the Environment (RIVM), Bilthoven, The Netherlands 34Department of Gastroenterology and Hepatology, University Medical Centre, Utrecht, The Netherlands
35Department of Social & Preventive Medicine, Faculty of Medicine, University of Malaya, Kuala Lumpur, Malaysia 36Institute for Risk Assessment Sciences, Utrecht University, Utrecht, The Netherlands
37Julius Centre for Public Health Sciences and Primary Care, Utrecht University Medical Centre, Utrecht, The Netherlands 38Department of Nutrition, Bjørknes University College, Oslo, Norway
39Department of Endocrinology, Morbid Obesity and Preventive Medicine, Oslo University Hospital, Oslo, Norway 40Cancer Epidemiology Unit, Nuffield Department of Population Health, University of Oxford, Oxford, United Kingdom
Obesity has been associated with upper gastrointestinal cancers; however, there are limited prospective data on associations by subtype/subsite. Obesity can impact hormonal factors, which have been hypothesized to play a role in these cancers. We investigated anthropometric and reproductive factors in relation to esophageal and gastric cancer by subtype and subsite for 476,160 participants from the European Prospective Investigation into Cancer and Nutrition cohort. Multivariable hazard ratios (HRs) and95% confidence intervals (CIs) were estimated using Cox models. During a mean follow-up of 14 years,
220 esophageal adenocarcinomas (EA), 195 esophageal squamous cell carcinomas, 243 gastric cardia (GC) and 373 gastric noncardia (GNC) cancers were diagnosed. Body mass index (BMI) was associated with EA in men (BMI≥30 vs. 18.5–25 kg/m2: HR =1.94, 95% CI: 1.25–3.03) and women (HR = 2.66, 95% CI: 1.15–6.19); however, adjustment for waist-to-hip ratio (WHR) attenuated these associations. After mutual adjustment for BMI and HC, respectively, WHR and waist circumference (WC) were associated with EA in men (HR =3.47, 95% CI: 1.99–6.06 for WHR >0.96 vs. <0.91; HR = 2.67, 95% CI: 1.52–4.72 for WC >98 vs. <90 cm) and women (HR = 4.40, 95% CI: 1.35–14.33 for WHR >0.82 vs. <0.76; HR = 5.67, 95% CI: 1.76–18.26 for WC >84 vs. <74 cm). WHR was also positively associated with GC in women, and WC was positively associated with GC in men. Inverse associations were observed between parity and EA (HR =0.38, 95% CI: 0.14–0.99; >2 vs. 0) and age at first pregnancy and GNC (HR =0.54, 95% CI: 0.32–0.91; >26 vs. <22 years); whereas bilateral ovariectomy was positively associated with GNC (HR =1.87, 95% CI: 1.04–3.36). These findings support a role for hormonal pathways in upper gastrointestinal cancers.
What’s new?
Obesity can change the body’s hormone balance, and encourage the onset of cancer. Here, the authors investigated the relationship between obesity, hormones, and esophageal and gastric cancers. Using data from the EPIC cohort, they obtained information about anthropometric and reproductive factors for476,160 participants. Excess fat around the waist, they found, was associated with esophageal adenocarcinoma and gastric cardia cancer, in women and men. In women, bearing children, as well as younger age atfirst pregnancy, had an inverse association with certain cancers. Ovariectomy was positively associated with gastric non-cardia cancer, suggesting involvement of hormone pathways in these malignancies.
Cancer
Introduction
Esophageal cancer is the seventh most common and gastric can-cer thefifth most common cancer worldwide, with an estimated 572,000 and 1,000,000 cases in 2018, respectively.1 These can-cers are more common in men than in women and are becom-ing more prevalent in many regions of the world.1Esophageal cancer can be categorized histologically as esophageal adenocar-cinoma (EA) and esophageal squamous cell caradenocar-cinoma (ESCC) and these subtypes have distinct etiologies. Gastric cancers are predominantly adenocarcinomas but their etiology appears to differ depending on their location in the gastric cardia (GC) or gastric noncardia (GNC). Smoking and alcohol are well-known risk factors for ESCC, whereas gastroesophageal reflux disease (GERD), smoking and obesity are established risk factors for EA.2Smoking and obesity are also thought to be risk factors for GC, while Helicobacter pylori infection and smoking are risk factors for GNC.3
The role of obesity in upper gastrointestinal cancers has been previously investigated in a number of epidemiological studies.4–10Two studies conducted within the European Pro-spective Investigation into Cancer and Nutrition (EPIC) cohort, reported a positive association between body mass index (BMI) and EA.4,5Two other analyses found a positive association between BMI and risk of EA and GC.11,12In addi-tion, the recent report from the World Cancer Research Fun-d/American Institute for Cancer Research (WCRF/AICR) concluded that there is “convincing” evidence that BMI increases the risk of EA.13Conversely, an inverse association between BMI and ESCC risk has been reported in several epi-demiological studies.2,4,7,14The WCRF/AICR report also con-cluded that there is “probable” evidence that BMI increases the risk of GC.13 However, few epidemiological studies have examined the association between abdominal obesity and risk of esophageal and gastric cancer by subtype or subsite and the publishedfindings are inconsistent.4,5,8,15
There are several plausible biological mechanisms underly-ing the association between obesity and upper gastrointestinal cancers. Obesity promotes GERD and its transition to Barrett’s esophagus, which increases the risk of EA and GC.12,16 Obesity is also associated with a range of metabolic and endocrinologic abnormalities. In particular, obesity can lead to insulin resistance, where circulating levels of insulin and bioavailable insulin-like growth factor (IGF) are elevated, leading to stimulation of cell proliferation and downregulation of apoptosis.17Obese individuals also have abnormal circulat-ing levels of adipokines (e.g., higher levels of leptin and lower levels of adiponectin), proinflammatory cytokines (e.g., tumor necrosis factor-α and interleukin-6) and endogenous sex ste-roids, which are synthesized in peripheral adipose tissue and may contribute to cancer development.17,18
In addition to the link through obesity, sex hormones could also explain the predominance of both esophageal and gastric cancers in men compared to women. It has been suggested that female sex hormones, particularly estrogens, may protect against
the development of esophageal and gastric cancer.19,20Some epi-demiological studies have investigated the role of hormonal and reproductive factors in the development of esophageal and gas-tric cancer risk21–24; however, prospective studies examining these relationships by subtype of esophageal cancer and subsite of gastric cancer are limited, with conflicting results.25–29 The
association between reproductive factors and gastric cancer was investigated in a previous analysis of the EPIC cohort, which included participants with follow-up through 2004; this analysis showed a positive association between ovariectomy and gastric cancer risk.28In the present study, not only did we have much longer follow-up of the EPIC cohort data, and therefore more cases, but also we studied the role of reproductive factors in both esophageal and gastric cancer by subtype and subsite.
The aim of the current study was to investigate both anthropometric and reproductive factors in relation to esoph-ageal and gastric cancer by subtype and subsite, respectively, in a large cohort study with long-term follow-up.
Materials and Methods
Study population
The EPIC study is an ongoing multicenter prospective cohort study aimed at investigating the association between diet, life-style, genetic and environmental factors and the development of cancer and other chronic diseases. The methodological details and rationale of the EPIC study have been described previ-ously.30,31 In brief, the cohort comprises of 521,448 men and women, aged 25–70 years, recruited between 1992 and 2000 from 23 centers located in 10 European countries including Denmark, France, Germany, Greece, Italy, Norway, Spain, Sweden, the Netherlands and the United Kingdom. Participants were mostly recruited from the general population with some exceptions: French participants were recruited via health insurance data-bases; some participants of the Italian and Spanish cohorts were recruited through local blood donor registries; participants of the Utrecht (the Netherlands) and Florence (Italy) cohorts were rec-ruited via breast cancer screening programs; the Oxford (United Kingdom) cohort included a large proportion of vegetarians. All participants signed an informed consent form and the study was approved by the ethical review committees of the International Agency for Research on Cancer (IARC) and EPIC centers.
For our study, we excluded participants with prevalent cancer at recruitment (n = 29,332), participants who were lost during follow-up (n = 124), participants for whom no dietary or lifestyle information was available (n = 6,259) and partici-pants who were in the top or bottom 1% of the ratio of energy intake to estimated energy requirement (n = 9,573). After the exclusions, thefinal sample available for the analysis included 476,160 participants.
Diet and lifestyle questionnaires
Usual diet was assessed at recruitment using validated country-specific dietary questionnaires reflecting intake in the past 12 months. A separate questionnaire on lifestyle factors
Cancer
was used to collect information on smoking and alcohol con-sumption, education, occupation, reproductive history, family history and physical activity.
Assessment of anthropometric and reproductive data
Anthropometric measurements including height, weight, waist circumference (WC) and hip circumference (HC) were taken at recruitment by trained health professionals in most EPIC centers, except for most of the Oxford cohort, the Norwegian cohort and approximately two-thirds of the French cohort, in which height and weight were self-reported. BMI was com-puted as weight in kilograms divided by height in meters squared, waist-to-hip ratio (WHR) was computed as WC (cm) divided by HC (cm) and waist-to-height ratio (WHtR) was computed as WC (cm) divided by height (cm).
Information on reproductive history was collected at recruit-ment. The following reproductive characteristics were assessed: age at menarche, duration of menstrual cycle, ever been preg-nant, age at first pregnancy, number of full-term pregnancies (parity), number of live-born children, breastfeeding, meno-pausal status, age at menopause, menomeno-pausal hormone use, oral contraceptive (OC) pill use and ovariectomy. More details on questionnaires can be found elsewhere.30,31
Follow-up and identification of cancer cases
Participants were followed-up from study entry until cancer diagnosis, death or end of follow-up, which is currently up to 2015, whichever camefirst. Population-based cancer registries, as well as postal follow-up questionnaires, are used in most of the countries to identify incident cancer cases. In France, Ger-many, Greece and Naples (Italy) cancer cases are additionally identified through active follow-up. Data on mortality and movement of participants are obtained through periodic link-age to regional and national mortality registries. First primary incident esophageal and gastric cancers were coded according to the 10th revision of the International Classification of Dis-eases (10). Esophageal cancer included topography ICD-O codes C15.0–C15.9; EA was categorized as (ICD-ICD-O mor-phological codes: 8140, 8141, 8190–8231, 8260–8263, 8310, 8430, 8480–8490, 8560, 8570–8572) and ESCC was catego-rized as (ICD-O morphological codes: 8050–8076). Gastric adenocarcinomas included topography ICD-O codes: C16; GC was classified as ICD-O code C16.0 and GNC included C16.1–16.6.
Statistical analysis
Cox proportional hazard models were used to calculate hazard ratios (HRs) and 95% confidence intervals (CIs) for the associa-tion between anthropometric and reproductive factors and risk of esophageal and gastric cancer by subtype and subsite, respec-tively. Age was used as the primary time metric, and entry time was defined as age at enrolment and exit time as age at diagno-sis, death or end of follow-up, whichever occurredfirst. Models were stratified by age at recruitment and study center.
Anthropometric variables. To account for different body fat distributions of men and women, we used sex-specific tertiles for anthropometric variables (height, weight, WC, HC, WHR and WHtR). BMI was classified according to World Health Organi-zation (WHO) categories: underweight (BMI < 18.5 kg/m2), nor-mal weight (18.5 ≤ BMI < 25 kg/m2), overweight (25≤ BMI < 30 kg/m2) and obese (≥30 kg/m2). Mean and standard devia-tions or frequencies were calculated for baseline characteristics of study participants stratified by BMI categories. All models were adjusted for smoking status (never smoker; former smoker who stopped≤10, 11–20 or 20+ years ago; current smoker of 1–15, 16–25 or 26+ cigarettes/day; current or occasional pipe/cigar; smoking unknown/missing), and education level (none, primary school, technical/professional, secondary school or university), while models for ESCC were additionally adjusted for alcohol intake (g/day). We also examined models in which BMI and WHR were mutually adjusted, to estimate whether abdominal obesity was associated with upper gastrointestinal cancers independently of the association with general obesity. In addition, separate models were used in which WC and HC were mutually adjusted for each other. Interactions between anthro-pometric variables with sex and smoking status were explored by including an interaction term along with the main effect term in the adjusted model. The likelihood ratio test was used to com-pare models with and without interaction terms.
Reproductive variables. Reproductive variables were classi-fied into categories as follows: age at menarche (<12, 12–14, >14 years), duration of menstrual cycling (<30, 30–35, >35 years), ever been pregnant (yes/no), age atfirst pregnancy (<22, 22–26, >26 years), parity (0, 1–2, >2 pregnancies), num-ber of live-born children (1, 2–3, >3), breastfeeding (yes/no), duration of breastfeeding (<4, 4–10, >10 months), menopausal status (pre/perimenopausal, postmenopausal), age at meno-pause (<48, 48–51, >51 years), menopausal hormone use (yes/no), duration of menopausal hormone use (<2,≥2 years), OC pill use (yes/no), duration of OC pill use (<5, ≥5 years) and ovariectomy (no, unilateral, bilateral). We computed mean and standard deviations or frequencies for baseline characteristics in women stratified by OC and menopausal hormone use. Models for EA, GC and GNC were adjusted for smoking status, BMI and educational level, while models for ESCC were additionally adjusted for alcohol intake (g/day).
Tests for linear trend across categories of anthropometric and reproductive variables were performed by assigning the median value to each category as a continuous term in the Cox regression models.
To examine possible reverse causation, we performed sensi-tivity analyses by excluding esophageal and gastric cancer cases diagnosed in thefirst 2 years of follow up. Additional sensitivity analyses included restricting the analyses to participants in whom height and weight were measured rather than self-reported. To examine whether the excluded participants dif-fered from those included, we compared the main baseline
Cancer
characteristics in the included participants (n = 476,160) to those participants with no dietary or lifestyle information (n = 6,259).
All analyses were conducted using SAS 9.4 software (SAS Institute, Cary, NC) and p values <0.05 were considered statis-tically significant.
Results
During a mean follow-up of 14 years, 220 EA (171 men and 49 women), 195 ESCC (101 men and 94 women), 243 GC (163 men and 80 women) and 373 GNC (184 men and 189 women) cases were diagnosed among the 476,160 partici-pants (142,241 men and 333,919 women).
Anthropometric factors
In the overall cohort, 1.1% of participants were underweight, 37.8% were normal weight, 30.9% were overweight and 12.4% were obese at baseline. Baseline characteristics by BMI catego-ries are presented in Supporting Information Table S1. Obese men and women were slightly older, had a higher WC and HC, lower education level, less likely to be smokers, less physically active and had a higher prevalence of diabetes than normal weight subjects. In addition, obese men had a higher intake of fruits and vegetables.
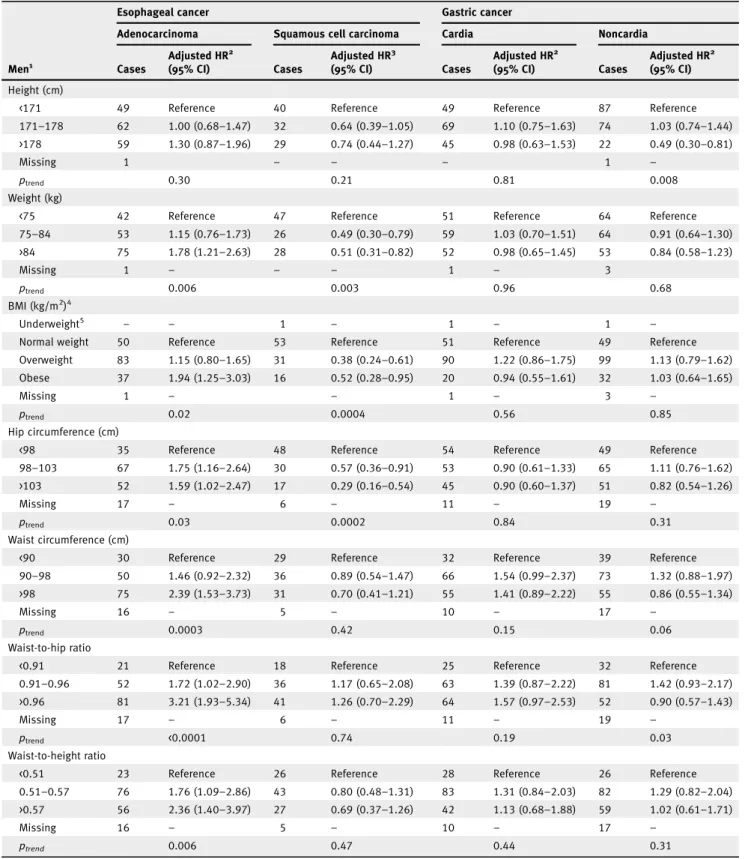
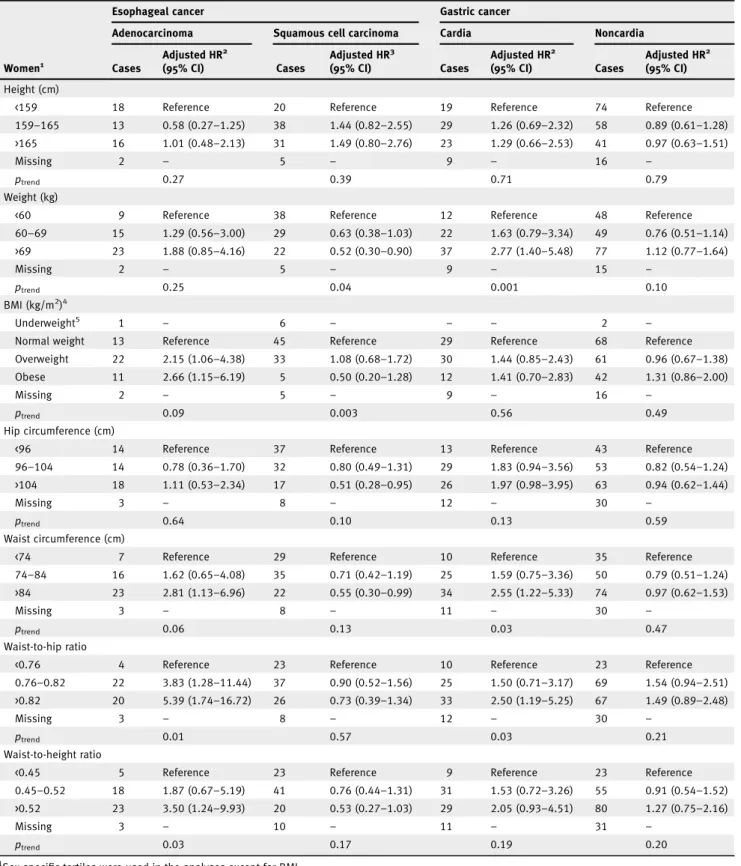
Several anthropometric variables were positively associated with EA in both men and women (Tables 1 and 2), respec-tively, including BMI (obese vs. normal weight, men: HR 1.94, 95% CI: 1.25–3.03; women: HR 2.66, 95% CI: 1.15–6.19), WC (men: HR 2.39, 95% CI: 1.53–3.73 for >98 vs. <90 cm; women: HR 2.81, 95% CI: 1.13–6.96 for WC >84 vs. <74 cm), WHR (men: HR 3.21, 95% CI: 1.93–5.34 for >0.96 vs. <0.91; women: HR 5.39, 95% CI: 1.74–16.72 for >0.82 vs. <0.76) and WHtR (men: HR 2.36, 95% CI: 1.40–3.97 for >0.57 vs. <0.51; women: HR 3.50, 95% CI: 1.24–9.93 for >0.52 vs. <0.45). In addition, weight and HC were positively associated with EA in men but not in women (Tables 1 and 2).
We observed inverse associations between some anthropo-metric variables and ESCC, including weight and HC in both men and women (Tables 1 and 2) and specifically BMI in men (HR 0.52, 95% CI: 0.28–0.95 for obese vs. normal weight; p-value for interaction by sex = 0.009; Table 1), and WC in women (HR 0.55, 95% CI: 0.30–0.99 for WC >84 vs. <74 cm), although the p-value for interaction by sex was not statistically significant (Table 2).
WHR was positively associated with GC in both men and women, although the association was not statistically signifi-cant in men (HR 1.57, 95% CI: 0.97–2.53 for WHR >0.96 vs. <0.91 and HR 2.50, 95% CI: 1.19–5.25 for WHR >0.82 vs. <0.76, respectively; Tables 1 and 2). In addition, weight and WC were positively associated with GC in women (Table 2). For GNC, there was an inverse association between height and GNC in men (HR 0.49, 95% CI: 0.30–0.81 for height >178 vs. <171 cm) but not in women (HR 0.97, 95% CI: 0.63–1.51 for height >165 vs. <159 cm; Tables 1 and 2).
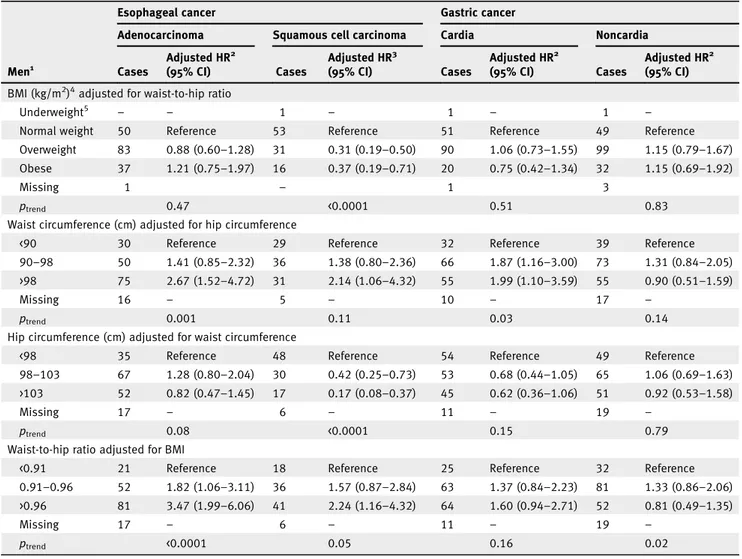
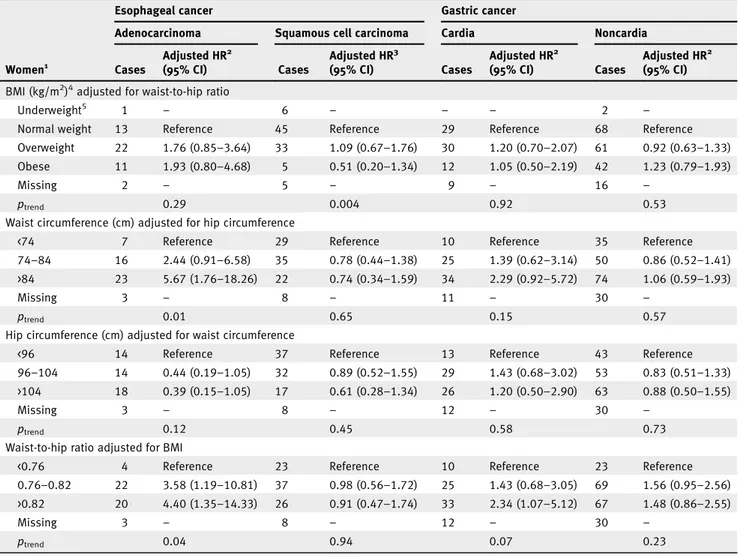
BMI and WHR were moderately correlated (r = 0.43), as were WC and HC (r = 0.67). Upon adjustment for WHR, BMI was no longer significantly associated with EA in men or women (HR 1.21, 95% CI: 0.75–1.97 and HR 1.93, 95% CI: 0.80–4.68 for obese vs. normal weight, respectively; Tables 3 and 4). Con-versely, the positive association observed for WC and WHR in relation to EA remained significant in both men and women after adjustment for HC and BMI, respectively (Tables 3 and 4). Furthermore, the positive association observed between HC and EA in men was attenuated after adjustment for WC (Table 3). For ESCC, the inverse association observed with BMI and HC in men remained significant after adjustment for WHR and WC, respectively (Table 3). In contrast, a positive association was observed in men for ESCC with WC adjusted for HC (HR 2.14, 95% CI: 1.06–4.32 for WC >98 vs. <90 cm) and WHR adjusted for BMI (HR 2.24, 95% CI: 1.16–4.32 for WHR >0.96 vs. <0.91; Table 3). While in women, the inverse association observed for ESCC with WC and HC was no longer significant after mutual adjustment (Table 4).
After adjustment for BMI, WHR remained positively asso-ciated with GC in women (Table 4). A positive association was found between WC and GC in men after adjustment for HC (HR 1.99, 95% CI: 1.10–3.59 for >98 vs. <90 cm; Table 3). While the positive association observed for GC with WC in women was attenuated after adjustment for HC (HR 2.29, 95% CI: 0.92–5.72 for WC >84 vs. <74 cm; Table 4). For GNC, results did not change when we mutually adjusted for BMI and WHR or when WC and HC were mutually adjusted in either men or women (Tables 3 and 4).
No statistically significant interactions were observed between BMI or smoking status and any of the outcomes.
Reproductive factors
Baseline characteristics of women according to OC and meno-pausal hormonal use are presented in Supporting Information Table S2. Women who reported using OC pills were younger, had a slightly lower WC and HC, were more educated, more likely to be smokers and more physically active, had a lower intake of fruits and vegetables and lower prevalence of diabetes compared to nonusers of OC. While women who reported using hormones for menopause were slightly older and less educated than nonusers.
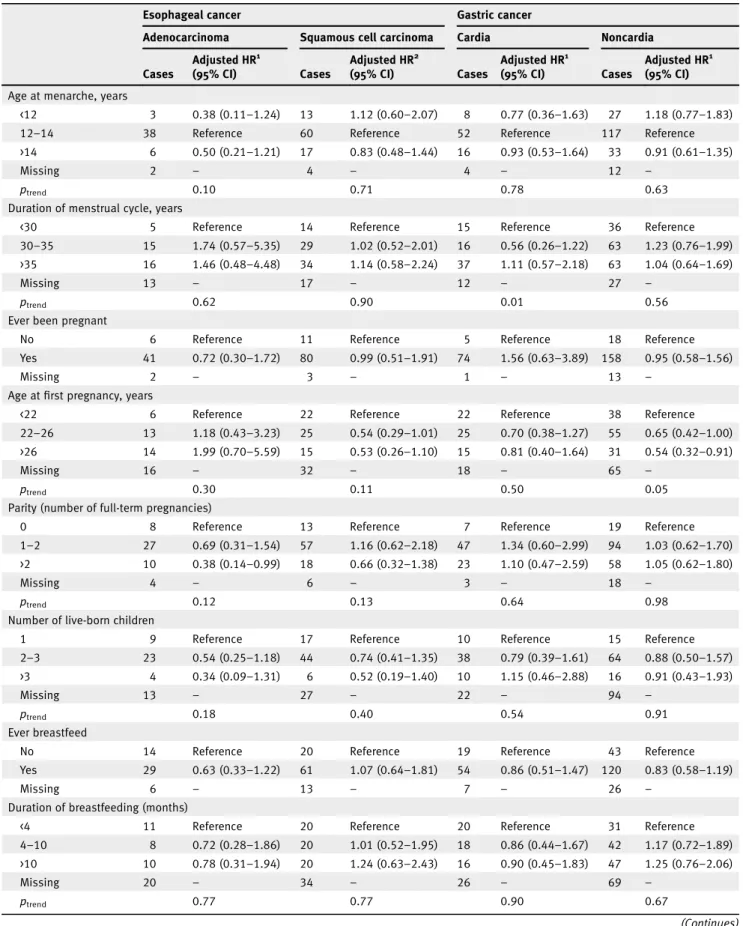
We found no associations between reproductive factors and ESCC or GC (Table 5). However, an inverse association was observed between parity and EA (HR 0.38, 95% CI: 0.14–0.99 for >2 vs. 0 pregnancies). For GNC, compared to women who had theirfirst pregnancy at an earlier age (<22 years), women who had their pregnancy at a later age (>26 years) had a lower risk of GNC (HR 0.54, 95% CI: 0.32–0.91). In addition, com-pared to women who had not undergone ovariectomy, women who had a bilateral ovariectomy had a higher risk of GNC (HR 1.87, 95% CI: 1.04–3.36), although there were only 13 cases in this group.
Cancer
Table 1.Adjusted hazard ratios for esophageal and gastric cancer by subtype and subsite in men (n = 142,241) according to anthropometric factors in the EPIC study
Esophageal cancer Gastric cancer
Adenocarcinoma Squamous cell carcinoma Cardia Noncardia
Men1 Cases Adjusted HR2 (95% CI) Cases Adjusted HR3 (95% CI) Cases Adjusted HR2 (95% CI) Cases Adjusted HR2 (95% CI) Height (cm)
<171 49 Reference 40 Reference 49 Reference 87 Reference
171–178 62 1.00 (0.68–1.47) 32 0.64 (0.39–1.05) 69 1.10 (0.75–1.63) 74 1.03 (0.74–1.44) >178 59 1.30 (0.87–1.96) 29 0.74 (0.44–1.27) 45 0.98 (0.63–1.53) 22 0.49 (0.30–0.81)
Missing 1 – – – 1 –
ptrend 0.30 0.21 0.81 0.008
Weight (kg)
<75 42 Reference 47 Reference 51 Reference 64 Reference
75–84 53 1.15 (0.76–1.73) 26 0.49 (0.30–0.79) 59 1.03 (0.70–1.51) 64 0.91 (0.64–1.30) >84 75 1.78 (1.21–2.63) 28 0.51 (0.31–0.82) 52 0.98 (0.65–1.45) 53 0.84 (0.58–1.23) Missing 1 – – – 1 – 3 ptrend 0.006 0.003 0.96 0.68 BMI (kg/m2)4 Underweight5 – – 1 – 1 – 1 –
Normal weight 50 Reference 53 Reference 51 Reference 49 Reference
Overweight 83 1.15 (0.80–1.65) 31 0.38 (0.24–0.61) 90 1.22 (0.86–1.75) 99 1.13 (0.79–1.62) Obese 37 1.94 (1.25–3.03) 16 0.52 (0.28–0.95) 20 0.94 (0.55–1.61) 32 1.03 (0.64–1.65)
Missing 1 – – 1 – 3 –
ptrend 0.02 0.0004 0.56 0.85
Hip circumference (cm)
<98 35 Reference 48 Reference 54 Reference 49 Reference
98–103 67 1.75 (1.16–2.64) 30 0.57 (0.36–0.91) 53 0.90 (0.61–1.33) 65 1.11 (0.76–1.62) >103 52 1.59 (1.02–2.47) 17 0.29 (0.16–0.54) 45 0.90 (0.60–1.37) 51 0.82 (0.54–1.26)
Missing 17 – 6 – 11 – 19 –
ptrend 0.03 0.0002 0.84 0.31
Waist circumference (cm)
<90 30 Reference 29 Reference 32 Reference 39 Reference
90–98 50 1.46 (0.92–2.32) 36 0.89 (0.54–1.47) 66 1.54 (0.99–2.37) 73 1.32 (0.88–1.97) >98 75 2.39 (1.53–3.73) 31 0.70 (0.41–1.21) 55 1.41 (0.89–2.22) 55 0.86 (0.55–1.34)
Missing 16 – 5 – 10 – 17 –
ptrend 0.0003 0.42 0.15 0.06
Waist-to-hip ratio
<0.91 21 Reference 18 Reference 25 Reference 32 Reference
0.91–0.96 52 1.72 (1.02–2.90) 36 1.17 (0.65–2.08) 63 1.39 (0.87–2.22) 81 1.42 (0.93–2.17) >0.96 81 3.21 (1.93–5.34) 41 1.26 (0.70–2.29) 64 1.57 (0.97–2.53) 52 0.90 (0.57–1.43)
Missing 17 – 6 – 11 – 19 –
ptrend <0.0001 0.74 0.19 0.03
Waist-to-height ratio
<0.51 23 Reference 26 Reference 28 Reference 26 Reference
0.51–0.57 76 1.76 (1.09–2.86) 43 0.80 (0.48–1.31) 83 1.31 (0.84–2.03) 82 1.29 (0.82–2.04) >0.57 56 2.36 (1.40–3.97) 27 0.69 (0.37–1.26) 42 1.13 (0.68–1.88) 59 1.02 (0.61–1.71)
Missing 16 – 5 – 10 – 17 –
ptrend 0.006 0.47 0.44 0.31
1
Sex-specific tertiles were used in the analyses except for BMI. 2Stratified on age, center and adjusted for smoking and education level.
3Stratified on age, center and adjusted for smoking, education level and alcohol intake.
4Underweight (BMI <18.5), normal weight (18.5≤ BMI < 25), overweight (25 ≤ BMI < 30) and obese (BMI ≥30). 5
We excluded underweight group from the analysis due to few number of cases.
Cancer
Table 2.Adjusted hazard ratios for esophageal and gastric cancer by subtype and subsite in women (n = 333,919) according to anthropometric factors in the EPIC study
Esophageal cancer Gastric cancer
Adenocarcinoma Squamous cell carcinoma Cardia Noncardia
Women1 Cases Adjusted HR2 (95% CI) Cases Adjusted HR3 (95% CI) Cases Adjusted HR2 (95% CI) Cases Adjusted HR2 (95% CI) Height (cm)
<159 18 Reference 20 Reference 19 Reference 74 Reference
159–165 13 0.58 (0.27–1.25) 38 1.44 (0.82–2.55) 29 1.26 (0.69–2.32) 58 0.89 (0.61–1.28) >165 16 1.01 (0.48–2.13) 31 1.49 (0.80–2.76) 23 1.29 (0.66–2.53) 41 0.97 (0.63–1.51)
Missing 2 – 5 – 9 – 16 –
ptrend 0.27 0.39 0.71 0.79
Weight (kg)
<60 9 Reference 38 Reference 12 Reference 48 Reference
60–69 15 1.29 (0.56–3.00) 29 0.63 (0.38–1.03) 22 1.63 (0.79–3.34) 49 0.76 (0.51–1.14) >69 23 1.88 (0.85–4.16) 22 0.52 (0.30–0.90) 37 2.77 (1.40–5.48) 77 1.12 (0.77–1.64) Missing 2 – 5 – 9 – 15 – ptrend 0.25 0.04 0.001 0.10 BMI (kg/m2)4 Underweight5 1 – 6 – – – 2 –
Normal weight 13 Reference 45 Reference 29 Reference 68 Reference
Overweight 22 2.15 (1.06–4.38) 33 1.08 (0.68–1.72) 30 1.44 (0.85–2.43) 61 0.96 (0.67–1.38) Obese 11 2.66 (1.15–6.19) 5 0.50 (0.20–1.28) 12 1.41 (0.70–2.83) 42 1.31 (0.86–2.00)
Missing 2 – 5 – 9 – 16 –
ptrend 0.09 0.003 0.56 0.49
Hip circumference (cm)
<96 14 Reference 37 Reference 13 Reference 43 Reference
96–104 14 0.78 (0.36–1.70) 32 0.80 (0.49–1.31) 29 1.83 (0.94–3.56) 53 0.82 (0.54–1.24) >104 18 1.11 (0.53–2.34) 17 0.51 (0.28–0.95) 26 1.97 (0.98–3.95) 63 0.94 (0.62–1.44)
Missing 3 – 8 – 12 – 30 –
ptrend 0.64 0.10 0.13 0.59
Waist circumference (cm)
<74 7 Reference 29 Reference 10 Reference 35 Reference
74–84 16 1.62 (0.65–4.08) 35 0.71 (0.42–1.19) 25 1.59 (0.75–3.36) 50 0.79 (0.51–1.24) >84 23 2.81 (1.13–6.96) 22 0.55 (0.30–0.99) 34 2.55 (1.22–5.33) 74 0.97 (0.62–1.53)
Missing 3 – 8 – 11 – 30 –
ptrend 0.06 0.13 0.03 0.47
Waist-to-hip ratio
<0.76 4 Reference 23 Reference 10 Reference 23 Reference
0.76–0.82 22 3.83 (1.28–11.44) 37 0.90 (0.52–1.56) 25 1.50 (0.71–3.17) 69 1.54 (0.94–2.51) >0.82 20 5.39 (1.74–16.72) 26 0.73 (0.39–1.34) 33 2.50 (1.19–5.25) 67 1.49 (0.89–2.48)
Missing 3 – 8 – 12 – 30 –
ptrend 0.01 0.57 0.03 0.21
Waist-to-height ratio
<0.45 5 Reference 23 Reference 9 Reference 23 Reference
0.45–0.52 18 1.87 (0.67–5.19) 41 0.76 (0.44–1.31) 31 1.53 (0.72–3.26) 55 0.91 (0.54–1.52) >0.52 23 3.50 (1.24–9.93) 20 0.53 (0.27–1.03) 29 2.05 (0.93–4.51) 80 1.27 (0.75–2.16)
Missing 3 – 10 – 11 – 31 –
ptrend 0.03 0.17 0.19 0.20
1
Sex-specific tertiles were used in the analyses except for BMI. 2Stratified on age, center and adjusted for smoking, and education level.
3Stratified on age, center and adjusted for smoking, education level, and alcohol intake.
4Underweight (BMI < 18.5), normal weight (18.5≤ BMI < 25), overweight (25 ≤ BMI < 30) and obese (BMI ≥30). 5
We excluded underweight group from the analysis due to few number of cases.
Cancer
Exclusion of esophageal and gastric cancer cases diagnosed in the first 2 years of follow-up did not substantially change the associations observed for anthropometric or reproductive factors (data not shown). In addition, analyses restricted to measured anthropometric factors yielded similar results to those when par-ticipants with self-reported data were included (data not shown). Finally, comparing the baseline characteristics of included partic-ipants to those excluded from the analysis because they lacked dietary or lifestyle information, revealed no substantial differ-ences between the two groups, except participants excluded were very slightly older than the included participants.
Discussion
In this large prospective study, abdominal obesity was positively associated with EA and GC, while thefindings for ESCC were less clear. No associations were observed for GNC either with general
or abdominal obesity. With regards to reproductive factors in women, there were inverse associations between parity and EA and between age atfirst pregnancy and GNC; whereas a positive association was observed for bilateral ovariectomy and GNC.
A number of meta-analyses have shown that BMI was pos-itively associated with EA and GC.11,12,32 Our study found a positive association between BMI and EA but these associa-tions attenuated after adjustment for WHR, and no significant association was observed between BMI and GC independently of WHR. The NIH-AARP Diet and Health Study, a prospec-tive cohort study of equivalent size to EPIC, showed a nonsig-nificant positive association between BMI and EA (HR 1.77, 95% CI: 0.90–3.49; for BMI ≥35 vs. 18.5 to <25) and a signifi-cant positive association between BMI and GC (HR 3.28, 95% CI: 1.76–6.11 for BMI ≥35 vs. 18.5 to <25) after adjustment for WHR.15 A nested case–control study also reported no
Table 3.Adjusted hazard ratios for esophageal and gastric cancer by subtype and subsite in men (n = 142,241) according to anthropometric factors (mutually adjusted) in the EPIC study
Esophageal cancer Gastric cancer
Adenocarcinoma Squamous cell carcinoma Cardia Noncardia
Men1 Cases Adjusted HR2 (95% CI) Cases Adjusted HR3 (95% CI) Cases Adjusted HR2 (95% CI) Cases Adjusted HR2 (95% CI) BMI (kg/m2)4adjusted for waist-to-hip ratio
Underweight5 – – 1 – 1 – 1 –
Normal weight 50 Reference 53 Reference 51 Reference 49 Reference
Overweight 83 0.88 (0.60–1.28) 31 0.31 (0.19–0.50) 90 1.06 (0.73–1.55) 99 1.15 (0.79–1.67) Obese 37 1.21 (0.75–1.97) 16 0.37 (0.19–0.71) 20 0.75 (0.42–1.34) 32 1.15 (0.69–1.92)
Missing 1 – 1 3
ptrend 0.47 <0.0001 0.51 0.83
Waist circumference (cm) adjusted for hip circumference
<90 30 Reference 29 Reference 32 Reference 39 Reference
90–98 50 1.41 (0.85–2.32) 36 1.38 (0.80–2.36) 66 1.87 (1.16–3.00) 73 1.31 (0.84–2.05) >98 75 2.67 (1.52–4.72) 31 2.14 (1.06–4.32) 55 1.99 (1.10–3.59) 55 0.90 (0.51–1.59)
Missing 16 – 5 – 10 – 17 –
ptrend 0.001 0.11 0.03 0.14
Hip circumference (cm) adjusted for waist circumference
<98 35 Reference 48 Reference 54 Reference 49 Reference
98–103 67 1.28 (0.80–2.04) 30 0.42 (0.25–0.73) 53 0.68 (0.44–1.05) 65 1.06 (0.69–1.63) >103 52 0.82 (0.47–1.45) 17 0.17 (0.08–0.37) 45 0.62 (0.36–1.06) 51 0.92 (0.53–1.58)
Missing 17 – 6 – 11 – 19 –
ptrend 0.08 <0.0001 0.15 0.79
Waist-to-hip ratio adjusted for BMI
<0.91 21 Reference 18 Reference 25 Reference 32 Reference
0.91–0.96 52 1.82 (1.06–3.11) 36 1.57 (0.87–2.84) 63 1.37 (0.84–2.23) 81 1.33 (0.86–2.06) >0.96 81 3.47 (1.99–6.06) 41 2.24 (1.16–4.32) 64 1.60 (0.94–2.71) 52 0.81 (0.49–1.35)
Missing 17 – 6 – 11 – 19 –
ptrend <0.0001 0.05 0.16 0.02
1Sex-specific tertiles were used in the analyses except for BMI. 2Stratified on age, center and adjusted for smoking and education level.
3Stratified on age, center and adjusted for smoking, education level and alcohol intake. 4
Underweight (BMI < 18.5), normal weight (18.5≤ BMI < 25), overweight (25 ≤ BMI < 30) and obese (BMI ≥30). 5We excluded underweight group from the analysis due to few number of cases.
Cancer
association between BMI and EA after adjustment for abdom-inal diameter.33
In our study, WHR and WC were positively associated with EA independently of BMI and HC. WHR was also positively associated with GC in women only independently of BMI, and WC was positively associated with GC in men after adjustment for HC. The NIH-AARP Diet and Health Study showed a posi-tive association between WHR and EA (HR 1.17, 95% CI: 0.99–2.18; for Quartile 4 vs. Quartile 1), but no association between WHR and GC (HR 1.08, 95% CI: 0.71–1.63; for Quar-tile 4 vs. QuarQuar-tile 1) when adjusted for BMI.15This cohort study also showed a positive association between WC and risk of EA and GC, after adjustment for HC.15 In addition, two other
cohort studies showed a positive association between WC and EA but thesefindings were not adjusted for HC.33,34 A recent meta-analysis of six prospective studies reported positive associ-ations for GC with WC but not with WHR.35
Taken together, our findings show that WC and WHR rather than BMI appears to be more closely associated with EA and GC. These associations could potentially be explained by mechanical effects of obesity, especially abdominal obesity-promoting GERD, which is associated with an increased risk of EA and GC.16,33
In our study, thefindings for ESCC were less clear; for exam-ple, in men, HC and BMI were inversely associated with ESCC, while WC and WHR were positively associated. A number of prospective cohort studies have reported an inverse association between BMI and ESCC.2,7,14 Few epidemiological studies have examined the association between abdominal obesity and ESCC and those that have reported no associations.33,34The underlying mechanisms for the observed associations between adiposity and ESCC are not well-known and need to be further investigated but our study sheds further light on the contrasting observations for anthropometric measures and ESCC.
Table 4.Adjusted hazard ratios for esophageal and gastric cancer by subtype and subsite in women (n = 333,919) according to anthropometric factors (mutually adjusted) in the EPIC study
Esophageal cancer Gastric cancer
Adenocarcinoma Squamous cell carcinoma Cardia Noncardia
Women1 Cases Adjusted HR2 (95% CI) Cases Adjusted HR3 (95% CI) Cases Adjusted HR2 (95% CI) Cases Adjusted HR2 (95% CI) BMI (kg/m2)4adjusted for waist-to-hip ratio
Underweight5 1 – 6 – – – 2 –
Normal weight 13 Reference 45 Reference 29 Reference 68 Reference
Overweight 22 1.76 (0.85–3.64) 33 1.09 (0.67–1.76) 30 1.20 (0.70–2.07) 61 0.92 (0.63–1.33) Obese 11 1.93 (0.80–4.68) 5 0.51 (0.20–1.34) 12 1.05 (0.50–2.19) 42 1.23 (0.79–1.93)
Missing 2 – 5 – 9 – 16 –
ptrend 0.29 0.004 0.92 0.53
Waist circumference (cm) adjusted for hip circumference
<74 7 Reference 29 Reference 10 Reference 35 Reference
74–84 16 2.44 (0.91–6.58) 35 0.78 (0.44–1.38) 25 1.39 (0.62–3.14) 50 0.86 (0.52–1.41) >84 23 5.67 (1.76–18.26) 22 0.74 (0.34–1.59) 34 2.29 (0.92–5.72) 74 1.06 (0.59–1.93)
Missing 3 – 8 – 11 – 30 –
ptrend 0.01 0.65 0.15 0.57
Hip circumference (cm) adjusted for waist circumference
<96 14 Reference 37 Reference 13 Reference 43 Reference
96–104 14 0.44 (0.19–1.05) 32 0.89 (0.52–1.55) 29 1.43 (0.68–3.02) 53 0.83 (0.51–1.33) >104 18 0.39 (0.15–1.05) 17 0.61 (0.28–1.34) 26 1.20 (0.50–2.90) 63 0.88 (0.50–1.55)
Missing 3 – 8 – 12 – 30 –
ptrend 0.12 0.45 0.58 0.73
Waist-to-hip ratio adjusted for BMI
<0.76 4 Reference 23 Reference 10 Reference 23 Reference
0.76–0.82 22 3.58 (1.19–10.81) 37 0.98 (0.56–1.72) 25 1.43 (0.68–3.05) 69 1.56 (0.95–2.56) >0.82 20 4.40 (1.35–14.33) 26 0.91 (0.47–1.74) 33 2.34 (1.07–5.12) 67 1.48 (0.86–2.55)
Missing 3 – 8 – 12 – 30 –
ptrend 0.04 0.94 0.07 0.23
1Sex-specific tertiles were used in the analyses except for BMI. 2Stratified on age, center and adjusted for smoking, and education level.
3Stratified on age, center and adjusted for smoking, education level, and alcohol intake. 4
Underweight (BMI <18.5), normal weight (18.5≤ BMI < 25), overweight (25 ≤ BMI < 30) and obese (BMI ≥30). 5We excluded underweight group from the analysis due to few number of cases.
Cancer
Table 5.Adjusted hazard ratios for esophageal and gastric cancer by subtype and subsite according to reproductive factors in women (n = 333,919) in the EPIC study
Esophageal cancer Gastric cancer
Adenocarcinoma Squamous cell carcinoma Cardia Noncardia
Cases Adjusted HR1 (95% CI) Cases Adjusted HR2 (95% CI) Cases Adjusted HR1 (95% CI) Cases Adjusted HR1 (95% CI) Age at menarche, years
<12 3 0.38 (0.11–1.24) 13 1.12 (0.60–2.07) 8 0.77 (0.36–1.63) 27 1.18 (0.77–1.83)
12–14 38 Reference 60 Reference 52 Reference 117 Reference
>14 6 0.50 (0.21–1.21) 17 0.83 (0.48–1.44) 16 0.93 (0.53–1.64) 33 0.91 (0.61–1.35)
Missing 2 – 4 – 4 – 12 –
ptrend 0.10 0.71 0.78 0.63
Duration of menstrual cycle, years
<30 5 Reference 14 Reference 15 Reference 36 Reference
30–35 15 1.74 (0.57–5.35) 29 1.02 (0.52–2.01) 16 0.56 (0.26–1.22) 63 1.23 (0.76–1.99) >35 16 1.46 (0.48–4.48) 34 1.14 (0.58–2.24) 37 1.11 (0.57–2.18) 63 1.04 (0.64–1.69)
Missing 13 – 17 – 12 – 27 –
ptrend 0.62 0.90 0.01 0.56
Ever been pregnant
No 6 Reference 11 Reference 5 Reference 18 Reference
Yes 41 0.72 (0.30–1.72) 80 0.99 (0.51–1.91) 74 1.56 (0.63–3.89) 158 0.95 (0.58–1.56)
Missing 2 – 3 – 1 – 13 –
Age at first pregnancy, years
<22 6 Reference 22 Reference 22 Reference 38 Reference
22–26 13 1.18 (0.43–3.23) 25 0.54 (0.29–1.01) 25 0.70 (0.38–1.27) 55 0.65 (0.42–1.00) >26 14 1.99 (0.70–5.59) 15 0.53 (0.26–1.10) 15 0.81 (0.40–1.64) 31 0.54 (0.32–0.91)
Missing 16 – 32 – 18 – 65 –
ptrend 0.30 0.11 0.50 0.05
Parity (number of full-term pregnancies)
0 8 Reference 13 Reference 7 Reference 19 Reference
1–2 27 0.69 (0.31–1.54) 57 1.16 (0.62–2.18) 47 1.34 (0.60–2.99) 94 1.03 (0.62–1.70) >2 10 0.38 (0.14–0.99) 18 0.66 (0.32–1.38) 23 1.10 (0.47–2.59) 58 1.05 (0.62–1.80)
Missing 4 – 6 – 3 – 18 –
ptrend 0.12 0.13 0.64 0.98
Number of live-born children
1 9 Reference 17 Reference 10 Reference 15 Reference
2–3 23 0.54 (0.25–1.18) 44 0.74 (0.41–1.35) 38 0.79 (0.39–1.61) 64 0.88 (0.50–1.57) >3 4 0.34 (0.09–1.31) 6 0.52 (0.19–1.40) 10 1.15 (0.46–2.88) 16 0.91 (0.43–1.93)
Missing 13 – 27 – 22 – 94 –
ptrend 0.18 0.40 0.54 0.91
Ever breastfeed
No 14 Reference 20 Reference 19 Reference 43 Reference
Yes 29 0.63 (0.33–1.22) 61 1.07 (0.64–1.81) 54 0.86 (0.51–1.47) 120 0.83 (0.58–1.19)
Missing 6 – 13 – 7 – 26 –
Duration of breastfeeding (months)
<4 11 Reference 20 Reference 20 Reference 31 Reference
4–10 8 0.72 (0.28–1.86) 20 1.01 (0.52–1.95) 18 0.86 (0.44–1.67) 42 1.17 (0.72–1.89) >10 10 0.78 (0.31–1.94) 20 1.24 (0.63–2.43) 16 0.90 (0.45–1.83) 47 1.25 (0.76–2.06) Missing 20 – 34 – 26 – 69 – ptrend 0.77 0.77 0.90 0.67 (Continues)
Cancer
Epidemiology
Our study found no association for GNC with BMI, WC or WHR, which is in line with previous meta-analyses.32,35 How-ever, we observed an inverse association between height and GNC in men only. Previous cohort studies that examined the association between height and GNC showed a nonsignificant inverse association.7,15,36The observed association could poten-tially be explained by the positive association between GNC and Helicobacter pylori infection, which may cause poor growth during childhood and has been associated with lower socioeco-nomic status,37,38which is in turn related to poor nutrition and leads to shorter adult height.39
With respect to reproductive factors, we found no associations between reproductive factors and ESCC or GC. However, an inverse association was observed between parity and EA. A meta-analysis by Wang et al.21 reported no association for EA with reproductive factors; however, this analysis did show an inverse association between breastfeeding and EA.21 A recent meta-analysis reported an inverse association between breastfeeding, parity and esophageal cancer.22
Few epidemiological studies have studied the association between age atfirst pregnancy and upper gastrointestinal can-cers. The Women’s Health Initiative Study reported no
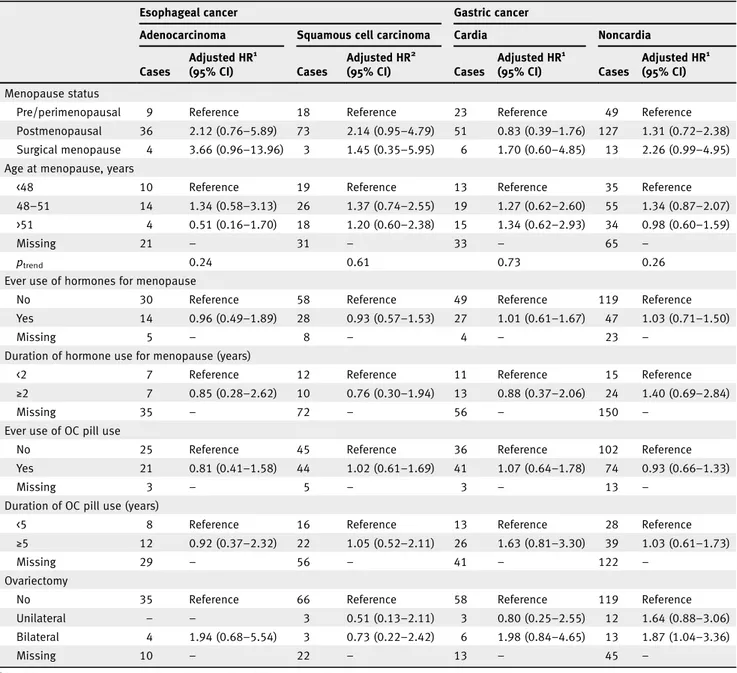
Table 5.Adjusted hazard ratios for esophageal and gastric cancer by subtype and subsite according to reproductive factors in women (n = 333,919) in the EPIC study (Continued)
Esophageal cancer Gastric cancer
Adenocarcinoma Squamous cell carcinoma Cardia Noncardia
Cases Adjusted HR1 (95% CI) Cases Adjusted HR2 (95% CI) Cases Adjusted HR1 (95% CI) Cases Adjusted HR1 (95% CI) Menopause status
Pre/perimenopausal 9 Reference 18 Reference 23 Reference 49 Reference
Postmenopausal 36 2.12 (0.76–5.89) 73 2.14 (0.95–4.79) 51 0.83 (0.39–1.76) 127 1.31 (0.72–2.38) Surgical menopause 4 3.66 (0.96–13.96) 3 1.45 (0.35–5.95) 6 1.70 (0.60–4.85) 13 2.26 (0.99–4.95) Age at menopause, years
<48 10 Reference 19 Reference 13 Reference 35 Reference
48–51 14 1.34 (0.58–3.13) 26 1.37 (0.74–2.55) 19 1.27 (0.62–2.60) 55 1.34 (0.87–2.07) >51 4 0.51 (0.16–1.70) 18 1.20 (0.60–2.38) 15 1.34 (0.62–2.93) 34 0.98 (0.60–1.59)
Missing 21 – 31 – 33 – 65 –
ptrend 0.24 0.61 0.73 0.26
Ever use of hormones for menopause
No 30 Reference 58 Reference 49 Reference 119 Reference
Yes 14 0.96 (0.49–1.89) 28 0.93 (0.57–1.53) 27 1.01 (0.61–1.67) 47 1.03 (0.71–1.50)
Missing 5 – 8 – 4 – 23 –
Duration of hormone use for menopause (years)
<2 7 Reference 12 Reference 11 Reference 15 Reference
≥2 7 0.85 (0.28–2.62) 10 0.76 (0.30–1.94) 13 0.88 (0.37–2.06) 24 1.40 (0.69–2.84)
Missing 35 – 72 – 56 – 150 –
Ever use of OC pill use
No 25 Reference 45 Reference 36 Reference 102 Reference
Yes 21 0.81 (0.41–1.58) 44 1.02 (0.61–1.69) 41 1.07 (0.64–1.78) 74 0.93 (0.66–1.33)
Missing 3 – 5 – 3 – 13 –
Duration of OC pill use (years)
<5 8 Reference 16 Reference 13 Reference 28 Reference
≥5 12 0.92 (0.37–2.32) 22 1.05 (0.52–2.11) 26 1.63 (0.81–3.30) 39 1.03 (0.61–1.73)
Missing 29 – 56 – 41 – 122 –
Ovariectomy
No 35 Reference 66 Reference 58 Reference 119 Reference
Unilateral – – 3 0.51 (0.13–2.11) 3 0.80 (0.25–2.55) 12 1.64 (0.88–3.06)
Bilateral 4 1.94 (0.68–5.54) 3 0.73 (0.22–2.42) 6 1.98 (0.84–4.65) 13 1.87 (1.04–3.36)
Missing 10 – 22 – 13 – 45 –
1Stratified on age, center and adjusted for smoking, BMI and education level.
2Stratified on age, center and adjusted for smoking, BMI, education level and alcohol intake.
Cancer
association between age atfirst pregnancy and ESCC but this was restricted to postmenopausal women.26 Furthermore, a population-based case–control study showed no association between age atfirst pregnancy and distal gastric cancer (odds ratio: 0.83, 95% CI: 0.44–1.57, for ≥25 years vs. nulliparous).40
No other study has reported an inverse association between age atfirst pregnancy and GNC.
Our updated analysis with longer follow-up confirms the previously reported positive association between bilateral ovariectomy and GNC.28 While the NIH-AARP Diet and Health Study reported a nonsignificant increased risk for EA and GC combined (n = 65 cases) in women who had under-gone ovariectomy,27 the Million Women’s Study Cohort reported no association with GC or GNC.25 As estrogen has been suggested as a protective factor for EA and gastric cancer,41,42ovariectomy and consequently decreased estrogen levels could explain the increased risk of GNC in these indi-viduals. Interestingly, studies in animal models have shown that ovariectomized female mice had an increased risk of gas-tric cancer.41
Our results suggest hormonal factors may play a role in the etiology of upper gastrointestinal cancers but the underly-ing biology is not defined. For gastric cancer, estrogens may protect against the development of this malignancy by acting on estrogen receptors (ERα and ERβ), which have been identi-fied in gastric cancer cells.43
Estrogen inhibits cell growth and increases apoptosis in gastric cancer cells44,45 and stimulates the expression of trefoil factor proteins, which play a role in mucosal protection and repair and their trefoil factor genes may act as tumor suppressors.41
Estrogen regulates body adiposity and fat distribution through ERs in the brain, and by interacting with leptin path-ways.46 Body fat distribution varies by sex as men tend to accrue more visceral fat, while women accrue more fat in the subcutaneous depot.47Estrogen promotes the accumulation of subcutaneous fat48and the decrease in estrogen levels in men-opausal women is associated with an increase in visceral fat.49 The accumulation of visceral fat is associated with an increased risk of esophageal and gastric cancer.35 Hence, estrogen regulation of leptin levels in women may play a pro-tective role directing accumulation of subcutaneous fat over visceral fat and consequently may explain the sex differences in the incidence of esophageal and gastric cancer.
However, any potential protective mechanisms associated with estrogen are in conflict with the fact that obesity, which has been linked with an increased risk of some upper gastro-intestinal cancers, is associated with higher estrogen levels. Nevertheless, the associations observed in our study were site-specific, in that abdominal obesity was positively associated with EA and GC (and not GNC) and bilateral ovariectomy were only positively associated with GNC. Furthermore, in addition to the effect on sex hormones, there are other biolog-ical effects of obesity, including insulin resistance, where levels of insulin and bioavailability of IGF are increased, which
promotes cell division and inhibits apoptosis.17 Obesity also increases concentrations of adipokines (e.g., leptin) and proinflammatory cytokines (e.g., tumor necrosis factor-α), which may contribute to cancer development.17,18
Strengths of our study include its prospective study design, large sample size and availability of standardized information on reproductive factors, and potential confounders. In addi-tion, anthropometric factors were mostly measured by trained professionals. Due to the prospective nature of the study, the likelihood of recall and selection bias is minimal. The large sample size allowed the analyses of esophageal and gastric cancer by subtype and subsite, and allowed analyses by gen-der; however, despite the size of the cohort and the long-term follow-up, the number of cases in some analyses was quite small. Our study has some limitations. We used a single assessment of anthropometric and reproductive factors col-lected at baseline as data during follow-up was not available; if anthropometric and reproductive factors changed during follow-up, this could lead to some misclassification and possi-bly bias the results toward null. Although we adjusted for sev-eral potential confounders, we lacked information on GERD and Helicobacter pylori infection, which have been associated with EA and GC, respectively; therefore, residual confounding cannot be excluded. We also lacked data on the reason for ovariectomy in the women who underwent this procedure. In addition, EPIC cohort participants are of European descent, which limits the generalizability of our findings to other eth-nicities. Finally, as we analyzed anthropometric and reproduc-tive factors in relation to both esophageal and gastric cancer by subtype and subsite, some of our associations may have arisen by chance as a result of multiple comparisons.
In conclusion, the results of our study suggest that abdomi-nal obesity may influence risk for EA and GC. Furthermore, some reproductive factors in women may influence risk for EA and GNC, specifically. Together, these findings may sup-port a role for hormonal pathways in upper gastrointestinal cancer development; however, in order to fully investigate these pathways, future studies should investigate endogenous hormone measurements in relation to these cancers. Consid-ering these results, maintaining a healthy weight should be suggested as an evidence-based lifestyle recommendation for EA and GC prevention.
Acknowledgements
This research was funded by the Stand Up to Cancer campaign for Cancer Research UK. The coordination of EPIC is financially supported by the European Commission (DG-SANCO) and the International Agency for Research on Cancer. The national cohorts are supported by Danish Cancer Society (Denmark); Ligue Contre le Cancer, Institut Gustave Roussy, Mutuelle Générale de l’Education Nationale, Institut National de la Santé et de la Recherche Médicale (INSERM, France); German Cancer Aid, German Cancer Research Centre (DKFZ), Federal Ministry of Education and Research (BMBF), Deutsche Krebshilfe, Deutsches Krebsforschungszentrum and Federal Ministry of Education and Research (Germany); the Hellenic Health Foundation (Greece); Associazione Italiana per la Ricerca sul
Cancer
Cancro-AIRC-Italy and National Research Council (Italy); Dutch Ministry of Public Health, Welfare and Sports (VWS), Netherlands Cancer Registry (NKR), LK Research Funds, Dutch Prevention Funds, Dutch ZON (Zorg Onderzoek Nederland), World Cancer Research Fund (WCRF), Statistics Netherlands (The Netherlands); National Institute for Public Health and the Environment (Bilthoven, The Netherlands) for their contribution to data collection; Health Research Fund (FIS), PI13/00061 to Granada, PI13/01162 to EPIC-Murcia, Regional Governments of Andalucía, Asturias, Basque Country, Murcia (no. 6236) and the Catalan Institute of Oncology (Spain); Swedish Cancer Society, Swedish Research Council and County Councils of Skåne and Västerbotten (Sweden); Cancer Research UK (14136 to KTK, NJW; C570/A16491 to RCT and C8221/A19170 to TK [EPIC-Oxford]), Medical Research Council (1000143 to KTK, NJW, MR/M012190/1 to TK [EPIC-Oxford, United Kingdom]).
Author contributions
Study concept, study design and data management: AJC. Statistical analysis: HS. Article drafting—first version, inter-pretation of results and critical article review: AJC and HS. Data contribution andfinal version of the article: all EPIC co-authors.
Data sharing
For information on how to submit an application for gaining access to EPIC data and/or biospecimens, please follow the instructions at http://epic.iarc.fr/access/index.php.
References
1. Bray F, Ferlay J, Soerjomataram I, et al. Global cancer statistics 2018: GLOBOCAN estimates of incidence and mortality worldwide for 36 cancers in 185 countries. CA Cancer J Clin 2018;68: 394–424.
2. World Cancer Research Fund and American Institue for Cancer Research. Diet, nutrition, phys-ical activity and oesophageal cancer. Washington, DC: WCRF/AICR, 2016.
3. Karimi P, Islami F, Anandasabapathy S, et al. Gastric cancer: descriptive epidemiology, risk fac-tors, screening, and prevention. Cancer Epidemiol Biomarkers Prev 2014;23:700–13.
4. Steffen A, Schulze MB, Pischon T, et al. Anthro-pometry and esophageal cancer risk in the European prospective investigation into cancer and nutrition. Cancer Epidemiol Biomarkers Prev 2009;18:2079–89.
5. Steffen A, Huerta JM, Weiderpass E, et al. General and abdominal obesity and risk of esophageal and gastric adenocarcinoma in the European prospec-tive investigation into cancer and nutrition. Int J Cancer 2015;137:646–57.
6. Abnet CC, Freedman ND, Hollenbeck AR, et al. A prospective study of BMI and risk of oesophageal and gastric adenocarcinoma. Eur J Cancer (Oxford, England: 1990) 2008;44:465–71. 7. Merry AH, Schouten LJ, Goldbohm RA, et al.
Body mass index, height and risk of adenocarci-noma of the oesophagus and gastric cardia: a pro-spective cohort study. Gut 2007;56:1503–11. 8. MacInnis RJ, English DR, Hopper JL, et al. Body
size and composition and the risk of gastric and oesophageal adenocarcinoma. Int J Cancer 2006; 118:2628–31.
9. Lindblad M, Rodriguez LA, Lagergren J. Body mass, tobacco and alcohol and risk of esophageal, gastric cardia, and gastric non-cardia adenocarci-noma among men and women in a nested case– control study. Cancer Causes Control 2005;16: 285–94.
10. Ryan AM, Rowley SP, Fitzgerald AP, et al. Adeno-carcinoma of the oesophagus and gastric cardia: male preponderance in association with obesity. Eur J Cancer (Oxford, England: 1990) 2006;42:1151–8. 11. Lauby-Secretan B, Scoccianti C, Loomis D, et al.
Body fatness and cancer—viewpoint of the IARC working group. N Engl J Med 2016;375:794–8. 12. Turati F, Tramacere I, La Vecchia C, et al. A
meta-analysis of body mass index and esophageal and gastric cardia adenocarcinoma. Ann Oncol 2013;24:609–17.
13. World Cancer Research Fund and American Institue for Cancer Research. Diet, Nutrition, Physical activity and cancer: a Global Perspective. Washington, DC: WCRF/AICR, 2018. 14. Smith M, Zhou M, Whitlock G, et al. Esophageal
cancer and body mass index: results from a pro-spective study of 220,000 men in China and a meta-analysis of published studies. Int J Cancer 2008;122:1604–10.
15. O’Doherty MG, Freedman ND, Hollenbeck AR, et al. A prospective cohort study of obesity and risk of oesophageal and gastric adenocarcinoma in the NIH-AARP diet and health study. Gut 2012;61:1261–8. 16. Lagergren J. Influence of obesity on the risk of esophageal disorders. Nat Rev Gastroenterol Hepatol 2011;8:340–7.
17. Calle EE, Kaaks R. Overweight, obesity and can-cer: epidemiological evidence and proposed mech-anisms. Nat Rev Cancer 2004;4:579–91. 18. Zheng J, Zhao M, Li J, et al. Obesity-associated
digestive cancers: a review of mechanisms and interventions. Tumour Biol 2017;39: 1010428317695020.
19. Xie SH, Lagergren J. The male predominance in esophageal adenocarcinoma. Clin Gastroenterol Hepatol 2016;14:338–47. e1.
20. Sipponen P, Correa P. Delayed rise in incidence of gastric cancer in females results in unique sex ratio (M/F) pattern: etiologic hypothesis. Gastric Cancer 2002;5:213–9.
21. Wang BJ, Zhang B, Yan SS, et al. Hormonal and reproductive factors and risk of esophageal cancer in women: a meta-analysis. Dis Esophagus 2016;29: 448–54.
22. Zhu Y, Yue D, Yuan B, et al. Reproductive factors are associated with oesophageal cancer risk: results from a meta-analysis of observational stud-ies. Eur J Cancer Prev 2017;26:1–9.
23. Camargo MC, Goto Y, Zabaleta J, et al. Sex hor-mones, hormonal interventions, and gastric can-cer risk: a meta-analysis. Cancan-cer Epidemiol Biomarkers Prev 2012;21:20–38.
24. Wang Z, Butler LM, Wu AH, et al. Reproductive factors, hormone use and gastric cancer risk: the Singapore Chinese health study. Int J Cancer 2016;138:2837–45.
25. Green J, Roddam A, Pirie K, et al. Reproductive factors and risk of oesophageal and gastric cancer in the million women study cohort. Br J Cancer 2012;106:210–6.
26. Bodelon C, Anderson GL, Rossing MA, et al. Hor-monal factors and risks of esophageal squamous cell
carcinoma and adenocarcinoma in postmenopausal women. Cancer Prev Res (Phila) 2011;4:840–50. 27. Freedman ND, Lacey JV Jr, Hollenbeck AR, et al.
The association of menstrual and reproductive factors with upper gastrointestinal tract cancers in the NIH-AARP cohort. Cancer 2010;116:1572–81. 28. Duell EJ, Travier N, Lujan-Barroso L, et al.
Men-strual and reproductive factors, exogenous hor-mone use, and gastric cancer risk in a cohort of women from the European prospective investiga-tion into cancer and nutriinvestiga-tion. Am J Epidemiol 2010;172:1384–93.
29. Bahmanyar S, Lambe M, Zendehdel K, et al. Parity and risk of stomach cancer by sub-site: a national Swedish study. Br J Cancer 2008;98: 1295–300.
30. Riboli E, Kaaks R. The EPIC project: rationale and study design. European prospective investiga-tion into cancer and nutriinvestiga-tion. Int J Epidemiol 1997;26(Suppl 1):S6–14.
31. Riboli E, Hunt KJ, Slimani N, et al. European pro-spective investigation into cancer and nutrition (EPIC): study populations and data collection. Public Health Nutr 2002;5:1113–24. 32. Chen Y, Liu L, Wang X, et al. Body mass index
and risk of gastric cancer: a meta-analysis of a population with more than ten million from 24 prospective studies. Cancer Epidemiol Bio-markers Prev 2013;22:1395–408.
33. Corley DA, Kubo A, Zhao W. Abdominal obesity and the risk of esophageal and gastric cardia carci-nomas. Cancer Epidemiol Biomarkers Prev 2008;17: 352–8.
34. Lin Y, Ness-Jensen E, Hveem K, et al. Metabolic syndrome and esophageal and gastric cancer. Cancer Causes Control 2015;26:1825–34. 35. Du X, Hidayat K, Shi BM. Abdominal obesity and
gastroesophageal cancer risk: systematic review and meta-analysis of prospective studies. Biosci Rep 2017;37:BSR20160474.
36. Camargo MC, Freedman ND, Hollenbeck AR, et al. Height, weight, and body mass index associ-ations with gastric cancer subsites. Gastric Cancer 2014;17:463–8.
37. Goodman KJ, Correa P, Mera R, et al. Effect of Helicobacter pylori infection on growth velocity of school-age Andean children. Epidemiology 2011; 22:118–26.
38. Moayyedi P, Axon AT, Feltbower R, et al. Rela-tion of adult lifestyle and socioeconomic factors to the prevalence of Helicobacter pylori infection. Int J Epidemiol 2002;31:624–31.
Cancer
39. Dore MP, Pes GM, Sferlazzo G, et al. Role of Helicobacter pylori infection in body height of adult dyspeptic patients. Helicobacter 2016;21: 575–80.
40. Frise S, Kreiger N, Gallinger S, et al. Menstrual and reproductive risk factors and risk for gastric adenocarcinoma in women:findings from the Canadian national enhanced cancer surveillance system. Ann Epidemiol 2006;16:908–16. 41. Chandanos E, Lagergren J. Oestrogen and the
enigmatic male predominance of gastric cancer. Eur J Cancer 2008;44:2397–403.
42. Yang H, Sukocheva OA, Hussey DJ, et al. Estrogen, male dominance and esophageal
adenocarcinoma: is there a link? World J Gastroenterol 2012;18:393–400.
43. Takano N, Iizuka N, Hazama S, et al. Expression of estrogen receptor-alpha and -beta mRNAs in human gastric cancer. Cancer Lett 2002;176: 129–35.
44. Pricci M, Linsalata M, Russo F, et al. Effects of 17beta-estradiol administration on apoptosis and polyamine content in AGS cell line. Anticancer Res 2001;21:3215–20.
45. Zhou J, Teng R, Xu C, et al. Overexpression of ERalpha inhibits proliferation and invasion of MKN28 gastric cancer cells by suppressing beta-catenin. Oncol Rep 2013;30:1622–30.
46. Clegg DJ, Brown LM, Woods SC, et al. Gonadal hormones determine sensitivity to central leptin and insulin. Diabetes 2006;55:978–87. 47. Palmer BF, Clegg DJ. The sexual dimorphism of
obesity. Mol Cell Endocrinol 2015;402:113–9. 48. Krotkiewski M, Bjorntorp P, Sjostrom L, et al.
Impact of obesity on metabolism in men and women. Importance of regional adipose tissue dis-tribution. J Clin Invest 1983;72:1150–62. 49. Toth MJ, Poehlman ET, Matthews DE, et al.
Effects of estradiol and progesterone on body composition, protein synthesis, and lipoprotein lipase in rats. Am J Physiol Endocrinol Metab 2001;280:E496–501.