International incidence of childhood cancer, 2001–10:
a population-based registry study
Eva Steliarova-Foucher, Murielle Colombet, Lynn A G Ries, Florencia Moreno, Anastasia Dolya, Freddie Bray, Peter Hesseling, Hee Young Shin, Charles A Stiller, and the IICC-3 contributors*
Summary
Background Cancer is a major cause of death in children worldwide, and the recorded incidence tends to increase with time. Internationally comparable data on childhood cancer incidence in the past two decades are scarce. This study aimed to provide internationally comparable local data on the incidence of childhood cancer to promote research of causes and implementation of childhood cancer control.
Methods This population-based registry study, devised by the International Agency for Research on Cancer in
collaboration with the International Association of Cancer Registries, collected data on all malignancies and non-malignant neoplasms of the CNS diagnosed before age 20 years in populations covered by high-quality cancer registries with complete data for 2001–10. Incidence rates per million person-years for the 0–14 years and 0–19 years age groups were age-adjusted using the world standard population to provide age-standardised incidence rates (WSRs), using the age-specific incidence rates (ASR) for individual age groups (0–4 years, 5–9 years, 10–14 years, and 15–19 years). All rates were reported for 19 geographical areas or ethnicities by sex, age group, and cancer type. The regional WSRs for children aged 0–14 years were compared with comparable data obtained in the 1980s.
Findings Of 532 invited cancer registries, 153 registries from 62 countries, departments, and territories met quality standards, and contributed data for the entire decade of 2001–10. 385 509 incident cases in children aged 0–19 years occurring in 2·64 billion person-years were included. The overall WSR was 140·6 per million person-years in children aged 0–14 years (based on 284 649 cases), and the most common cancers were leukaemia (WSR 46·4), followed by CNS tumours (WSR 28·2), and lymphomas (WSR 15·2). In children aged 15–19 years (based on 100 860 cases), the ASR was 185·3 per million person-years, the most common being lymphomas (ASR 41·8) and the group of epithelial tumours and melanoma (ASR 39·5). Incidence varied considerably between and within the described regions, and by cancer type, sex, age, and racial and ethnic group. Since the 1980s, the global WSR of registered cancers in children aged 0–14 years has increased from 124·0 (95% CI 123·3–124·7) to 140·6 (140·1–141·1) per million person-years. Interpretation This unique global source of childhood cancer incidence will be used for aetiological research and to inform public health policy, potentially contributing towards attaining several targets of the Sustainable Development Goals. The observed geographical, racial and ethnic, age, sex, and temporal variations require constant monitoring and research.
Funding International Agency for Research on Cancer and the Union for International Cancer Control.
Copyright © 2017 World Health Organization; licensee Elsevier. This is an Open Access article published under the CC BY-NC-ND 3.0 IGO license which permits users to download and share the article for non-commercial purposes, so long as the article is reproduced in the whole without changes, and provided the original source is properly cited. This article shall not be used or reproduced in association with the promotion of commercial products, services or any entity. There should be no suggestion that WHO endorses any specific organisation, products, or services. The use of the WHO logo is not permitted. This notice should be preserved along with the article’s original URL.
Introduction
Cancers rarely occur before age 20 years, and when they do, they raise a range of medical, psychological, ethical, and societal concerns. These distinct types of neoplasms require specific treatment paths. Furthermore, the extent of the cancer burden in this young population is unknown in many low-income and middle-income countries (LMICs), where data on cancer incidence are not collected. Even in the presence of population-based cancer registries, collection of information about childhood cancers is often neglected because they
represent a small proportion of all cancers, additional data sources might be required, and the resulting statistics must be subjected to meticulous quality control because they are more sensitive to imprecision or missing information.
Since the publication of the International Incidence of Childhood Cancer, volume 1 (IICC-1) in 19881 and IICC-2
in 1998,2 no internationally comparable data on incidence
patterns of childhood cancer have been published. To address this problem, the International Agency for Research on Cancer (IARC), in collaboration with the
Lancet Oncol 2017; 18: 719–31
Published Online
April 11, 2017 http://dx.doi.org/10.1016/ S1470-2045(17)30186-9
This online publication has been corrected. The corrected version first appeared at thelancet.com/oncology on June 2, 2017
*Contributors listed in the appendix
Section of Cancer Surveillance, International Agency for Research on Cancer, Lyon, France
(E Steliarova-Foucher PhD, M Colombet MSc, A Dolya MSc, F Bray PhD); Division of Cancer
Control and Population Sciences, National Cancer Institute, Bethesda, MD, USA
(L A G Ries MS); Paediatric
Cancer Registry, National Cancer Institute, Buenos Aires, Argentina (F Moreno PhD); Department of Paediatrics and Child Health, Stellenbosch University, Tygerberg Children’s Hospital, Tygerberg, South Africa (P Hesseling PhD); Seoul National University Children’s Hospital, Institute of Cancer Research, Seoul, South Korea (H Y Shin PhD); and National Cancer Registration and Analysis Service, Public Health England, Oxford, UK
(C A Stiller MSc) Correspondence to: Dr Eva Steliarova-Foucher, Section of Cancer Surveillance, International Agency for Research on Cancer, World Health Organization, Lyon 69372, CEDEX 08, France
See Online for appendix
For more on the IARC see http://www.iarc.fr/
International Association of Cancer Registries (IACR), has coordinated a study to assess the incidence of childhood cancer worldwide, the complete results of which will be published in IICC-3. The target age range for IICC-3 is 0–19 years, compared with 0–14 years in IICC-1 and IICC-2. Inclusion of the 15–19 years age group was motivated by the shortage of internationally comparable data in this transition age between childhood
and adulthood. An age range of 0–19 years was also
chosen in previous US and European studies of
childhood cancer incidence and survival.3,4
Here we provide an overview of the findings of the IICC-3 study, based on a selection of quality-assured datasets from around the world encompassing information for the complete decade of 2001–10. The objective of this study was to counteract the difficulties in collecting childhood cancer data from relevant data sources and provide globally comparable estimates of cancer occurrence in children to aid further research and adapt policy measures.
Methods
Study design and data sources
In this epidemiological, population-based registry study, we invited all population-based cancer registries that we identified among the membership of the IACR and from
published literature in MEDLINE or other published
sources, such as annual reports, in any language. The search terms used for the literature search were “population”, “childhood cancer”, “incidence”, and “registry”. Of the invited registries, we selected only those that had submitted their data and met standard data quality criteria. We included only registries covering
the entire decade of 2001–10, which eliminated some high-quality registries that covered non-overlapping time periods. Analyses for the 0–14 years age group were based on a larger database (the paediatric dataset) than those for the 0–19 years age group (general dataset), because the paediatric dataset included data from the paediatric cancer registries not collecting data in children older than 15 years and these registries tended to have a wider coverage than the cancer registries used in the general dataset (appendix pp 2–4).
All malignancies and non-malignant tumours of the CNS diagnosed before age 20 years (before age 15 years in most of the paediatric cancer registries) in the covered populations in 2001–10 were eligible for inclusion. In the USA, non-malignant tumours were only registered from 2004 onwards, so they were excluded. The submission from each registry contained cancer and population data, information about registration coverage, practices, and data sources, and a short narrative describing registry operations. Cancer data included individual records of cases with codes for the following: sex; age; date of birth; date of incidence; and tumour sequence (ie, the numerical order of occurrence of the neoplasm), site, morphology, behaviour, laterality, and most valid basis of diagnosis. The 3rd edition of the International Classification of Diseases for Oncology5 was required for coding of the tumour site, morphology, behaviour, multiple primary tumours, and basis of diagnosis. Non-conforming coding systems were converted and tumours were classified centrally according to the 3rd edition of the International Classification of
Childhood Cancer (ICCC-3).6 We requested each
contributing cancer registry to provide total population
Research in context Evidence before this study
The worldwide incidence of cancer in children aged 0–14 years was reported in 1988 and 1998 in two volumes of the
International Incidence of Childhood Cancer (IICC), which described
incidence patterns in the 1970s and 1980s, respectively. We searched MEDLINE and participating registries for studies on the incidence of childhood cancer worldwide, with the search terms “childhood cancer”, “registry”, “incidence”, and “population”, in February, 2016, without language or publication date restrictions. We found that no globally comparable data on cancer types affecting children have been published since IICC-2, and no comparison of incidence patterns in children aged 15–19 years has been attempted on a global scale.
Added value of this study
This study provides an overview of the incidence of cancer in 2001–10 for children aged 0–19 years, based on data collected in 153 population-based cancer registries in
62 countries, departments, and territories on five continents. In addition to the sex, age, and tumour-specific incidence rates for
19 world regions or populations for 2001–10, we report an increase in the incidence of neoplasms since the 1980s in children aged 0–14 years. This study updates information on cancer incidence in children published almost 20 years ago and adds the first global overview of cancer incidence in young people aged 15–19 years. It comprehensively summarises the most recent and globally comparable data and presents information per sex, age group, geographical region, and tumour type.
Implications of all the available evidence
The wealth of information provided by this study constitutes a solid baseline to assess needs and define priorities in the area of paediatric oncology, supporting Sustainable Development Goal 3 to ensure healthy lives and promote wellbeing for all at all ages. The identified variations in cancer incidence according to region, sex, age group, and tumour type will provide a springboard for specific aetiological research. The shortage of high-quality local information should stimulate formation of new and more accurate data sources.
For more on the IICC-3 see http://iicc.iarc.fr/ For more on the IACR see http://www.iacr.com.fr/
counts for each ethnic or racial group, calendar year, sex, and year of age in the registration area of their registry.
Procedures
All submitted datasets were processed and assessed individually in a rigorous peer-review process. The assessment criteria included a range of indicators, including the following: minimum number of cases; proportion of cases confirmed from cancer tissue examination (microscopic verification); proportion of cases registered from death certificate only; proportion of cases with morphology not otherwise specified (ie, cases in the unspecified subgroups of ICCC-3 or those coded by unspecified morphology codes such as 8000, 8800, 9800); proportion of cases with an unlikely combination of site and morphology, or an unlikely age and tumour type; proportion of rare entities (ie, neoplasms that occurred with a frequency of <0·05% in large datasets); proportion of dates of birth and incidence that were incomplete; proportion of ages that were imprecise; overall incidence rates; proportion of cases and incidence by sex, age group, and tumour type; the stability of rates over time; proportion of multiple primary diagnoses; and consistency of population data. All questionable records and raised issues were fed back to the contributing registries with a request for correction or a response. This iterative process resulted in a marked improvement of the overall quality of the data included in the analyses. The improvements included completion of missing information, additional years of data,
inclusion of information from missed data sources,
correction of coding errors, improvements in calculation of age, inclusion of non-malignant CNS tumours, replacement of population data, and explanation of the questioned patterns.
Statistical analysis
We calculated age-specific incidence rates (ASR) for four 5-year age groups (0–4 years, 5–9 years, 10–14 years, and 15–19 years) as the quotient of the number of cases and the number of person-years in the respective categories of sex, geographical area, and racial or ethnic group for the applicable time period, expressed per million person-years. We defined person-years as the sum of the population counts in a specific geographical area surveyed by a registry in each year from 2001 to 2010, categorised by sex and age and, if relevant, race or ethnicity. In the absence of all required details, we estimated the covered population counts by linear interpolation (six registries) or extrapolation (three registries) from the data provided by the registries, based on an assumption of regular population growth, before calculating rates. The purpose of this study was to make comparisons among regions and time periods, so all reported incidence rates for the 0–14 years and 0–19 years age groups were adjusted via direct standardisation. We calculated
age-standardised rates (WSRs) as the weighted average of the three age-specific rates (to calculate rates for 0–14 years) or four age-specific rates (for 0–19 years), using the
weights of the world standard population7 (appendix p 5).
We calculated incidence sex ratios by dividing the incidence in male individuals with that in female individuals.
The results are presented for 19 geographical regions or populations and a combined total; all the defined
regions are either UN-defined regions8 or an aggregate
of UN-defined regions, with the exception of North America, for which we present data separately for Canada and the USA, and have split data for the USA into five racial or ethnic groups. Within the region of south Asia, eligible data were only available from India. The described region definition was also driven by the data availability and the sizes of the resulting respective regional datasets. We calculated the proportion of the covered population of the world and each region by dividing the included years by the total person-years in 2001–10 by age group, as estimated by the UN
in 2015.9
To compare the incidence rates derived from the paediatric dataset for 2001–10 with those published in
IICC-2,2 we assigned IICC-2 registry data to the same
geographical regions as used in this IICC-3 study. We calculated the WSRs and their 95% CIs for children aged 0–14 years. Although the target period of IICC-2 was the 1980s, the time periods of the contributing registries differed both in length and starting years, because they either followed on from the IICC-1 period or they could not provide other years of data.
Statistical analyses were done using Stata/IC (version 12.1).
Role of the funding source
The funder of the study had no role in study design, data collection, data analysis, data interpretation, or writing of
the report. MC, AD, and ES-F had full access to all the
raw data used in the study. The corresponding author had final responsibility for the decision to submit for publication.
Results
Of the 532 invited cancer registries, 420 submitted their data and 309 met standard data quality criteria. Of those, 153 quality-assured registries from 62 countries, departments, and territories contributed data for the entire decade (appendix pp 3–4). Of the 153 included registries, 72 were initially unacceptable, but improved through the iterative quality assurance procedure. Approximately 11·4% of the world population aged 0–14 years (contributing 18 376 710 144 person-years) was covered by the registries included in our study, ranging from 1·7% in south Asia (India) to 99·4% in North America (table 1). The coverage was slightly less, at 8·9%, for young people aged 15–19 years (contributing
6 105 345 342 person-years), with the lowest being 0·8%
in sub-Saharan Africa. Overall, 385 509registered cases
occurring in 2·64 billion person-years contributed to the analyses (tables 1, 2). Registration of non-malignant CNS tumours differed by registry, and was higher in the paediatric dataset than in the general dataset (table 1, 2). The overall WSRs were 140·6 per million person-years in children aged 0–14 years and 155·8 per million
person-years in those aged 0–19 years (table 2). The ASR in young people aged 15–19 years was 185·3 per million person-years.
Incidence rates were slightly higher in boys than in girls (incidence sex ratio was 1·17 in the 0–14 years age group and 1·14 in the 0–19 years age-group) and varied with age, region, and diagnostic group (table 2; appendix p 8). Across all regions, incidence was higher in boys than in girls (incidence sex ratio ranged from 1·1 to 1·4 in the 0–19 years age group; appendix p 8), except for the 15–19 years age group of Native Americans in the USA (incidence sex ratio of 0·9) and in east Asia (1·0), where girls had a higher incidence (ratios rounded to one decimal place; appendix p 8). The highest incidence sex ratio was observed in the age group of 5–9 years in south Asia (India; 1·7; appendix p 8). Sex-specific incidence varied by diagnostic group, with renal tumours and epithelial tumours more common in girls, with variations by age group (appendix p 8). Germ cell and gonadal tumours were also more common in girls than in boys in the 0–14 years age group (appendix p 8).
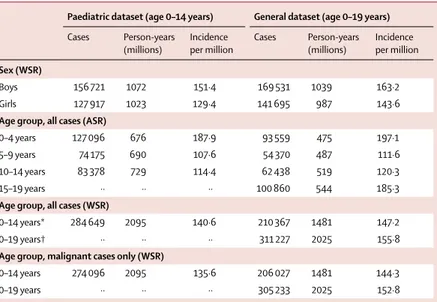
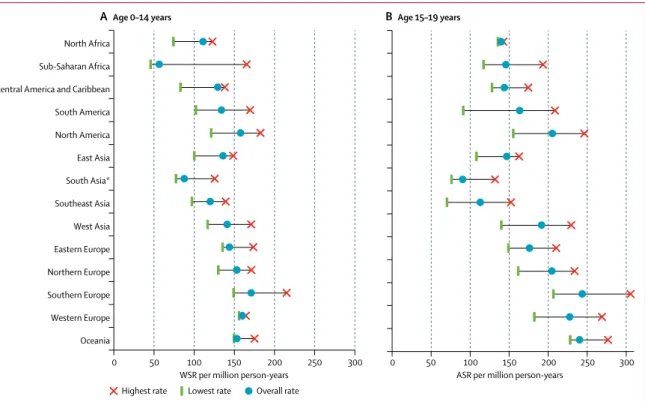
ASRs were higher in children aged 0–4 years and 15–19 years than in those aged 5–9 years and 10–14 years (table 2). ASRs also differed between regions, especially for the age groups with high ASRs (appendix pp 6, 9). In the 0–14 years group, overall WSRs varied from less
than 100per million person-years in sub-Saharan Africa,
for Native American children in the USA, and in south Asia (India), to more than 150 per million person-years in some subpopulations of North America and Europe, and in Oceania (figure 1A; appendix p 6). In young people aged 15–19 years, the lowest ASR was observed in
Population covered (%) Person-years (1000s) Cases Microscopically verified (%) Morphology NOS (%) Non-malignant (%)
Age
0–14 years Age 15–19 years Age 0–14 years Age 15–19 years Age 0–14 years Age 15–19 years Age 0–14 years Age 15–19 years Age 0–14 years Age 15–19 years Age 0–14 years Age 15–19 years
North Africa 3·0% 3·4% 18 606 6980 2011 975 90·6% 94·9% 13·4% 10·4% 0·5% 0·4% Sub-Saharan Africa 5·1% 0·8% 167 696 6780 9249 988 86·3% 72·4% 8·3% 27·1% 0·8% 0% Central America and Caribbean 8·1% 8·5% 49 803 16 030 6223 2304 92·9% 90·1% 9·6% 12·4% 0·9% 1·2% South America 13·2% 3·9% 140 549 13 709 18 251 2241 95·2% 94·2% 7·0% 10·9% 2·4% 0·6% North America 99·4% 99·9% 661 232 235 385 100 475 48 354 92·7% 96·4% 2·5% 3·1% 0·1% 0·2% East Asia 4·4% 4·0% 133 678 53 486 17 009 7857 91·3% 93·6% 10·0% 10·4% 1·4% 1·3% South Asia* 1·7% 2·2% 65 713 25 901 5662 2339 95·5% 93·3% 12·8% 16·2% 0·0% 0·0% Southeast Asia 4·6% 5·2% 76 729 28 944 8984 3267 87·5% 84·9% 20·9% 23·7% 0·4% 0·2% West Asia 11·4% 11·2% 78 603 23 316 10 896 4463 96·0% 96·7% 4·6% 5·8% 2·1% 3·0% Eastern Europe 27·9% 21·5% 129 536 48 077 17 720 8456 94·3% 93·7% 6·9% 8·8% 4·4% 1·6% Northern Europe 86·8% 31·7% 151 598 20 081 22 437 4109 92·0% 94·9% 3·8% 5·8% 11·1% 9·1% Southern Europe 37·7% 25·9% 85 322 21 679 14 270 5281 93·0% 95·9% 4·4% 5·6% 7·7% 5·3% Western Europe 94·0% 23·9% 285 149 26 482 43 987 6027 94·9% 96·7% 1·6% 2·6% 10·8% 7·4% Oceania 60·4% 66·2% 50 585 17 492 7475 4199 94·5% 97·6% 3·1% 2·5% 3·0% 0·6% Total† 11·4% 8·9% 2094 800 544 340 284 649 100 860 93·0% 95·1% 4·9% 6·1% 3·7% 1·6%
Data for the 0–14 years age group is based on the paediatric dataset, and data for the 15–19 years age group is based on the general dataset. NOS=not otherwise specified. *Comprising data from India only. †Coverage of the world population within the indicated age group.
Table 1: Coverage of the world population aged 0–19 years, person-years, numbers of cancer cases, and quality indicators of data included in the analyses, overall and by region, 2001–10
Paediatric dataset (age 0–14 years) General dataset (age 0–19 years)
Cases Person-years
(millions) Incidence per million Cases Person-years (millions) Incidence per million
Sex (WSR)
Boys 156 721 1072 151·4 169 531 1039 163·2
Girls 127 917 1023 129·4 141 695 987 143·6
Age group, all cases (ASR)
0–4 years 127 096 676 187·9 93 559 475 197·1 5–9 years 74 175 690 107·6 54 370 487 111·6 10–14 years 83 378 729 114·4 62 438 519 120·3
15–19 years ·· ·· ·· 100 860 544 185·3
Age group, all cases (WSR)
0–14 years* 284 649 2095 140·6 210 367 1481 147·2
0–19 years† ·· ·· ·· 311 227 2025 155·8
Age group, malignant cases only (WSR)
0–14 years 274 096 2095 135·6 206 027 1481 144·3
0–19 years ·· ·· ·· 305 233 2025 152·8
ASR=age-specific rate. WSR=age-standardised rate (world standard). *Includes cases with unknown sex (11 in the paediatric dataset and one in the general dataset). †Includes one case with unknown sex.
Table 2: Numbers of cancer cases, person-years, and overall cancer incidence, by sex, age group, and malignant status
south Asia (India), whereas the highest ASRs were seen in some predominantly white populations of North America, Europe, and Oceania (figure 1B; appendix p 6).
The range of tumour types varied markedly with age group (figure 2). In children aged 0–4 years, leukaemia represented 36·1% (45 849 of 127 096) of all cases; however, the proportion of leukaemia cases was 15·4% (15 520 of 100 860) in young people aged 15–19 years. Conversely, lymphomas represented 5·3% (6766 of 127 096) of cases in children aged 0–4 years, and 22·5% (22 740 of 100 860) of cases in those aged 15–19 years. CNS tumours were the second most frequent tumour type after leukaemia in children aged 0–4 years (21 804 [17·2%] of 127 096), 5–9 years (19 471 [26·3%] of 74 175), and 10–14 years (16 680 [20·0%] of 83 378; figure 2). Epithelial tumours and melanoma represented 0·9% of all cases in children aged 0–4 years (1197 of 127 096), but were the second most common tumour group in young people aged 15–19 years (21 480 [21·3%] of 100 860).
The most common sympathetic nervous system
tumour across all age groupswas neuroblastoma. It was
most frequent in children aged 0–4 years (15 888 [12·5%] of 127 096) and very rare in those aged 15–19 years (218 [0·2%] of 100 860; figure 2). Of note is the relatively high sympathetic nervous system tumour WSR of 10·2 per million person-years in black children in the USA, which contrasts with the WSR of 2·7 per million person-years in the mostly black population of Sub-Saharan Africa (table 3). Renal tumours were common in
children aged 0–4 years (11 297 [8·9%] of 127 096), and their relative frequency decreased in older age groups, to 0·7% (756 of 100 860) in young people aged 15–19 years
(figure 2). Bone tumours constituted 4·7% (13 320
Figure 1: Variation in the overall incidence of childhood cancer by geographical region, 2001–10
Data are for children aged 0–14 years, from the paediatric dataset (A), and 15–19 years, from the general dataset (B). We only included registries with more than 100 cases when assessing the lowest and highest rates. ASR=age-specific rate. WSR=age-standardised rate (world standard population). *Comprising data from India only.
0 50 100 150 200 250 300
North Africa Sub-Saharan Africa Central America and Caribbean South America North America East Asia South Asia* Southeast Asia West Asia Eastern Europe Northern Europe Southern Europe Western Europe Oceania
WSR per million person-years
0 50 100 150 200 250 300
ASR per million person-years
A Age 0–14 years B Age 15–19 years
Highest rate Lowest rate Overall rate
Figure 2: Proportional distribution of cancer type by age group, 2001–10, all regions combined
Tumours classified by International Classification of Childhood Cancer, volume 3.6 Statistics for children younger than
15 years are based on the paediatric dataset and the statistics for those aged 15–19 years are based on the general dataset. 0% 20% 40% 60% 80% 100% 0–4 5–9 10–14 15–19
Age group (years)
Leukaemia Lymphoma CNS tumours Sympathetic nervous system tumours Retinoblastoma Renal tumours Hepatic tumours Bone tumours Soft tissue sarcomas Germ cell and gonadal tumours
Epithelial tumours and melanoma Other and unspecified
Leukaemia Lymphomas CNS tumours Sympathetic nerv ous system Retino -blastoma Renal tumours Hepatic tumours Bone tumours
Soft tissue sarcomas Germ cell and gonadal tumours Epithelial tumours and melanoma Other and unspecified
n WSR n WSR n WSR n WSR n WSR n WSR n WSR n WSR n WSR n WSR n WSR n WSR North Africa 506 28 ·2 473 25 ·6 304 16 ·5 142 8· 8 33 2· 2 104 6· 4 16 1· 0 111 5· 3 132 7· 2 40 2· 2 86 4· 1 64 3· 5 Sub-Saharan Africa 2060 12 ·5 1664 9· 8 1041 6· 3 411 2· 7 563 3· 7 1031 6· 7 165 1· 0 385 2· 1 1262 7· 6 265 1· 6 230 1· 3 172 1· 0
Central America and Caribbean
2145 45 ·5 920 18 ·0 1023 21 ·1 277 6· 6 155 3· 8 292 6· 7 88 2· 0 294 5· 2 337 6· 9 239 4· 7 283 5· 1 170 3· 5 South America 6734 49 ·8 2319 16 ·2 3272 23 ·7 969 7· 8 655 5· 4 845 6· 7 265 2· 1 891 5· 8 1062 7· 7 634 4· 6 425 2· 8 180 1· 3 Canada 2780 55 ·5 949 16 ·2 1683 31 ·8 674 14 ·9 215 4· 9 435 9· 3 142 3· 0 368 6· 0 545 10 ·1 274 5· 0 373 6· 1 113 2· 2 USA Nativ e Americans 297 31 ·5 76 7· 5 140 14 ·4 49 5· 7 15 1· 8 49 5· 7 19 2· 2 41 3· 7 45 4· 6 21 2· 0 34 3· 2 4 0· 4
Asian and Pacific Islanders
1294 43 ·9 378 12 ·1 596 19 ·9 214 7· 7 107 3· 9 117 4· 2 99 3· 5 133 4· 1 177 5· 8 200 6· 4 125 3· 8 11 0· 4 Black 2994 31 ·3 1442 13 ·4 2541 26 ·2 881 10 ·2 444 5· 3 968 10 ·9 154 1· 8 535 4· 8 1093 10 ·8 383 3· 8 423 3· 7 65 0· 7 White Hispanic 7366 65 ·4 1885 16 ·2 3249 28 ·6 933 8· 6 619 5· 7 811 7· 4 342 3· 1 773 6· 4 1169 10 ·2 755 6· 5 578 4· 8 79 0· 7
White non- Hispanic
17 709 54 ·5 5905 15 ·8 13 009 38 ·2 4452 15 ·0 1219 4· 2 3029 10 ·0 823 2· 7 2518 6· 4 3757 10 ·9 1769 5· 1 2781 7· 1 230 0· 7 East Asia 5855 47 ·4 1730 12 ·7 267 4 20 ·6 1236 12 ·0 506 5· 1 542 5· 1 377 3· 5 958 6· 2 925 7· 2 1263 9· 4 645 4· 0 298 2· 6 South Asia* 2176 34 ·1 825 12 ·0 825 12 ·4 180 3· 2 165 3· 1 229 4· 1 84 1· 5 316 4· 3 286 4· 5 168 2· 5 254 3· 5 154 2· 4 Southeast Asia 3925 52 ·7 74 5 9· 5 997 12 ·9 312 4· 4 404 6· 0 378 5· 4 227 3· 2 462 5· 6 391 5· 2 437 5· 7 402 5· 0 304 4· 1 W est Asia 3459 45 ·2 1807 22 ·6 1918 24 ·5 727 10 ·1 326 4· 6 534 7· 3 126 1· 7 532 6· 4 631 8· 2 342 4· 4 413 5· 0 81 1· 0 Eastern Europe 5265 44 ·3 2164 15 ·6 3793 30 ·0 1323 12 ·5 424 4· 1 1062 9· 8 248 2· 2 895 6· 0 1071 8· 6 529 4· 1 686 4· 5 260 2· 1 Northern Europe 6987 49 ·1 2258 13 ·9 5821 38 ·9 1327 10 ·1 576 4· 5 1235 9· 3 277 2· 1 942 5· 5 1445 9· 7 733 4· 9 74 8 4· 4 88 0· 6 Southern Europe 4200 51 ·1 1924 21 ·6 3156 37 ·6 1111 14 ·5 344 4· 6 700 9· 1 177 2· 3 731 7· 9 851 10 ·1 444 5· 2 548 5· 9 84 1· 0 W estern Europe 13 630 50 ·7 4992 16 ·3 10 628 38 ·0 3162 13 ·0 1082 4· 5 2447 9· 8 490 1· 9 2083 6· 5 2695 9· 7 1412 5· 0 1291 4· 1 75 0· 3 Oceania 2703 56 ·4 817 15 ·3 1285 26 ·2 500 11 ·4 187 4· 3 384 8· 5 115 2· 6 352 6· 4 449 9· 0 292 5· 9 354 6· 2 37 0· 8 Total 92 085 46 ·4 33 273 15 ·2 57 955 28 ·2 4234 10 ·4 18 323 4· 5 15 192 8· 2 4234 2· 3 13 320 5· 7 18 323 8· 9 10 200 4· 9 10 679 4· 6 2469 1· 2
Regions are represented b
y the contributing cancer registries (appendix pp 3–4).
Tumours classified b y Int ernational Classification of Childhood Canc er , v olume 3 .
2,6 Data are based
on
the paediatric
dataset.
WSR=age-standardised rate (world standard)
per
million
person-years
. *Comprising
data from India
only
.
Table 3
: Numbers
of cases and age-standardised incidence
of
tumours in children aged 0–14
years, 2001–10, b
y main
Leukaemia Lymphomas CNS tumours Sympathetic nerv ous system Retino -blastoma Renal tumours Hepatic tumours Bone tumours
Soft tissue sarcomas Germ cell and gonadal tumours Epithelial tumours and melanoma Other and unspecified
n ASR n ASR n ASR n ASR n ASR n ASR n ASR n ASR n ASR n ASR n ASR n ASR North Africa 184 26 ·4 258 37 ·0 97 13 ·9 6 0· 9 1 0· 1 7 1· 0 3 0· 4 100 14 ·3 85 12 ·2 40 5· 7 154 22 ·1 40 5· 7 Sub-Saharan Africa 129 19 ·0 183 27 ·0 41 6· 0 2 0· 3 0 0· 0 16 2· 4 21 3· 1 101 14 ·9 208 30 ·7 58 8· 6 126 18 ·6 103 15 ·2
Central America and Caribbean
366 22 ·8 479 29 ·9 226 14 ·1 11 0· 7 2 0· 1 22 1· 4 21 1· 3 209 13 ·0 128 8· 0 229 14 ·3 501 31 ·3 110 6· 9 South America 464 33 ·8 424 30 ·9 196 14 ·3 6 0· 4 1 0· 1 10 0· 7 14 1· 0 226 16 ·5 147 10 ·7 303 22 ·1 395 28 ·8 55 4· 0 Canada 570 27 ·2 1210 57 ·8 519 24 ·8 15 0· 7 1 0· 0 34 1· 6 20 1· 0 310 14 ·8 296 14 ·2 557 26 ·6 978 46 ·8 87 4· 2 USA Nativ e Americans 85 24 ·1 51 14 ·4 48 13 ·6 2 0· 6 1 0· 3 6 1· 7 2 0· 6 28 7· 9 29 8· 2 53 15 ·0 84 23 ·8 4 1· 1
Asian and Pacific Islanders
252 24 ·1 297 28 ·5 127 12 ·2 8 0· 8 0 0· 0 10 1· 0 14 1· 3 107 10 ·3 111 10 ·6 208 19 ·9 292 28 ·0 7 0· 7 Black 776 22 ·1 1385 39 ·4 542 15 ·4 29 0· 8 0 0· 0 86 2· 4 44 1· 3 417 11 ·9 592 16 ·8 421 12 ·0 758 21 ·6 43 1· 2 White Hispanic 1508 43 ·0 1306 37 ·3 558 15 ·9 19 0· 5 0 0· 0 38 1· 1 50 1· 4 487 13 ·9 489 14 ·0 1277 36 ·4 1104 31 ·5 43 1· 2
White non- Hispanic
3845 29 ·5 7178 55 ·1 3176 24 ·4 101 0· 8 2 0· 0 199 1· 5 154 1· 2 2014 15 ·5 2080 16 ·0 3636 27 ·9 7422 57 ·0 152 1· 2 East Asia 1683 31 ·5 1037 19 ·4 811 15 ·2 36 0· 7 0 0· 0 53 1· 0 90 1· 7 659 12 ·3 512 9· 6 1014 19 ·0 1786 33 ·4 176 3· 3 South Asia* 565 21 ·8 345 13 ·3 263 10 ·2 7 0· 3 1 0· 0 18 0· 7 12 0· 5 298 11 ·5 171 6· 6 178 6· 9 365 14 ·1 116 4· 5 Southeast Asia 767 26 ·5 418 14 ·4 215 7· 4 10 0· 3 0 0· 0 28 1· 0 63 2· 2 421 14 ·5 180 6· 2 333 11 ·5 640 22 ·1 192 6· 6 W est Asia 786 33 ·7 1222 52 ·4 513 22 ·0 23 1· 0 0 0· 0 26 1· 1 25 1· 1 448 19 ·2 297 12 ·7 338 14 ·5 736 31 ·6 49 2· 1 Eastern Europe 1048 21 ·8 2047 42 ·6 1001 20 ·8 41 0· 9 0 0· 0 80 1· 7 51 1· 1 637 13 ·2 477 9· 9 1181 24 ·6 1693 35 ·2 200 4· 2 Northern Europe 512 25 ·5 954 47 ·5 726 36 ·2 17 0· 8 0 0· 0 26 1· 3 18 0· 9 303 15 ·1 244 12 ·2 494 24 ·6 788 39 ·2 27 1· 3 Southern Europe 650 30 ·0 1562 72 ·1 655 30 ·2 27 1· 2 0 0· 0 36 1· 7 23 1· 1 336 15 ·5 349 16 ·1 508 23 ·4 1081 49 ·9 54 2· 5 W estern Europe 753 28 ·4 1466 55 ·4 814 30 ·7 19 0· 7 0 0· 0 38 1· 4 30 1· 1 449 17 ·0 357 13 ·5 777 29 ·3 1297 49 ·0 27 1· 0 Oceania 577 33 ·0 918 52 ·5 294 16 ·8 12 0· 7 0 0· 0 23 1· 3 20 1· 1 301 17 ·2 259 14 ·8 500 28 ·6 1280 73 ·2 15 0· 9 Total 15 520 28 ·5 22 74 0 41 ·8 10 822 19 ·9 391 0· 7 9 0· 0 756 1· 4 675 1· 2 7851 14 ·4 7011 12 ·9 12 105 22 ·2 21 480 39 ·5 1500 2· 8
Regions are represented b
y the contributing cancer registries (appendix pp 3–4).
Tumours classified b y Int ernational Classification of Childhood Canc er , v olume 3 .
2,6 Data are based
on
the general
dataset.
ASR=age-specific rate per million
person-years. *Comprising data from India only . Table 4 : Numbers
of cases and age-specific incidence
of
tumours in
young people aged 15–19
years, 2001–10, b
y main
of 284 649) of all cancers in children aged 0–14 years, and 7·8% (7851 of 100 860) in those aged 15–19 years (figure 2; appendix p 10). Soft tissue sarcomas were present in a similar proportion of cases in children aged 0–14 years and those aged 15–19 years in most regions
(table 3, 4; figure 2; appendix p 10). In sub-Saharan
Africa, 46% (579 of 1262) of all soft tissue sarcomas in children aged 0–14 years were Kaposi’s sarcoma compared with 57% (119 of 208) in those aged 0–19 years, whereas in all the other regions Kaposi’s sarcoma represented less than 1% of all soft tissue sarcomas in children younger than 15 years and a maximum of 2%
(14 of 592) in black children in the USA (data for all
regions not shown). Germ cell and gonadal tumours were rare in children younger than 15 years (10 200 [3·6%] of 284 649; table 3), and more common in those aged 15–19 years (12 105 [12·0%] of 100 860; table 4). The group of epithelial neoplasms and melanoma comprises several
specific types of carcinomas (adrenocortical, thyroid, nasopharyngeal, skin), all other types of carcinoma (except those occurring in kidney, liver, and gonads), and melanoma. This group constituted 3·8% (10 679 of 284 649) of all tumours in children aged 0–14 years and 21·3% (21 480 of 100 860) in those aged 15–19 years (appendix p 10). The group of other and unspecified tumours comprised 0·9% (2469 of 284 649) of all cases in children aged 0–14 years and 1·5% (1500 of
100 860) of all cases in those aged 15–19 years.
In 22 registries no tumours were classified in this category; other and unspecified tumours comprised 5% or more of all tumours in ten registries, including one
registry for which 12% (68 of 561)of all tumours were
classified as other and unspecified.
In children aged 0–14 years, the leading cancers in all regions combined were leukaemia, followed by CNS tumours, and then lymphomas, and this ranking was Figure 3: Incidence of cancer in children aged 0–14 years, 2001–10, by region
Incidence of all tumours (A) and less common cancers (B). Tumours classified by International Classification of Childhood Cancer, volume 3.6 Data are based on the
paediatric dataset. WSR=age-standardised rate (world standard population). *Comprising data from India only. †Defined in (B).
0 50 100 150 200
North Africa Sub-Saharan Africa Central America and Caribbean South America Canada USA, Native American USA, Asian and Pacific Islander USA, black USA, Hispanic white USA, non-Hispanic white East Asia South Asia* Southeast Asia West Asia Eastern Europe Northern Europe Southern Europe Western Europe Oceania 0 20 40 60 Leukaemia Lymphoma CNS tumours Less common tumours†
WSR per million person-years WSR per million person-years
A All cancers in age 0–14 years B Less common cancers in age 0–14 years
Sympathetic nervous system tumours Retinoblastoma Renal tumours Hepatic tumours Bone tumours
Soft tissue sarcomas Germ cell and gonadal tumours
Epithelial tumours and melanoma Other and unspecified
observed in most world regions (table 3). The exception to this pattern was seen in the two African regions (appendix p 10). Incidence rates of all tumour types varied considerably between the regions (figure 3). The ratios of highest to lowest regional WSR were higher than 5·0 for CNS tumours (6·2), germ cell and gonadal tumours (5·9), neuroblastoma (5·6), epithelial tumours and melanoma (5·5), and leukaemia (5·2).
In young people aged 15–19 years, lymphomas were the most common cancers in all regions combined, followed
by epithelial tumours and melanoma (table 4; figure 4).
However, leukaemia was the most common neoplasm in this age group in South America, Native American and white Hispanic children in the USA, south Asia (India),
and southeast Asia (table 4;figure 4). In Oceania, white
non-Hispanic children in the USA, in east Asia, and in Central America and the Caribbean the most common cancer type was the group of epithelial cancers and
melanoma(table 4;figure 4). Geographical variations in
incidence, expressed as the ratio of the highest to the lowest ASR across regions, were 5·0 or higher for hepatic tumours (7·8), germ cell tumours (6·4), CNS tumours (6·0), lymphomas (5·4), epithelial tumours and melanoma (5·2), and soft tissue sarcomas (5·0).
From the 1980s to 2001–10, the overall WSR for all
tumours in children aged 0–14 years increased from 124·0 per million person-years (95% CI 123·3–124·7) in the 1980s to 140·6 per million person-years (140·1–141·1) in 2001–10. The increase was seen in all regions except sub-Saharan Africa, and was smallest in Central America and the Caribbean (WSR 125·3 [95% CI 121·2–129·4] in 1980–89; 129·2 [95% CI 125·9–132·5] in 2001–10) and highest in southeast Asia (92·0 [95% CI 89·2–94·8]; 119·8 [95% CI 117·3–122·3]). In sub-Saharan Africa, a decrease was noted between the 1980s (81·0 [95% CI 76·8–85·2]) and 2001–10 (56·3 [95% CI 55·1–57·5]; figure 5; appendix p 7).
Discussion
Using data provided by 153 high-quality cancer registries, we report internationally comparable incidence rates of cancer in children aged 0–19 years during 2001–10. The incidence of cancer in children aged 0–14 years was 140·6 per million person-years, and in those aged 0–19 years was 155·8 per million person-years. We report
considerable variations in incidence by diagnostic group,6
sex, age group, and world region. We have also shown that the overall WSR in children aged 0–14 years has increased between the preceding comparable publication
covering the 1980s,10 and 2001–10. To our knowledge, this
report presents the best available information on cancer incidence for the given period and age group.
We chose WSR as a relative estimate of cancer burden, but it should not be used for estimating numbers of cases in a population, because the value of WSR depends on the choice of the standard population. The world standard
population7 has been used in previous international
publications;1,2 choosing the same standard thus ensures
comparability between populations and periods.
Although 20% of the cancers occurring in young people aged 15–19 years were epithelial tumours (the most prevalent histology types in adults) or melanoma, this age group also had high proportions of lymphomas, leukaemias, germ cell tumours, and sarcomas. Therefore,
ICCC-36 seems to be well adapted to reporting incidence in
this age group, because the named tumour groups represent the main diagnostic categories in ICCC-3. We found that the incidence of cancer in young people aged 15–19 years was 185·3 per million person-years, based on 100 860 cases.
Because not all the contributing paediatric cancer registries could provide data for young people aged 15–19 years, the analyses for children aged 0–14 years were based on a different dataset (paediatric dataset) than were the analyses for children aged 0–19 years or those aged 15–19 years (general dataset). The two resulting datasets Figure 4: Incidence of cancer in young people aged 15–19 years, 2001–10, by region
Tumours classified by International Classification of Childhood Cancer, volume 3.6 Data are based on the general
dataset. ASR=age-specific rate. *Comprising data from India only.
0 50 100 150 200 250
North Africa Sub-Saharan Africa Central America and Caribbean South America Canada USA, Native American USA, Asian and Pacific Islander USA, black USA, Hispanic white USA, non-Hispanic white East Asia South Asia* Southeast Asia West Asia Eastern Europe Northern Europe Southern Europe Western Europe Oceania Leukaemia Lymphoma CNS tumours
Sympathetic nervous system tumours Retinoblastoma
Renal tumours
ASR per million person-years Hepatic tumours Bone tumours Soft tissue sarcomas Germ cell and gonadal tumours Epithelial tumours and melanoma Other and unspecified
gave different estimates of incidence for the (common) age group of 0–14 years, and this incidence was 5% lower in the paediatric than in the general dataset. This difference can be explained by variations in population coverage between the registries, and possibly distinctive data sources used by the two types of registries (ie, those that included data for young people aged 15–19 years and those that did not), as was shown previously in an analysis
of data on childhood cancer in Europe.4 Although the
results presented from both datasets are based on the best data available for each age group, they also emphasise the importance of quality assurance, particularly when dealing with a rare disease such as childhood cancer.
We selected the contributing registries because they provided quality-assured data for the entire decade of 2001–10. Inevitably, the reported rates were influenced by this selection; however, they provide the best and unique comparable global incidence estimates for the given period because they are not affected by intermittent contributions for parts of the target period.
A particular strength of our study comes from separate presentation of the incidence patterns for the five racial and ethnic groups distinguished in the US data, despite the difficulties in classifying the US population into racial and ethnic groups due to population mixing,
migration, and self-declaration of ethnicity.11
Unfor-tunately, the ethnic differences within multi-ethnic populations of Europe, Canada, and some other regions could not be readily studied. In other countries (South Africa, Israel, Australia) it was possible to gather incidence data for specific ethnicities within the population. For the purpose of simplicity these data were not included in this paper; however, they are available online on the IICC-3 website.
Our study improved the overall data quality in all participating cancer registries, particularly in 72 of 153 whose datasets were not acceptable at the beginning of the study. The study raised the registries’ awareness of additional data sources (haematology, opthalmology, orthopaedics, dermatologicaly, neurology, endocrinology, and paediatric clinics) and of specific quality control. We required a high level of quality and completeness for our study, because small errors or omissions would have had a large impact on the resulting incidence rates.
Approximately 30 cancer registries dropped out of the study, irrespective of the quality of their data. Such loss is especially regrettable in LMICs, where data are sparse and health policy has to be based on information from other countries. Data collected on more than 40 million
person-years in 12 cancer registries (Canada [New
Brunswick, Prince Edward Island], Denmark, Finland, Germany [Berlin, Brandenburg, Bremen, Mecklenburg-Vorpommern, Sachsen-Anhalt, and the Free States Saxony and Thuringia], and Singapore) could not be used because these registries were bound by requirements of a specific administrative procedure to approve provision of their data.
Although the cancer registries follow international guidelines, we observed wide variation in registration techniques, access to data sources, case eligibility criteria, application and interpretation of registration standards, and coding systems. Non-malignant tumours repre sented 0–10% of the total cases and affected international comparability. Non-malignant tumours were eligible for registration more commonly in Europe than in other parts of the world. Other practices reduced data quality (eg, restricted or no access to pathology reports), completeness (eg, restricted or no access to identifiable death certificates), or timeliness (eg, third-party data encryption). In some registries cases were coded as Figure 5: Comparison of incidence of neoplasms in children aged 0–14 years in 1980–89 and 2001–10, by region
Data from the two time periods were standardised and peer reviewed using similar methods. Error bars show 95% CI. IICC-2=International Incidence of Childhood Cancer, volume 2.2 IICC-3=paediatric dataset (defined in table 2
and appendix pp 3–4). WSR=age-standardised rate (world standard population). *Comprising data from India only.
0 30 60 90 120 150 180
North Africa
Sub-Saharan Africa
Central America and Caribbean
South America North America East Asia South Asia* Southeastern Asia West Asia Eastern Europe Northern Europe Southern Europe Western Europe Oceania
WSR per million person-years
microscopically verified only if the pathology report could be reviewed by registry staff. In others, precise morphology codes were not available for a large proportion of microscopically verified diagnoses. Registries are often under-resourced, and large investments for a small proportion of cases in general cancer registries might not be seen as a priority; however, these variations highlight the need for support to enable production of high-quality and comparable data.
A high proportion of specified diagnoses cannot be ensured without available specialised diagnostic facilities. The category of unspecified morphology might have included misclassified specific cancers, but in the absence of precise documentation it might have also included cases that were not malignant or cancers that did not occur in children.
Although the differences in sex ratios by diagnostic group and age might have to a large extent reflected true
differences in disease occurrence,12 the differences by
geographical region could have more readily reflected sociocultural customs whereby boys are favoured over girls to seek medical attention when sick. The potential for such selective treatment in India and in some African populations was supported by our registry contacts in those regions when we inquired about a possibility of inequality in seeking health care.
The registries with no access to a national database of all causes of death might not have registered the cancers that were only discovered at the time of death, even though the proportion of missed cases might be low in childhood populations. In some countries death certification is non-existent whereas in others access to these records is hindered by data protection laws.
Factors external to the registry operations should also be considered. Higher socioeconomic level of develop-ment, better treatment facilities, and unobstructed access to data sources are linked to more advanced registration systems and better data quality. The registries operating in some LMICs were particularly affected by missing or infrequent official population estimates, and these data needed to be estimated by interpolation or extrapolation, influencing the reported rates. The low incidence rates observed in low-resource regions might in part have
resulted from underdiagnosis,13 but our analysis could
not quantify its extent. Treatment abandonment,
common in LMICs,14 might also have led to
under-registration if identified patients who refused treatment were not sufficiently well described (eg, missing dates or place of residence). Under-ascertainment of diagnosed cases might have resulted from administrative restrictions of access to medical files, political or social instability, competing needs, and inadequate political will, causing a dearth of resources, shortage or volatility of registry personnel, loss of perennial expertise, and missing or broken links with relevant data sources. Overestimates of incidence might have occurred in areas with superior treatment facilities if the place of
permanent residence could not be correctly determined
for registered patients, and national coverage would
neutralise such artefactual regional differences within a
country.15 Accurate incidence rates are also difficult to
obtain in ethnic minorities, such as the Native American population in the USA, possibly because of imprecise classification of the at-risk population, as well as patients
with cancer.16 Cancer statistics in high-income countries
might be influenced by overdiagnosis of some cancers detected by non-invasive imaging and screening tests, including neuroblastoma, thyroid cancer, melanoma,
and kidney cancer.17
Although a complete assessment of time trends in incidence falls outside the scope of this report, our data showed that the overall incidence of registered neoplasms in childhood increased between the 1980s and the 2000s. Our comparison is certainly influenced by the composition of the two data pools (different registries have contributed to the two compared periods); however, the increase in the overall rates is clear. The reasons might include improved diagnosis (eg, imaging of brain tumours in high-income countries and less under-diagnosis in some parts of world). Cancer registration is also developing constantly, and more effective ascertainment techniques might have been used since the 1980s. Future detailed analyses of time trends by tumour group and subpopulations will bring more clarity to the interpretation of these secular changes.
The reduction of cancer incidence in sub-Saharan Africa probably had two main causes. First, this IICC-3 study included data from the national childhood cancer registry of South Africa, which contributed 70% of all cases for this region and reported very low incidence rates. Of the five datasets classified as sub-Saharan African in IICC-2, only one (from Namibia) reported a lower overall incidence rate than the South African registry in IICC-3. The possible reasons for the low rates
in South Africa are discussed elsewhere.18 Second, the
implementation of antiretroviral therapy in some areas
affected by HIV19 has contributed to a decrease in
incidence of Kaposi’s sarcoma. This cancer type represented more than a third of the total cancer incidence in Kampala, Uganda, in the IICC-2 (WSR 182·7 per million person-years). The incidence of Kaposi’s sarcoma in Kampala halved between the IICC-2 and this IICC-3 study, and a decreasing trend between the 1990s and the 2000s was also noted in a Kampala registry
study.20
Leukaemia, the most common cancer in children worldwide, had the largest impact on total cancer incidence. The strikingly low incidence of leukaemia in the African regions, notably in sub-Saharan Africa, might give some clues as to the cause of this cancer. Even though strong underdiagnosis of leukaemia is suspected
in sub-Saharan Africa,21 leukaemia was also less
commonly diagnosed in black children in the USA than in the other US ethnic groups; however, whether
leukaemia might be underdiagnosed as a result of reduced access to health care associated with lower
economic status in this group is unclear.22 In children
aged 0–14 years, the highest leukaemia rates were in Hispanic white children in the USA (40% of total incidence). The Native American component of Hispanic ancestry was a presumed risk factor, based on the observations that known risk alleles at loci identified in genome-wide association studies of European-ancestry populations in CDKN2A, PIP4K2A, CEBPE, and ARID5B were all significantly associated with Native American
ancestry.23 Comparatively high incidence rates and the
largest proportion of leukaemia among all cancers were reported in southeast Asia. A link to the massive use of
pesticides in this world region24 to protect crops and
increase yields should be examined in specific studies, since exposure to pesticides has been associated with
leukaemia risk.25,26
The male predominance among patients with lymphoma is probably a result of innate sex differences in susceptibility, but with increasing age other factors might play a role, such as the increased risk of HIV
infection in boys compared with girls.27 The highest
incidence of lymphomas worldwide has been reported in the Mediterranean region (as shown in our study and
others28), and in HIV-infected populations,29 with B-cell
non-Hodgkin lymphoma an AIDS-defining malignancy. Burkitt’s lymphoma is endemic and common in some
sub-Saharan African childhood populations,30 in which
HIV infection can further accentuate its incidence.2,31
Hodgkin’s lymphoma is rarer in populations of south and east Asia than in other parts of the world; the undergoing socioeconomic changes might gradually result in a similarly high incidence to that observed in
Western populations.32,33
The highest incidence of all CNS tumours was noted in high-income countries, which is clearly related to the wide availability of diagnostic facilities. The lower incidence rates in LMICs most probably (and proportionately) reflect poor access to neuroimaging facilities (eg, low number of CT or MRI scans, long
waiting lists, and prohibitive costs of diagnostics tests).34,35
This poor access causes delay in diagnosis and possibly
underdiagnosis of brain tumours.36 Comparability of
incidence of CNS tumours across the continents would be greatly improved if all registries attempted to collect information on non-malignant CNS tumours, at least in children.
This study describes the global cancer incidence patterns in children younger than 20 years for 2001–10, providing an update to comparable information that is
now almost 20 years old.2 Despite possible artefacts
influencing data availability, quality, and comparability, the size of the studied populations and the observed differences in our study suggest that our data are sufficiently robust for international comparisons of childhood cancer occurrence, and provide useful pointers
for further studies. The collected data can be used for further research, including continued development of childhood-specific registration standards and guidelines, detailed studies in subpopulations and by tumour subtype, and global estimates of cancer indicators. This report constitutes a springboard for attaining several targets of the Sustainable Development Goal aiming at ensuring healthy lives and promoting wellbeing of all at all ages. High-quality data over time is vital to devising cancer control mechanisms in childhood populations worldwide. Local data that are internationally comparable are therefore indispensable for aetiological research and for effective health policy actions. Sharing of data internationally should not impose an unaffordable burden on data acquisition and validation in coordinated studies. To secure data availability and quality, constant support of cancer registration is required at local, national, and international levels.
Contributors
ES-F, LAGR, FM, PH, HYS, and CAS designed the study. ES-F, AD, and MC, in collaboration with LAGR, FM, PH, HYS, and CAS acquired the data for the study. MC did the analyses. ES-F and MC produced the tables and figures. AD and ES-F did the literature search. ES-F drafted the manuscript, which was reviewed, modified, and approved by ES-F, LAGR, FM, AD, FB, PH, HYS, and CAS.
Declaration of interests
We declare no competing interests.
Acknowledgments
International Incidence of Childhood Cancer, volume 3 is supported by the
International Agency for Research on Cancer and the Union for International Cancer Control. The cooperation of all cancer registries and members of the International Association of Cancer Registries is gratefully acknowledged.
References
1 Parkin DM, Stiller CA, Draper GJ, Bieber CA, Terracini B, Young JL. International incidence of childhood cancer. Lyon: International Agency for Research on Cancer, 1988.
2 Parkin DM, Kramarova E, Draper GJ, et al. International incidence of childhood cancer, volume 2. Lyon: International Agency for Research on Cancer, 1998.
3 Ries LG, Smith MA, Gurney J, et al. Cancer incidence and survival among children and adolescents: United States SEER Program 1975–1995. Bethesda, MD: National Cancer Institute, SEER Program, 1999: 179.
4 Steliarova-Foucher E, Kaatsch P, Lacour B, et al.
Quality, comparability and methods of analysis of data on childhood cancer in Europe (1978–1997): report from the Automated Childhood Cancer Information System project. Eur J Cancer 2006;
42: 1915–51.
5 Fritz A, Percy C, Jack A, et al. International classification of diseases for oncology (ICD-O), 3rd edn. Geneva: World Health Organization, 2000.
6 Steliarova-Foucher E, Stiller C, Lacour B, Kaatsch P. International classification of childhood cancer, third edition.
Cancer 2005; 103: 1457–67.
7 Segi M, Fujisaku S, Kurihara M, Narai Y, Sasajima K. The age-adjusted death rates for malignant neoplasms in some selected sites in 23 countries in 1954–1955 and their geographical correlation. Tohoku J Exp Med 1960; 72: 91–103.
8 UN Department of Economic and Social Affairs. Statistics division: methodology. Standard country or area codes for statistical use (M49). https://unstats.un.org/unsd/methodology/m49/ (accessed Oct 28, 2016).
9 UN Department of Economic and Social Affairs. Population division; world population prospects 2015. https://esa.un.org/unpd/ wpp/ (accessed Jan 19, 2017).
10 Parkin DM, Stiller CA, Draper GJ, Bieber CA. The international incidence of childhood cancer. Int J Cancer 1988; 42: 511–20. 11 Ducore JM, Parikh-Patel A, Gold EB. Cancer occurrence in
southeast Asian children in California. J Pediatr Hematol Oncol 2004; 26: 613–18.
12 Dorak MT, Karpuzoglu E. Gender differences in cancer susceptibility: an inadequately addressed issue. Front Genet 2012; 3: 268.
13 Magrath I, Steliarova-Foucher E, Epelman S, et al. Paediatric cancer in low-income and middle-income countries. Lancet Oncol 2013;
14: e104–16.
14 Ospina-Romero M, Portilla CA, Bravo LE, Ramirez O. Caregivers’ self-reported absence of social support networks is related to treatment abandonment in children with cancer.
Pediatr Blood Cancer 2016; 63: 825–31.
15 Steliarova-Foucher E, Stiller C, Colombet M, Kaatsch P, Zanetti R, Peris-Bonet R. Registration of childhood cancer: moving towards pan-European coverage? Eur J Cancer 2015; 51: 1064–79.
16 Mahoney MC, Va P, Stevens A, Kahn AR, Michalek AM. Fifty years of cancer in an American Indian population. Cancer 2009; 115: 419–27. 17 Welch HG, Black WC. Overdiagnosis in cancer. J Natl Cancer Inst
2010; 102: 605–13.
18 Stefan DC, Stones DK, Wainwright RD, et al. Childhood cancer incidence in South Africa, 1987–2007. S Afr Med J 2015; 105: 939–47. 19 Mutyaba I, Phipps W, Krantz EM, et al. A population-level
evaluation of the effect of antiretroviral therapy on cancer incidence in Kyadondo County, Uganda, 1999–2008.
J Acquir Immune Defic Syndr 2015; 69: 481–86.
20 Wabinga HR, Nambooze S, Amulen PM, Okello C, Mbus L, Parkin DM. Trends in the incidence of cancer in Kampala, Uganda 1991–2010. Int J Cancer 2014; 135: 432–39.
21 Togo B, Traore F, Togo AP, et al. Epidemiology and prognosis of childhood cancers at Gabriel-Toure Teaching Hospital (Bamako, Mali). Med Sante Trop 2014; 24: 68–72 (in French). 22 Macartney S, Bishaw A, Fontenot K. Poverty rates for selected
detailed race and Hispanic groups by state and place: 2007–2011. Washington, DC: United Stated Census Bureau, 2013.
23 Walsh KM, Chokkalingam AP, Hsu LI, et al. Associations between genome-wide Native American ancestry, known risk alleles and B-cell ALL risk in Hispanic children. Leukemia 2013; 27: 2416–19.
24 Gupta A. Pesticide use in south and south-east Asia: environmental public health and legal concerns. Am J Environ Sci 2012; 8: 152. 25 Ward MH, Colt JS, Metayer C, et al. Residential exposure to
polychlorinated biphenyls and organochlorine pesticides and risk of childhood leukemia. Environ Health Perspect 2009; 117: 1007–13. 26 Hernandez AF, Menendez P. linking pesticide exposure with
pediatric leukemia: potential underlying mechanisms. Int J Mol Sci 2016; 17: 461.
27 Horesh N, Horowitz NA. Does gender matter in non-Hodgkin lymphoma? Differences in epidemiology, clinical behavior, and therapy. Rambam Maimonides Med J 2014; 5: e0038.
28 Stiller CA, Parkin DM. International variations in the incidence of childhood lymphomas. Paediatr Perinat Epidemiol 1990; 4: 303–24. 29 Levine AM. AIDS-related malignancies: the emerging epidemic.
J Natl Cancer Inst 1993; 85: 1382–97.
30 van den Bosch CA. Is endemic Burkitt’s lymphoma an alliance between three infections and a tumour promoter? Lancet Oncol 2004; 5: 738–46.
31 Mutalima N, Molyneux E, Jaffe H, et al. Associations between Burkitt lymphoma among children in Malawi and infection with HIV, EBV and malaria: results from a case-control study. PLoS One 2008; 3: e2505.
32 Koh YW, Kang HJ, Yoon DH, et al. Changing trend of Epstein-Barr virus association in Hodgkin lymphoma in the Republic of Korea.
Ann Hematol 2013; 92: 1653–60.
33 Hjalgrim H. On the aetiology of Hodgkin lymphoma. Dan Med J 2012; 59: B4485.
34 Amayiri N, Bouffet E. Pediatric neuro-oncology. In: Stefan DC, Rodriguez-Galindo C, eds. Pediatric neuro-oncology in countries with limited resources: a practical manual. New York: Springer Science & Business Media, 2014: 365–76.
35 Hadley LG, Rouma BS, Saad-Eldin Y. Challenge of pediatric oncology in Africa. Semin Pediatr Surg 2012; 21: 136–41. 36 Reutfors J, Kramarova E, Weiderpass E, Monge P, Wesseling C,
Ahlbom A. Central nervous system tumours in children in Costa Rica, 1981–96. Paediatr Perinat Epidemiol 2002; 16: 219–25.