PAPER
QUALITY ASSESSMENT OF MEDITERRANEAN
SHRIMPS DURING FROZEN STORAGE
C. CONDURSO1, G. TRIPODI1*, F. CINCOTTA1, C. M. LANZA2,A. MAZZAGLIA2
and A. VERZERA1
1 Department of Chemical Sciences, University of Messina, Viale F. d’Alcontres, 31 98166 Messina, Italy 2 Department of Agriculture, Food and Environment, University of Catania, Via S. Sofia 98123 Catania, Italy
*Corresponding author. Tel.: +39 +0906765440; fax: +39 0906765186 E-mail address: [email protected]
ABSTRACT
Aim of the research was to evaluate the effects of frozen storage on the quality of two Mediterranean wild shrimps, namely Parapenaeus longirostris (deepwater pink shrimp) and
Parapandalus narval (narwal shrimp) in order to promote the marketing of these
little-known shrimp species as frozen products, strengthening and enhancing their economic value. Quality changes were determined by sensory evaluation combined with chemical and chemical/physical analyses, including determination of volatile aroma constituents. In particular, raw and cooked shrimp samples were evaluated at various frozen storage intervals up to sixteen months. The variation observed for the chemical and chemical-physical indices did not diminish the sensory quality of both shrimp species. The results confirmed that freezing allows maintaining a good sensory quality of the considered shrimp species.
Keywords: Deepwater pink shrimp, frozen storage, narwal shrimp, sensory evaluation, volatile aroma compounds
1. INTRODUCTION
The Mediterranean shrimp species include, among others, the deepwater pink shrimp (Parapenaeus longirostris, Lucas 1846) and the narwal shrimp (Parapandalus narval, Fabricius 1787). Both species live in deep waters on muddy or muddy-sandy bottoms. Parapenaeus
longirostris has a wide geographical distribution, being found both in the Eastern and
Western Atlantic (OLASO, 1990), as well as in the Mediterranean and its adjacent seas (MASSUTTI, 1963); Italy is the country with the largest catches (HOLTHUIS, 1980) especially in the channel of Sicily and in the Ionian Sea. Parapandalus narval has an Eastern Atlantic-Mediterranean distribution (THESSALOU-LEGAKI, 1992) and is very common in the sea of Ustica Island.
Shrimps presumably represent the most important market for seafoods. In 2014 the global shrimp production was around 7×10⁶ metric tons, of which almost 4×10⁶ from aquaculture
(LARKIN et al., 2015). The international trade is dominated by USA, Japan and European countries as importers, whereas developing nations, especially South East Asian countries, act as the main shrimp suppliers of the world.
Italy imports most of its demand mainly as farmed shrimp whereas the two Mediterranean wild shrimps, namely Parapenaeus longirostris and Parapandalus narval, are of little commercial importance, sold only as fresh locally and close to the fishing grounds since their limited shelf life.
Although freezing is an effective method for preserving foods, some deterioration in frozen food quality can occur during storage, such as colour fading (CHANDRASEKARAN, 1994; OKPALA and BONO, 2016), lipid oxidation (RIAZ and QADRI, 1990), denaturation of protein (BHOBE and PAI, 1986), sublimation and recrystallization of ice (LONDAHL, 1997). These can result in off-flavours, rancidity, dehydration, loss of juiciness, textural changes (BHOBE and PAI 1986; YAMAGATA and LOW 1995; LONDAHL, 1997) and increase in volatile basic nitrogen (RIAZ and QADRI 1990; YAMAGATA and LOW, 1995).
Some papers are present in literature on the quality changes of frozen shrimps during storage (YAMAGATA and LOW 1995; BAK et al., 1999; BOONSUMREJ et al., 2007; TSIRONI et al., 2009; BONO et al., 2016). Only few of these evaluated the sensory quality or related the sensory evaluation to the volatile aroma compounds (ROCHAT et al., 2009; ALAM and SOLBERG, 2009), but according to our knowledge, no informations are reported on Parapenaeus longirostris and Parapandalus narval.
In view of the fact that frozen shrimp is a product of high commercial value and increasing demand due to its competitive price and extended shelf life (TSIRONI et al., 2009), the aim of the research was to evaluate the effects of frozen storage time on the quality of the deepwater pink and narwal shrimps in order to promote the marketing of these little-known shrimp species as frozen products, strengthening and enhancing their economic value. Since the consumer is the ultimate judge of quality, chemical and instrumental methods were matched with the sensory evaluation: chemical and chemical-physical indices, volatile aroma constituents and sensory properties were determined at different times during frozen storage both on raw and cooked samples.
2. MATERIALS AND METHODS 2.1. Sampling
Shrimp specimens of Parapenaeus longirostris, Lucas 1846 (FAO name: deepwater pink shrimp) and Parapandalus narval, Fabricius 1787 (FAO name: narwal shrimp) were caught
off the southeast coast of Sicily (Porto Palo, Siracusa, Italy - FAO 37: Mediterranean, Black sea; Subarea 37.2: Central Mediterranean; Division 37.2.2: Ionian) in March 2013. Samples of frozen shrimps (size: Parapenaeus longirostris, 10-15 cm; Parapandalus narval, 7 cm) were provided by a Sicilian company that owns and operates both the fishing boats and the packing and storage facilities. After catch, shrimps were put into ice, then quick-frozen at - 40°C, stored at - 18°C under vacuum (-0.8 bar) and transported frozen (at constant - 18°C) to the laboratory. All shrimp samples came from the same frozen batch; for each shrimp species eight packages in total were purchased and stored at constant - 18°C for sixteen months. The chemical and sensory analyses were carried out immediately after arriving at the lab and at specific intervals during storage. At fixed time, one package was thawed at room temperature and sufficient quantities were used for analyses. Unpeeled raw and cooked shrimp samples were analysed immediately after thawing. Cooked shrimps were obtained steaming unpeeled specimens for 15 min. All determinations were made in triplicate.
2.2. pH Measurement
The pH values of the raw samples were determined on homogenates of samples in distilled water (1:2 w⁄w) by using a pHmeter MP220 (Mettler Toledo, Milan, Italy) at 25°C.
2.3. Determination of the total volatile basic nitrogen (TVB-N)
For the determination of the total volatile basic nitrogen (TVB-N) of the raw samples, steam distillation of an extract deproteinised by trichloroacetic acid extraction was used according to official method (EU, 1995). Results were expressed as mg TVB-N/100 g of wet sample.
2.4. Colour measurement
Quantification of the colour change was based on measurement of CIELab values (L*-value: lightness; a*-(L*-value: redness and greenness; b*-(L*-value: yellowness and blueness), using a NR-3000 Colourimeter (Nippon Denshoku Ind. Co. Ltd, Tokyo, Japan). The instrument was standardized under ‘‘C’’ illuminant condition according to the CIE (Commission International de l’Eclairage) using a standard white reference tile. At predetermined times of storage, according to the design, measurements were conducted for raw and cooked shrimp at five points. All measurements were carried out on three different shrimp samples.
The average values were reported and values of ∆E were determined: ∆E = √(L*-L0*) 2 + (a*-a 0*) 2 + (b*-b 0*) 2
where L0*, a0*, and b0* are the values of L*, a* and b* colour parameters at storage time zero.
2.5. HS-SPME sampling
The method of headspace solid phase microextraction (HS-SPME/GC-MS) was used for the isolation and concentration of volatiles. The analyses were conducted on peeled raw and cooked shrimp samples. To 5 g of each shrimp sample, placed in a 40 ml vial, 14 ml of a NaCl saturated aqueous solution were added. Extraction was performed in the headspace vial kept at 35°C using a DVB/CAR/PDMS fibre of 50/30 &m film thickness (Supelco, Bellefonte, PA, USA) housed in its manual holder (Supelco, Bellefonte, PA,
USA). The sample was equilibrated for 30 min and then extracted for 30 min. During the extraction, the sample was continuously stirred. After the sampling, the SPME fibre was introduced onto the splitless injector of the GC/MS maintained at 260°C for 3 min for the thermal desorption of the analytes. No artefacts were observed after a SPME analysis of the saturated saline solution performed as blank analysis.
2.6. GC-MS analysis
A Varian 3800 gas chromatograph directly interfaced with a Varian 2000 ion trap mass spectrometer (Varian Spa, Turin, Italy) was used. The conditions were as follows: injector temperature, 260 °C; injection mode, splitless; capillary column, CP-Wax 52 CB, 60 m, 0.25 mm i.d., 0.25 &m film thickness (Chrompack Italy s.r.l., Turin, Italy); oven temperature, 45°C held for 5 min, then increased to 200°C at a rate of 5°C/min and to 240°C at 3°C/min; 240°C held for 20 min; carrier gas, helium at a constant pressure of 10 psi; transfer line temperature, 250°C; acquisition range, 40–250 m/z; scan rate, 1 scan/s. Each volatile component was identified using mass spectral data, NIST 11 library (NIST/EPA/NIH Mass Spectra Library, version 2.0 g, USA), linear retention indices, literature data and injection of standards where available. The linear retention indices (LRI) were calculated according to VAN DEN DOOL and KRATZ (1963) equation.
2.7. Sensory analysis
The sensory profiles of the shrimp samples were evaluated following the UNI 10957, 2003 method. Twenty-five judges were submitted to preliminary tests to determine their sensory performance on basic tastes and the aromas associated with shrimps. The sensory profile (UNI 10957, 2003) was defined by using a selected panel of twelve judges trained over four sessions. Panelists were asked to score appearance and odour of raw peeled shrimp and appearance, odour, texture, and taste of cooked shrimp. A list of descriptors was selected based on the frequency (60 %) of the terms used by the judges in several sessions. Reference standards were available to define descriptors. The descriptors were quantified using a nine-point intensity scale, where 1 = “not perceptible” and 9 = “strongly perceptible”. The shrimp samples were tested in triplicate. Each judge evaluated the shrimp samples in two sessions. All evaluations were conducted from 10.00 to 12.00 AM in individual booths (ISO 8589, 2007) illuminated with white light. The order of presentation was randomized among judges and sessions. Water was provided for rinsing between shrimp samples. All data were acquired by a direct computerized registration system (FIZZ Biosystemes. ver. 2.00 M, Couternon, France).
2.8. Statistical analysis
Chemical and sensory data were subjected to analysis of variance (ANOVA), using Statgraphics Plus software (ver. 5.1). Duncan’s multiple range test was applied to the data to identify any significant differences between the analysed samples. The model was statistically significant with P<0.05.
3. RESULTS AND DISCUSSIONS
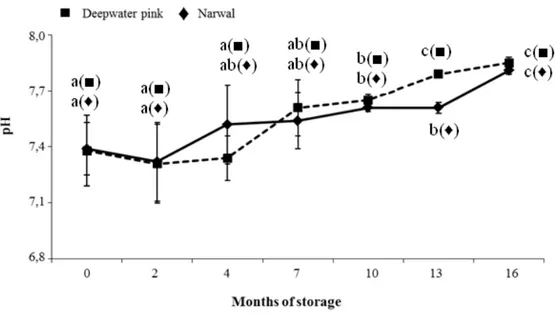
Figure 1 shows the variation of the pH values during frozen storage in raw deepwater pink and narwal shrimps. For both shrimp species the pH values ranged between 7.3-7.8 in agreement with CADUN et al. (2005) who reported pH values of 7.64 for frozen
deepwater pink shrimp; no statistically significant (P>0.05) increase resulted till four month. The pH determination is one of the most frequently used physical methods for the quality control of seafood products since they are affected by the changes in the concentrations of free hydrogen and hydroxyl ions because of the shifts in the oxidation– reduction balance of the food by the activity of micro-organisms or enzymes (VARLIK et
al., 2000). Generally, the pH value of crustaceans is higher than that of fish and mammal
species because of their higher content of nonprotein nitrogenous compounds (SHAHIDI, 1994). From our results, the pH values of analysed shrimp samples during storage resulted always below 8, the critical acceptability limit for most shellfish products (SCHORMULLER, 1968).
Figure 1: pH variations of raw shrimp samples during frozen storage (Error bars indicate standard error of
measurements).
For each species different letters indicate statistically significant differences among mean values at P ≤ 0.05 by Duncan’s multiple range test.
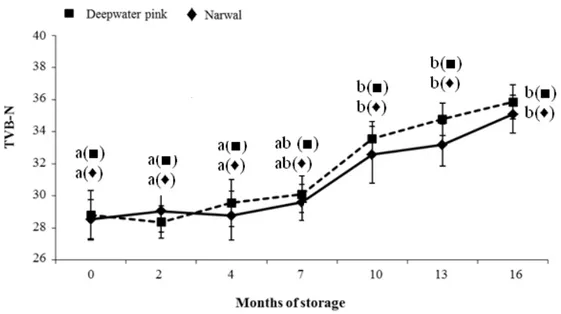
Figure 2 shows the total volatile basic nitrogen (TVB-N) values in raw deepwater pink and narwal shrimps during storage. The TVB-N content resulted around 29 mg/100 g of wet weight in the shrimp samples of the two species at the beginning of storage, and increased reaching the values of 35.09 mg/100 g and 35.85 mg/100 g at the end of storage for deepwater pink and narwal shrimps, respectively. Statistically significant increases were observed after four month of storage for both shrimp species. The increase in TVB-N values is consistent with the results of the pH values: the TVB-N increase during the storage turns the medium alkaline and as a result pH increases. The level of TVB-N is considered a useful index of microbial spoilage in different fresh and lightly preserved seafood (OZOĞUL and OZOĞUL, 2000). The limit of TVB-N values for seafood products of good sensory quality has been reported to be 30 mg/100 g. However, this limit may be questionable for shrimp species since the average TVB-N values for fresh crustaceans are often higher (OEHLENSCHLÄGER, 1997); in a study by COBB et al. (1973) the initial TVB-N content of fresh shrimp tails from different batches of shrimp stored on ice, ranged from 13.5 to 38.2 mg N/100 g; however a high sensory quality of shrimp samples was
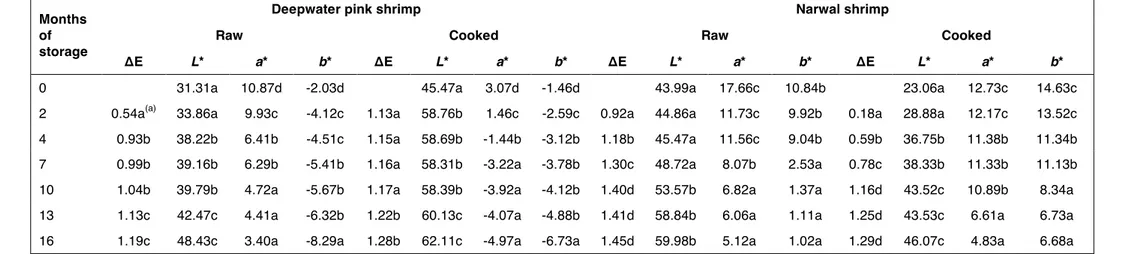
perceived. As a consequence, TVB-N content cannot be considered as an indicator of freshness by itself but it must be always enhanced by the sensory tests (CHEN et al., 1995). Table 1 illustrates the changes of L*, a* and b* in raw and cooked deepwater pink and narwal shrimps during frozen storage. L* values increased whereas a* and b* values decreased when storage time increased; the colour of shrimp changed from red and yellow to dull lighter colour. In Table 1 ∆E values for raw and cooked shrimps are also reported. ∆E values, indicating the total colour changes, increased with an increase in storage time. For raw deepwater pink shrimp statistically significant variations resulted at the beginning and at the end of storage, whereas for cooked samples a significant increase was observed only after thirteen months. Regarding the narwal shrimps, ∆E values significantly increased until ten months both in raw and cooked samples. The rate of increase was higher for narwal shrimp samples, both raw and cooked, than for deepwater pink shrimps probably due to the deeper colour of the former as indicated by the higher scores of the colour sensory descriptor (Table 3). Shrimp colour is linked to the content of astaxanthin and its esters, that are the major pigments in shrimps; drying and storage conditions affect shrimp colour due to the astaxanthin oxidation and isomerisation reactions that lead to colourless compounds and, thus, to the loss of the typical redness and yellowness (CHEN et al., 1995; NIAMNUY et al., 2008).
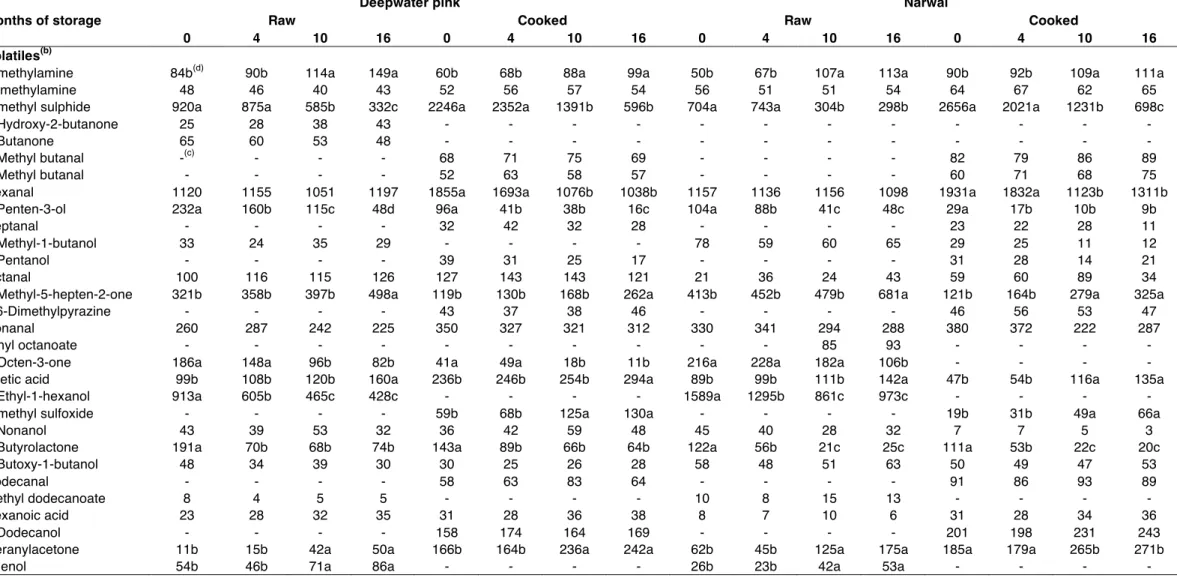
Table 2 shows the amount of the volatile compounds detected in raw and cooked deepwater and narwal shrimp samples at different storage time. A total of thirty compounds have been observed, such as aldehydes, ketones, alcohols, esters, acids, nitrogen- and sulfur- containing compounds.
Figure 2: Total volatile basic nitrogen values (mg N/100 g shrimp flesh) of raw shrimp samples during
frozen storage (Error bars indicate standard error of measurements).
Figure legend: For each species different letters indicate statistically significant differences among mean values at P ≤ 0.05 by Duncan’s multiple range test.
Slight differences in the qualitative and quantitative volatile composition of the two shrimp species and during the storage period, as well as between raw and cooked samples, resulted. In raw shrimps, hexanal, 2-ethyl-1-hexanol and dimethylsulphide were
the most abundant compounds, followed by 6-methyl-5-hepten-2-one and nonanal; 1-penten-3-ol, octanal (only in deepwater pink shrimp samples), 1-octen-3-one and γ-butyrolactone were also detected in a good amount. Some of these volatiles, namely dimethyl sulphide, 1-penten-3-ol, 1-octen-3-one, 2-ethyl-1-hexanol and γ-butyrolactone, decreased during the storage period but they remained among the most abundant components of volatile fraction up to sixteen months. Aldheydes, ketones and alcohols containing 6, 8 and 9 carbon atoms are derived from long-chain polyunsaturated fatty acid via 12- or 15-lipoxygenases and hydroperoxide lyase (BAEK and CADWALLADER, 1997) and are responsible of the pleasant planty, green and melony aromas and flavours of fresh seafoods. In particular hexanal contributes to the distinct green plant-like, grassy and apple-like aromas of fresh shrimp, whereas 2-ethyl-1-hexanol, together with short-chain alcohols, contributes to the typical sweet aroma of shrimps (ALASALVAR et al., 1997). Also dimethyl sulphide provides a pleasant seashore-like smell in fresh seafoods (IIDA, 1988); in fact, although sulphur compounds are usually associated with deteriorated seafoods, there is evidence that they can be present even in fresh ones and are considered important volatile aroma components in marine crustaceans (ALASALVAR et al., 1997). γ-Butyrolactone has faintly sweet odour reminiscent of rancid butter; lactones have been identified in roasted shrimp and boiled scallops; they derived from aliphatic saturated and unsaturated γ-hydroxycarboxylic and δ-hydroxycarboxylic acids (PAN and KUO, 1994). Dimethylamine, trimethylamine, acetic acid, and phenol were detected in low amount in fresh samples and slightly increased during frozen storage, except for trimethylamine, whose variations during storage were not statistically significant both in narwal and in deepwater shrimp samples. The formation of trimethylamine in frozen seafoods is prevented by the inhibition of microbial growth, yet dimethylamine is produced enzymatically: CASTELL et al. (1970) reported the increase of dimethylamine content in frozen fish muscle due to enzymatic breakdown of trimethylamine oxide. Also acetic acid could be formed by enzymatic decomposition of either lipid autoxidation or secondary hydroperoxides of fatty acids (ALASALVAR et al., 1997), whereas phenol formation occurs via decarboxylation of phenolic carboxylic acids (SPURVEY, 1998).
In all the samples, 6-methyl-5-hepten-3-one and geranylacetone (spicy and flowery notes) were present; these compounds, deriving from carotenoid degradation, showed a statistically significant increase during storage. Their amount and the rate of increase during storage are higher in narwal than in deepwater pink shrimps.
2,4-Decadienal, (E,Z)-2,4-heptadienal, (E,Z)-3,5-octadien-2one and (Z)-4-heptenal, deriving from lipid autoxidation during storage, were not detected. The absence of these compounds, responsible of stale and oxidized aromas and of fish cold-stored off-flavours (ALASALVAR et al., 1997), was probably due to the very low fat content of deepwater pink and narwal shrimps.
As expected, the cooked shrimps showed some differences in volatile aroma profile compared to the raw ones. After cooking, hexanal and dimethylsulphide remained the main constituents of the volatile fraction but their amount decreased when freezing time increased. 2-Methylbutanal, 3-methylbutanal, 2,6-dimethylpyrazine, dimethylsulfoxide, 1-dodecanol were detected only in cooked shrimps samples and their amount did not vary among the cooked samples. Among these compounds, 1-dodecanol, with a flower-like odour, has been already recognized as an important volatile of cooked shrimps (MANDEVILLE et al., 1992). 2-Methylbutanal and 3-methylbutanal are well known as amino acid degradation products and may be generated either thermally (Strecker degradation) or enzymatically from isoleucin and leucin.
Table 1: ∆E, L*, a* and b* values of shrimp samples during frozen storage.
Months of storage
Deepwater pink shrimp Narwal shrimp
Raw Cooked Raw Cooked
ΔE L* a* b* ΔE L* a* b* ΔE L* a* b* ΔE L* a* b*
0 31.31a 10.87d -2.03d 45.47a 3.07d -1.46d 43.99a 17.66c 10.84b 23.06a 12.73c 14.63c
2 0.54a(a) 33.86a 9.93c -4.12c 1.13a 58.76b 1.46c -2.59c 0.92a 44.86a 11.73c 9.92b 0.18a 28.88a 12.17c 13.52c 4 0.93b 38.22b 6.41b -4.51c 1.15a 58.69b -1.44b -3.12b 1.18b 45.47a 11.56c 9.04b 0.59b 36.75b 11.38b 11.34b 7 0.99b 39.16b 6.29b -5.41b 1.16a 58.31b -3.22a -3.78b 1.30c 48.72a 8.07b 2.53a 0.78c 38.33b 11.33b 11.13b 10 1.04b 39.79b 4.72a -5.67b 1.17a 58.39b -3.92a -4.12b 1.40d 53.57b 6.82a 1.37a 1.16d 43.52c 10.89b 8.34a 13 1.13c 42.47c 4.41a -6.32b 1.22b 60.13c -4.07a -4.88b 1.41d 58.84b 6.06a 1.11a 1.25d 43.53c 6.61a 6.73a 16 1.19c 48.43c 3.40a -8.29a 1.28b 62.11c -4.97a -6.73a 1.45d 59.98b 5.12a 1.02a 1.29d 46.07c 4.83a 6.68a
Table 2: Volatile fraction composition(a) of shrimp samples during frozen storage.
Months of storage
Deepwater pink Narwal
Raw Cooked Raw Cooked
0 4 10 16 0 4 10 16 0 4 10 16 0 4 10 16
Volatiles(b)
Dimethylamine 84b(d) 90b 114a 149a 60b 68b 88a 99a 50b 67b 107a 113a 90b 92b 109a 111a
Trimethylamine 48 46 40 43 52 56 57 54 56 51 51 54 64 67 62 65
Dimethyl sulphide 920a 875a 585b 332c 2246a 2352a 1391b 596b 704a 743a 304b 298b 2656a 2021a 1231b 698c
3-Hydroxy-2-butanone 25 28 38 43 - - - -
2-Butanone 65 60 53 48 - - - -
2-Methyl butanal -(c) - - - 68 71 75 69 - - - - 82 79 86 89
3-Methyl butanal - - - - 52 63 58 57 - - - - 60 71 68 75
Hexanal 1120 1155 1051 1197 1855a 1693a 1076b 1038b 1157 1136 1156 1098 1931a 1832a 1123b 1311b
1-Penten-3-ol 232a 160b 115c 48d 96a 41b 38b 16c 104a 88b 41c 48c 29a 17b 10b 9b
Heptanal - - - - 32 42 32 28 - - - - 23 22 28 11
2-Methyl-1-butanol 33 24 35 29 - - - - 78 59 60 65 29 25 11 12
1-Pentanol - - - - 39 31 25 17 - - - - 31 28 14 21
Octanal 100 116 115 126 127 143 143 121 21 36 24 43 59 60 89 34
6-Methyl-5-hepten-2-one 321b 358b 397b 498a 119b 130b 168b 262a 413b 452b 479b 681a 121b 164b 279a 325a
2,6-Dimethylpyrazine - - - - 43 37 38 46 - - - - 46 56 53 47
Nonanal 260 287 242 225 350 327 321 312 330 341 294 288 380 372 222 287
Ethyl octanoate - - - 85 93 - - - -
1-Octen-3-one 186a 148a 96b 82b 41a 49a 18b 11b 216a 228a 182a 106b - - - -
Acetic acid 99b 108b 120b 160a 236b 246b 254b 294a 89b 99b 111b 142a 47b 54b 116a 135a
2-Ethyl-1-hexanol 913a 605b 465c 428c - - - - 1589a 1295b 861c 973c - - - -
Dimethyl sulfoxide - - - - 59b 68b 125a 130a - - - - 19b 31b 49a 66a
1-Nonanol 43 39 53 32 36 42 59 48 45 40 28 32 7 7 5 3
γ-Butyrolactone 191a 70b 68b 74b 143a 89b 66b 64b 122a 56b 21c 25c 111a 53b 22c 20c
4-Butoxy-1-butanol 48 34 39 30 30 25 26 28 58 48 51 63 50 49 47 53
Dodecanal - - - - 58 63 83 64 - - - - 91 86 93 89
Methyl dodecanoate 8 4 5 5 - - - - 10 8 15 13 - - - -
Hexanoic acid 23 28 32 35 31 28 36 38 8 7 10 6 31 28 34 36
1-Dodecanol - - - - 158 174 164 169 - - - - 201 198 231 243
Geranylacetone 11b 15b 42a 50a 166b 164b 236a 242a 62b 45b 125a 175a 185a 179a 265b 271b
Phenol 54b 46b 71a 86a - - - - 26b 23b 42a 53a - - - -
(a) Expressed as peak areas, arbitrary scale. (b) Volatile compounds have been reported according to the order of elution on the column CP-WAX 52 CB column. (c) Not detected. (d) Different letters in the same row indicate statistically significant differences among mean values at P < 0.05 by Duncan’s multiple range test.
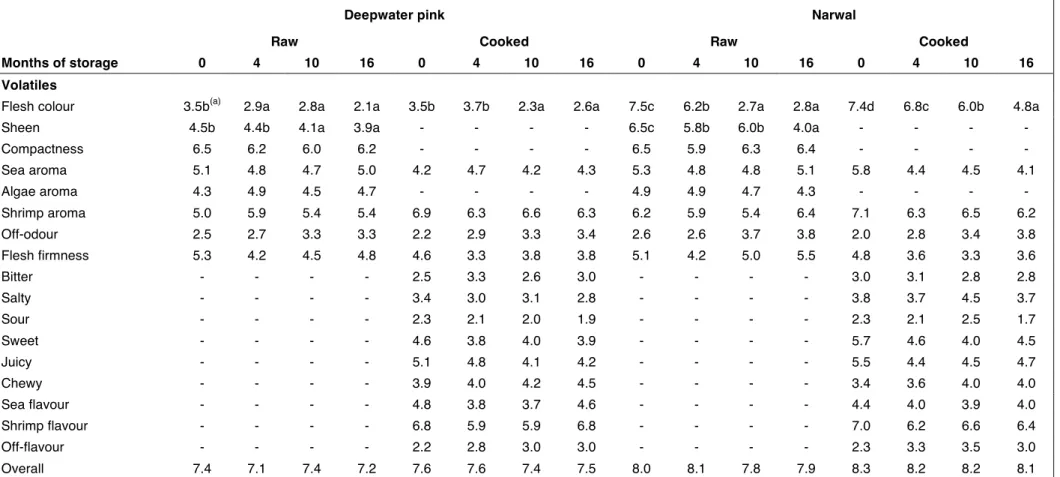
Table 3: Sensory scores of shrimp samples during frozen storage.
Deepwater pink Narwal
Raw Cooked Raw Cooked
Months of storage 0 4 10 16 0 4 10 16 0 4 10 16 0 4 10 16
Volatiles
Flesh colour 3.5b(a) 2.9a 2.8a 2.1a 3.5b 3.7b 2.3a 2.6a 7.5c 6.2b 2.7a 2.8a 7.4d 6.8c 6.0b 4.8a
Sheen 4.5b 4.4b 4.1a 3.9a - - - - 6.5c 5.8b 6.0b 4.0a - - - -
Compactness 6.5 6.2 6.0 6.2 - - - - 6.5 5.9 6.3 6.4 - - - - Sea aroma 5.1 4.8 4.7 5.0 4.2 4.7 4.2 4.3 5.3 4.8 4.8 5.1 5.8 4.4 4.5 4.1 Algae aroma 4.3 4.9 4.5 4.7 - - - - 4.9 4.9 4.7 4.3 - - - - Shrimp aroma 5.0 5.9 5.4 5.4 6.9 6.3 6.6 6.3 6.2 5.9 5.4 6.4 7.1 6.3 6.5 6.2 Off-odour 2.5 2.7 3.3 3.3 2.2 2.9 3.3 3.4 2.6 2.6 3.7 3.8 2.0 2.8 3.4 3.8 Flesh firmness 5.3 4.2 4.5 4.8 4.6 3.3 3.8 3.8 5.1 4.2 5.0 5.5 4.8 3.6 3.3 3.6 Bitter - - - - 2.5 3.3 2.6 3.0 - - - - 3.0 3.1 2.8 2.8 Salty - - - - 3.4 3.0 3.1 2.8 - - - - 3.8 3.7 4.5 3.7 Sour - - - - 2.3 2.1 2.0 1.9 - - - - 2.3 2.1 2.5 1.7 Sweet - - - - 4.6 3.8 4.0 3.9 - - - - 5.7 4.6 4.0 4.5 Juicy - - - - 5.1 4.8 4.1 4.2 - - - - 5.5 4.4 4.5 4.7 Chewy - - - - 3.9 4.0 4.2 4.5 - - - - 3.4 3.6 4.0 4.0 Sea flavour - - - - 4.8 3.8 3.7 4.6 - - - - 4.4 4.0 3.9 4.0 Shrimp flavour - - - - 6.8 5.9 5.9 6.8 - - - - 7.0 6.2 6.6 6.4 Off-flavour - - - - 2.2 2.8 3.0 3.0 - - - - 2.3 3.3 3.5 3.0 Overall 7.4 7.1 7.4 7.2 7.6 7.6 7.4 7.5 8.0 8.1 7.8 7.9 8.3 8.2 8.2 8.1
Since these branched aldehydes were not present in uncooked samples, their thermal generation could be presumed. Also 2,6-dimethylpyrazine has a thermal origin: in fact alkylpyrazines may be formed by the involvement of lipid oxidation products in Maillard reaction (HUANG et al., 1987) by heating of food at or above 100 °C. Alkylpyrazines, including methylpyrazine, 2,5- and 2,6-dimethylpyrazine have been detected in several cooked crustaceous, identified as having a roasted, nutty/meaty aromas in boiled crayfish and considered to contribute more to boiled rather than roasted odours in proteinaceous food (SPURVEY, 1998).
Other volatiles such as the 2-ethyl-1-hexanol were not identified in the cooked shrimps. Otherwise, as below reported 2-ethyl-1-hexanol, together with short-chain alcohols, contributes to the typical sweet aroma of raw shrimps (ALASALVAR et al., 1997).
As happened for the raw shrimps, both deepwater pink and narwal, the volatile profile of the cooked shrimps considered as a whole, remained almost stable at least until ten months of freezing storage.
Table 3 reports the results of sensory evaluation of raw and cooked deepwater pink and narwal shrimps. In particular, for the raw samples the descriptors were three for the appearance (colour of flesh, sheen, compactness) four for the aroma (shrimp, sea, algae, off odour) and one for the rheological properties (flesh firmness). Regarding the cooked shrimps four descriptors for the aroma (shrimp, sea, algae odour, off odour), three for the flavour (shrimp, sea, off flavour), one for the rheological properties (flesh firmness), four for the taste (bitter, salty, sour, sweet), one for the oral perception (juicy) and finally, one for the texture (chewy) were selected.
The analysis of variance applied to the sensory data showed statistically significant differences only for sensory scores linked to colour and sheen descriptors both for raw and cooked deepwater pink and narwal shrimps. This was in accordance with the colour analysis that showed colour changes during storage and with the volatile analysis that evidenced an increase in the amount of carotenoid degradation products. No statistically significant variation was observed for the “overall” descriptor up to sixteen month of frozen storage. The differences observed in chemical indices and volatile aroma constituents little influenced the sensory attributes of raw shrimp samples during the freezing storage. The same occurred for the sensory attributes of the samples cooked after different periods of freezing.
4. CONCLUSIONS
The main goal of this research was to evaluate the effect of freezing storage on the quality of deepwater pink shrimps and narwal shrimps. To this end, pH, TVB-N, colour analysis, volatile fraction analysis and sensory evaluation were carried out. The assessment of shrimp quality mainly considered the impact of the preservation method on the sensorial characteristics since they are major concerns of consumers. The chemical and chemical-physical data and the volatile profile, considered the most important parameter for shellfish flavour quality, evidenced slight variations during the freezing storage but were unable to affect the sensory quality as confirmed by the maintenance of high scores for the “overall quality” descriptor throughout the entire storage period. Our results demonstrate the maintenance of a good sensory quality during the considered period, therefore these two shrimp species could be of great economic interest if marketing as frozen products.
REFERENCES
Alam A. and Solberg C. 2009. Physical and sensory quality changes during freeze storage of black tiger shrimp (Penaeus monodon). Int. J. Sustain. Agr. 5: 24.
Alasalvar C., Quantick P.C. and Grigor J.M. 1997. Aroma compounds of fresh and stored mackerel. In Shahidi F, Cadwallader KR (eds) Flavour and lipid chemistry of seafoods, ACS Symposium Series 674, American Chemical Society, Washington DC, pp 39.
Baek H.H. and Cadwallader K.R. 1997. Character-impact aroma compounds of Crustaceans. In Shahidi F, Cadwallader KR (eds) Flavour and lipid chemistry of seafoods, ACS Symposium Series 674, American Chemical Society, Washington DC, pp 85.
Bak L.S., Jacobsen L. and Jørgensen S.S. 1999. Characterization of qualitative changes in frozen, unpeeled cold-water shrimp (Pandalus borealis) by static headspace gas chromatography and multivariate data analysis. Z. Lebensm. Unters. For. 208: 10.
Bhobe A.M. and Pai J.S. 1986. Study of the properties of frozen shrimps. J. Food Sci. Technol. 23: 143.
Bono, G., Okpala, C. O. R., Alberio, G. R., Messina, C. M., Santulli, A., Giacalone, G., and Spagna, G. 2016. Toward shrimp consumption without chemicals: Combined effects of freezing and modified atmosphere packaging (MAP) on some quality characteristics of Giant Red Shrimp (Aristaeomorpha foliacea) during storage. Food Chem. 197: 581. Boonsumrej S., Chaiwanichsiri S., Tantratian S., Suzuki T. and Takai R. 2007. Effects of freezing and thawing on the quality changes of tiger shrimp (Penaeus monodon) frozen by air-blast and cryogenic freezing. J. Food Eng. 80: 292. Cadun A., Cakli S. and Kisla D. 2005. A study of marination of deepwater pink shrimp (Parapenaeus longirostris, Lucas, 1846) and its shelf life. Food Chem. 90: 53.
Castell C.H., Neal W. and Smith B. 1970. Formation of dimethylamine in stored frozen sea fish. J. Fish Res. Board. Can. 27: 1685.
Chandrasekaran M. 1994. Methods for preprocessing and freezing of shrimps. A critical evaluation. J. Food Sci. Technol. 31: 441.
Chen H.E., Peng H.Y. and Chen B.H. 1995. Changes of carotenoids, colour and vitamin A contents during processing of carrot juice. J. Agric. Food Chem. 43: 1912.
Cobb B.F., Alaniz I. and Thompson C.A.Jr. 1973. Biochemical and microbial studies on shrimp: volatile nitrogen and amino nitrogen analysis. J. Food Sci. 38: 431.
EU. 1995. Commission Decision 95/149/EC of 8 March 1995 fixing the total volatile basic nitrogen (TVB-N) limit values for certain categories of fishery products and specifying the analysis methods to be used. Official Journal L097: 84. Holthuis L.B. 1980. FAO Species Catalogue Shrimps and prawns of the world. An annotated catalogue of species of interest to fisheries (Vol. 1). FAO Fisheries Synopsis, Roma.
Huang T.C., Bruechert L.J., Hartman T.G., Rosen R.T. and Ho C.T. 1987. Effect of lipids and carbohydrates on thermal generation of volatiles from commercial zein. J. Agric. Food Chem. 35: 985.
Iida H. 1988. Studies on the accumulation of dimethyl-β-propiothetin and the formation of dimethyl sulphide in aquatic organisms. Bull. Tokai Reg. Fish Res. Lab. 124: 35.
ISO 8589. 2007. Sensory analysis - General guidance for the design of test rooms. The International Organization for Standardization, Geneva, Switzerland.
Larkin T., Sackton J., Atluri S., Dresser B., Buckner E., Hoenig B., McIntosh R. and Weitzer A. 2015. Shrimp panel: factors
impacting the shrimp market in 2015. National Fisheries Institute.
http://www.intrafish.com/incoming/article1404952.ece/BINARY/Shrimp+Panel_GSMC2015.pdf Londahl G. 1997. Technological aspects of freezing and glazing shrimp. Infofish Int. 3:49.
Okpala, C.O.R. and Bono, G. 2016. Investigating the biometric and physicochemical characteristics of freshly harvested Pacific white shrimp (Litopenaeus vannamei): a comparative approach. J. Sci. Food Agric. 96: 1231.
Mandeville S., Yaylayan V. and Simpson B. 1992. GC/MS analysis of flavour-active compounds in cooked commercial shrimp waste. J. Agric. Food Chem. 40: 1275.
Massuti M. 1963. La pêche des Crustacés aux Baleares (Méditerrannée occidentale) et dans l′Atlantique sud (Golfe de Cadix). Débats et documents techniques/Conseil Général des Pêches pour la Méditerranée 7: 191.
Niamnuy C., Devahastin S., Soponronnarit S. and Raghavan G.S.V. 2008. Kinetics of astaxanthin degradation and colour changes of dried shrimp during storage. J. Food Eng. 87: 591.
Oehlenschläger J. 1997. Volatile amines as freshness/spoilage indicators. A literature review. In: Luten J., Borresen T., Oehlenschläger J. (eds) Seafood from producer to consumer, integrated approach to quality, Elsevier, Amsterdam pp 571.
Olaso I. 1990. Distribución y abundancia del megabentos invertebrado en fondos de la plataforma cantábrica. Madrid: Ministerio de Agricultura, Pesca y Alimentación, Secretaría General Técnica.
Ozoğul F. and Ozoğul Y. 2000. Comparison of methods used for determination of total volatile basic nitrogen (TVB-N) in rainbow trout (Onchorynchus mykiss). Turk. J. Zool. 24: 113.
Pan B.S. and Kuo J.M. 1994. Flavour of shellfish and kamaboko flavourants. In Shahidi F., Botta J.R. (eds) Seafood: chemistry, processing technology and quality, Blackie Academic & Professional, London, pp 85.
Riaz M. and Qadri R.B. 1990. Time-temperature tolerance of frozen shrimp 2. Biochemical and microbiological changes during storage of frozen glazed shrimps. Trop. Sci. 30: 343.
Rochat S., Egger J. and Chaintreau A. 2009. Strategy for the identification of key odourants: application to shrimp aroma. J. Chromatogr. A 36: 6424.
Shahidi F. 1994. Seafood proteins and preparation of protein concentrates. In: Shahidi F., Botta J.R. (eds) Seafood: chemistry, processing technology and quality, Blackie Academic & Professional, London, pp 3.
Schormuller J. 1968. Handbook of food chemistry. Vol. 3/1. Animal foods. Milk, butter, cheese. Handbuch der Lebensmittelchemie. Band III/1. Tierische Lebensmittel. Milch, Butter, Kase.
Spurvey S., Pan B.S. and Shahidi F. 1998. Flavour of shellfish. In: Shahidi F., (ed) Flavour of Meat, Meat Products and Seafood, 2nd edn. Blackie Academic & Professional, London, pp 159.
Thessalou-Legaki M. 1992. Reproductive variability of Parapandalus narval (Crustacea Decapoda) along a depth gradient. Estuar. Coast Shelf S 35: 593.
Tsironi T., Dermesonlouoglou E., Giannakourou M. and Taoukis P. 2009. Shelf-life modelling of frozen shrimp at variable temperature conditions. LWT-Food Sci. Technol. 42: 664.
UNI 10957. 2003. Analisi sensoriale - Metodo per la definizione del profilo sensoriale degli alimenti e bevande. Ente Nazionale Italiano di Certificazione, Milano, Italia.
Van den Dool H. and Kratz P.D. 1963. A generalization of the retention index system including linear temperature programmed gas-liquid partition chromatography. J. Chromatogr. 11: 463.
Varlık C., Baygar T., Özden Ö., Erkan N. and Metin S. 2000. Sensory evaluation and determination of some physical and chemical characteristics of shrimp during cold storage. Turk. J. Vet. Anim. Sci. 24: 181.
Yamagata M. and Low L.K. 1995. Babana shrimp, Penaeus merguiensis, quality changes during iced and frozen storage. J. Food Sci. 60: 721.