Climate-driven introduction of the Black Death and
successive plague reintroductions into Europe
Boris V. Schmida,1, Ulf Büntgenb,c,d, W. Ryan Easterdaya, Christian Ginzlerb, Lars Walløee, Barbara Bramantia, and Nils Chr. Stensetha,1
aCentre for Ecological and Evolutionary Synthesis, Department of Biosciences, University of Oslo, NO-0316 Oslo, Norway;bDendroecology, Landscape Dynamics, Swiss Federal Research Institute for Forest, Snow and Landscape, CH-8903 Birmensdorf, Switzerland;cOeschger Centre for Climate Change Research, University of Bern, CH-3012 Bern, Switzerland;dGlobal Change Research Centre AS CR, v.v.i., CZ-60300 Brno, Czech Republic; andeDepartment of Physiology, Institute of Basic Medical Sciences, University of Oslo, NO-0372 Oslo, Norway
Edited by Kenneth W. Wachter, University of California, Berkeley, CA, and approved January 28, 2015 (received for review July 9, 2014)
The Black Death, originating in Asia, arrived in the Mediterranean harbors of Europe in 1347 CE, via the land and sea trade routes of the ancient Silk Road system. This epidemic marked the start of the second plague pandemic, which lasted in Europe until the early 19th century. This pandemic is generally understood as the consequence of a singular introduction of Yersinia pestis, after which the disease established itself in European rodents over four centuries. To locate these putative plague reservoirs, we studied the climate fluctuations that preceded regional plague epidemics, based on a dataset of 7,711 georeferenced historical plague out-breaks and 15 annually resolved tree-ring records from Europe and Asia. We provide evidence for repeated climate-driven rein-troductions of the bacterium into European harbors from reser-voirs in Asia, with a delay of 15 ± 1 y. Our analysis finds no support for the existence of permanent plague reservoirs in medieval Europe.
Yersinia pestis
|
medieval epidemiology|
climate-driven disease dynamicsP
lague, caused by Yersinia pestis (1, 2), remains infamous in today’s culture largely due to the Black Death of 1347–1353, which decimated the human population in Europe. Because plague is primarily a zoonotic disease of wild rodents (3), it has generally been assumed that upon arrival of the Black Death from Asia into Europe, the bacterium established itself in European wildlife or urban rodent reservoirs (4–6). From these reservoirs, the disease would have caused outbreaks in humans until the bacterium disappeared from Europe in the early 19th century. The aim of this study was to locate these plague res-ervoirs with the aid of medieval climate proxies, under the provision that, like many contemporary plague foci worldwide in a variety of ecosystems (7), past reservoirs were sensitive to climate fluctuations.The dynamics of plague in wildlife rodents and its spillover to humans are well understood for some of the plague foci in Central Asia (8). Plague prevalence among great gerbils (Rhombomys opimus) in Kazakhstan is strongly positively affected by warmer springs and wetter summers (9), and correlates with the pop-ulation density of the gerbils and fleas themselves (10). When climatic conditions uniformly affect large geographic areas, they can synchronize gerbil densities at the regional scale (11) in a process known as the Moran effect (12, 13). Such a climate-driven synchronization of high rodent densities further facilitates the percolation of plague across the region (14). As gerbil populations collapse in response to climatic changes, the density of fleas per gerbil increases dramatically, further facilitating the spread of plague across the rodent population (15) and causing fleas to seek out alternative hosts, including humans and their domestic animals (8).
Today’s Europe has no known plague foci, except at its south-eastern border near the Caspian Sea. Its climate is more humid than the climates of most modern plague foci (7), and its putative medieval plague reservoirs need not necessarily have responded to
climate fluctuations in the same way as the modern plague foci. Nevertheless, rodent disease reservoirs in Europe, such as han-tavirus in bank voles (16), are responsive to climate fluctuations in comparable ways to plague foci, with outbreaks following periods of warm and/or wet conditions that are favorable for vegetation growth, and thus for increases in rodent population density (reviewed in ref. 17). Tree-ring–based climate proxies, which reflect the annual conditions for vegetation growth, would therefore appear to be a suitable choice for detecting rela-tionships between putative plague foci in Europe and climate fluctuations.
Results
We combined a record of 7,711 georeferenced historical plague outbreaks, with 15 tree-ring–based climate proxies from across Europe and Asia (details of which are provided in Fig. S1
and Table S1). All tree-ring chronologies were developed to emphasize interannual high-frequency variability, so as to preserve the year-to-year information that would be most relevant to studying rapid expansion and collapse in rodent populations. To identify regional plague outbreaks that could be related to nearby climate-sensitive plague reservoirs, we selected outbreaks that oc-curred after the Black Death (which was the event that supposedly
Significance
The second plague pandemic in medieval Europe started with
the Black Death epidemic of 1347–1353 and killed millions
of people over a time span of four centuries. It is commonly thought that after its initial introduction from Asia, the dis-ease persisted in Europe in rodent reservoirs until it eventually disappeared. Here, we show that climate-driven outbreaks of Yersinia pestis in Asian rodent plague reservoirs are signifi-cantly associated with new waves of plague arriving into Europe through its maritime trade network with Asia. This association strongly suggests that the bacterium was contin-uously reimported into Europe during the second plague pandemic, and offers an alternative explanation to putative European rodent reservoirs for how the disease could have persisted in Europe for so long.
Author contributions: B.V.S. designed research; B.V.S. and U.B. performed research; B.V.S., U.B., W.R.E., L.W., B.B., and N.C.S. analyzed data; B.V.S., U.B., W.R.E., L.W., B.B., and N.C.S. wrote the paper; C.G. contributed the plague dataset; B.V.S., U.B., and C.G. compiled and merged the plague and/or climate datasets; W.R.E. compiled the map of current plague foci; and B.V.S., U.B., W.R.E., L.W., B.B., and N.C.S. provided the theoretical, genetic, and historical interpretation.
The authors declare no conflict of interest. This article is a PNAS Direct Submission.
Freely available online through the PNAS open access option.
1To whom correspondence may be addressed. Email: [email protected] or n.c. [email protected].
This article contains supporting information online atwww.pnas.org/lookup/suppl/doi:10. 1073/pnas.1412887112/-/DCSupplemental.
seeded the reservoirs) and within 500 km from the center of a cli-mate proxy. Of the 4,119 outbreaks thus selected, we excluded outbreaks that could likely be due to reasons other than a local reservoir by stipulating that, in a radius of 1,000 km around the center of the climate proxies, no plague should have occurred in the 2 y before. Under these fairly strict settings, 24 outbreaks distrib-uted over 19 towns came up as possibly associated with wildlife plague reservoirs. This finding highlights that most plague out-breaks in Europe can easily be attributed to other plague outout-breaks in the vicinity. In addition, eight of these 24 outbreaks could easily be traced back to historically documented maritime imports of plague from other cities (18, 19), leaving just 16 outbreaks of in-terest. A detailed analysis of the regional climate preceding these 16 plague outbreaks in Europe revealed no significant patterns that could be associated with a climate-sensitive reservoir of plague in the local wildlife (Figs. S2andS3and discussion inSI Text).
That the maritime import of plague played an important role in regionally reintroducing plague in Europe is most evident in the widespread practice during the second plague pandemic of isolating ships before unloading their cargo (from which the concept of quarantine has originated). The black rat,Rattus rattus, likely played a role in maintaining plague outbreaks on ships, as well as importing plague into harbors, but its role as a potential plague reservoir in Europe is rather questionable (6, 20). We investigated the role of maritime plague imports in more detail by searching for plague outbreaks in harbors that were not preceded by plague outbreaks in the 2 y prior in the city itself, in other nearby cities (<500 km), or in nearby harbors (<1,000 km). This approach allowed us to detect plague outbreaks that stood at the beginning of a chain of maritime transmissions of plague, such as observed during the Black Death (21). Our search resulted in 61 potential maritime introductions, occurring in 17 of the 46 main trade harbors of Europe in 60 distinct years between 1346 and 1859 (Fig. 1). The large majority of these 17 harbors were located along the eastern and southern Mediterranean coast, and along the Black Sea coast. They were part of the maritime networks that connected Europe to the overland trading routes to Asia (22). Because many of these overland trading routes passed through
locations that are now known as the Asian plague foci (seeFig. S1
and Fig. 4), we focused on whether the predecessors of these plague foci could have been a source of maritime reintroductions of plague into Europe.
We narrowed down which of the 60 distinct years of potential maritime introductions would more likely be due to a wave of plague coming from Asian rodent reservoirs, similar to the way in which the Black Death entered Europe, rather than from plague entering the maritime network from putative local res-ervoirs. The Black Death moved from southern Russia in 1345 to Kaffa on the Crimea in 1346, and from there to Constantinople and later Messina in 1347, reaching the European mainland harbors in early 1348 (21). To create a subset of maritime introductions that followed the path of the Black Death, we selected only those maritime introduction years that followed within 5 y of a new episode of plague outbreaks in southern Russia or the Caucasus, using the regional dataset of plague outbreaks in the Middle East compiled by Dols (23). “New episodes of plague outbreaks” are defined as plague outbreaks that were not preceded by other recorded plague outbreaks in those regions in the 2 y before. This selection procedure resulted in a shortlist of 16 y of potential reintroductions of plague from Asia into Europe: 1346, 1408, 1409, 1689, 1693, 1719, 1730, 1737, 1757, 1760, 1762, 1780, 1783, 1828, 1830, and 1837 (details are available inTable S2). This list is likely incomplete, because we can epidemiologically only detect harbor reintroductions of plague when there are no plague outbreaks still circulating nearby from a previous introduction of the disease. These 16 potential reintroductions of plague into Europe were analyzed against the climate fluctuations in six tree-ring–based climate proxies from Central Asia to establish whether these reintro-ductions were associated with plague-relevant climate fluctuations in Asia. The six tree-ring records are located along the trading routes of Central Asia to Europe, and border the Chinese plague foci in which the closest phylogenetic matches to the ancient DNA plague strains of the first and second pandemics have been found (2, 24). Most of these Asian climate proxies are derived from ju-niper trees, growing on high-elevation sites (2,900–3,900 m) in mountainous regions. At these elevations, the dominant rodent reservoirs of plague are the long-tailed ground squirrels (Spermophilus undulatus) and the Altai marmots (Marmota baibacina) (25).
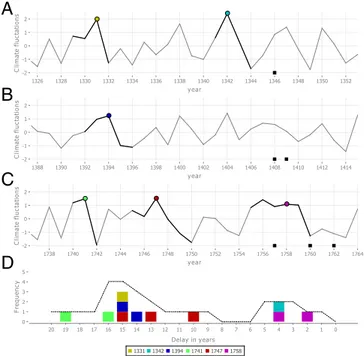
We used a permutation test to evaluate whether the 16 po-tential plague reintroduction years were preceded more often by a plague-relevant climate fluctuation in Asia than one would expect if there were no relationship between the two. To do so, we first defined plague-relevant climate fluctuations as being periods of above-average conditions for tree-ring growth, fol-lowed by a continuous decline in conditions (based on the lit-erature described in the Introduction). Because we have no prior information on the minimal size of above-average conditions and declines in the tree-ring records that would correspond to large-scale plague outbreaks in rodent plague foci, we explored a range of thresholds. Second, we translated these plague-relevant cli-mate fluctuations (which have a duration in years) to clicli-mate events, based on the defining year of the fluctuation (the year of transitions from the above-average period to the declining phase), and then determined the most common interval between climate events and reintroduction years for climate events that precede plague reintroductions by ≤20 y. An example of this process is shown in Fig. 2. The test statistic of our permutation test was the highest aggregation of climate events that preceded the reintroduction years by a particular interval in years (±1 y, to allow for some temporal variation in the time needed to trans-port the disease from Asia to Europe). The random expectation was calculated by applying the test statistic to 50,000 sets of 16 randomized reintroduction years that were no more clustered in time than the original set of 16 reintroduction years (up to Fig. 1. Plague outbreaks in maritime harbors of Europe not related to
nearby land-based or maritime harbor outbreaks. Plague outbreaks in the important harbors of medieval Europe (black circles) that were not preceded by land-based outbreaks in a radius of<500 km or maritime harbor out-breaks in harbors<1,000 km away in the 2 y prior are shown. The gray circles in the backdrop show the spatial extent of the entire plague dataset, with the circle size indicating the recorded number of plague outbreaks per city over four centuries. Maritime trade routes are indicated as blue lines, land-based trade routes connecting Europe to Asia are indicated as brown lines, and the locations of modern wildlife plague foci are indicated in orange.
ECO
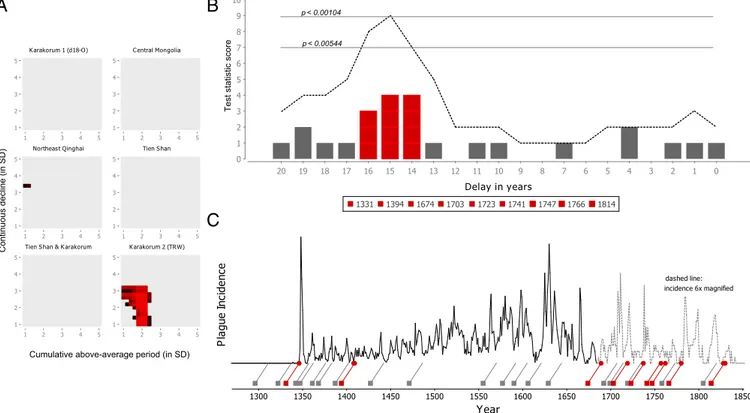
intervals between reintroduction years of 50 y). We discuss the methodology and rationale for the translation from climate fluctuations to climate events, the permutation test statistic, and the randomization approach in more detail inMethods andSI Text. For one of the six Asian climate proxies, namely, the high-altitude, long-living junipers in the Karakorum mountain range in northern Pakistan, we find that climate events consistently preceded plague reintroductions into Europe by 15± 1 y for a large range of thresholds (Fig. 3A and detailed inFig. S4). The other climate proxies yielded no significant results at a threshold of P < 0.05, or in the case of the Northeast Qinghai climate proxy, borderline significant results for two threshold combina-tions. It is possible that these nonsignificant climate proxies re-flect the climate in regions of Asia that are not representative of the rodent plague reservoirs responsible for the Black Death and subsequent reintroductions of the disease. In the case of the Karakorumδ18O climate proxy, sampled in a location near the Karakorum 2 climate proxy, the reason might be that itsδ18O measurements reflect local precipitation rather than primary pro-duction (i.e., tree-ring growth) in that locale. Within the Karakorum 2 tree-ring width (TRW) climate proxy, nine climate events with a minimum above-average period of 1.8–2.2 SDs, followed by a min-imum continuous decline of 1–1.4 SDs, preceded 11 of the 16 re-introduction years, with a statistical significance of up to P < 0.00104 (Fig. 3B). Other significant threshold combinations in this climate proxy consisted predominantly of higher thresholds for the
continuous decline (up to≥3.2 SDs), but at the cost of including fewer plague reintroduction years. For all significant threshold settings, the most significant delay between climate events and reintroductions was 15± 1 y. The set of 16 potential reintro-duction years is likely not exhaustive, because new plague rein-troductions in Europe’s harbors are difficult to detect in years when plague was still widely present in Europe. Climate events with the aforementioned thresholds occurred 28 times in the Karakorum mountain range between 1250 and 1850 CE (Fig. 3C), although notably less so between 1400 and 1550 CE.
We analyzed the spatial extent of these nine climate events by making use of the Monsoon Asia Drought Atlas (26). Fig. 4 shows the average difference between the drought index score at the onset of the decline for these nine climate events and the drought index score 2 y later, with red grid-squares of higher intensities indicating a larger decline toward a drought. Although in the high-altitude juniper climate proxy of the Karakorum, TRW variation is predominantly determined by annual and warm-season temperature variation (Table S1), the spatial extent of the climate events recorded in this climate proxy is not limited to the Karakorum mountain range but covers a large part of Central Asia, overlapping many trade routes and modern plague foci. Discussion
Our findings support a scenario where climate fluctuations that positively affect tree-ring growth in the juniper trees in the Karakorum mountains range also affect climate in a larger re-gion in a way that can promote and synchronize plague outbreaks among the rodent populations of Central Asia (11, 14). When the climate subsequently becomes less favorable, it facilitates the collapse of plague-infected rodent populations, forcing their fleas to find alternative hosts (8). Such large-scale wildlife plague outbreaks in Asia would, during the time of the second plague pandemic, frequently result in the arrival of plague in European harbors with a delay of 15± 1 y (Fig. 3). We propose that this delay should be broken down into three stages, as detailed in Fig. 4. The longest stage is the second stage, in which the disease is transported across ∼4,000 km from the mountains of western Central Asia to the coast of the Black Sea. The distance covered in 10–12 y indicates a transport rate of ∼333–400 km·y−1, which falls between the rate at which plague spread during the third pandemic in China [median of 123 km·y−1(27)] and during the Black Death in Europe [median of 1,330 km·y−1(28)]. Although the mode of transmission is currently unknown, a plausible suggestion is that caravans passing through Asian plague foci were responsible for transporting plague between Asia and Europe: camels are known to become infected relatively easy from infected fleas in plague foci, and can transmit the disease to humans (29). After a plague infection established itself in a car-avan (in its animals, in the traders, or in fleas in its cargo), the disease could have spread to other caravans in caravanserai (car-avan gathering and resting places), where goods and animals were redistributed and transported across Eurasian trade routes. Such a postulated mechanism has recently been discussed (30), and does come with several conditions that bear further investigations.
We have found no evidence supporting the existence of a cli-mate-sensitive wildlife plague reservoir in medieval Europe. If such a reservoir has never existed (4), it would resolve the co-nundrum of why wildlife plague foci would have disappeared from Europe after the early 19th century (with the exception of the plague reservoirs near the southeastern Caucasus border of Europe) yet continued to be present in Asia, Africa, and the Americas. The nonexistence of a European wildlife reservoir of plague does raise the question of the means by which the disease could transiently persist in Europe between reintroductions from Asia (Fig. 3C). A plausible mechanism, suggested by Ell (4) in 1984, is that plague could have persisted solely by circulating between cities and villages, revisiting them as their population of
A
B
C
D
Fig. 2. Example of climate fluctuations, climate events, and the calculation of the permutation test statistic. (A–C) Karakorum TRW climate proxy, highlighting in bold those climate fluctuations of an above-average period of≥2.2 SDs, and a continuous decline of ≥1.4 SD, in the years before six potential plague reintroductions into Europe (▪). These climate fluctuations are translated to discrete single-year climate events by the start of their continuous decline (colored circles). (D) Plotting all of the possible intervals (≤20 y) between the six climate events and the six potential reintroduction years in A–C in a single histogram shows the most common interval between climate events and plague reintroduction years, which, in this case, is 15 y (three occurrences). To allow for some variation in the time it takes for plague to travel from Asia to Europe, the unique number of climate events that occurred at a particular delay±1 y is calculated (dashed line). The permutation test statistic is then the highest value that the dashed line reaches. In this example, the test statistic score is therefore 4 (consisting of the years 1331, 1394, 1741, and 1747), which is reached both for a delay of 15± 1 y and 16 ± 1 y.
susceptible individuals recovered from earlier outbreaks. Alter-natively, it has been proposed that black rats played an important role as an urban reservoir of plague in those harbor cities with a substantial black rat population (6). The importance of the black rat (R. rattus) and its fleas in the transmission of plague in medieval European plague is disputed, because rats were absent in large areas of northern Europe during the second plague pandemic (5, 20). In addition, plague outbreaks often peaked in the hot summers of the Mediterranean (31, 32), as well as in the cool autumns of the southern Baltic states (33), which cor-responds poorly to the temperature- and humidity-sensitive peak abundance of the arthropod vectors of plague (i.e., the rat fleas Xenopsylla cheopis and Nosopsyllus fasciatus) (31). The average autumn temperature of∼7 °C (34, 35) in the southern Baltic states would have seriously impaired the early-phase plague transmission capability of X. cheopis (36, 37), hampering the quick dissemination of the disease. It seems therefore more likely that plague spread through Europe in a variety of ways, as it did in India during the third plague pandemic. In India, the disease was documented to spread from person to person, by infected goods, and through rats (38) [although in medieval Europe, the latter mode of transmission might have been limited to the spread of plague by ship (5, 20, 39)]. Likewise, plague transported overland from western Central Asia to the Black Sea would have been exposed to a large range of temperatures, and might depend on a similarly complex chain of transmission.
Altogether, this study provides a different perspective on the long-range transmission of Y. pestis across Eurasia, shifting it
from a single introduction doctrine at the time of the Black Death to a climate-driven intermittent pulse of new strains ar-riving from wildlife rodent plague reservoirs in Asia. Whether this perspective is correct will become apparent from the analysis of
p < 0.00104 p < 0.00544
A
B
C
Fig. 3. Climate events in the Karakorum 2 (TRW) tree-ring record preceded European plague reintroductions by 15± 1 y. (A) Only the TRW record of the Karakorum mountain range results has climate fluctuations that result in significant (P< 0.05) permutation test scores for a large range of above-average periods and continuous declines tested (1–5 SDs). Colors represent the degree of significance, ranging from P < 0.05 (black) to P < 0.0005 (brightest red). (B) The threshold combination for which most reintroduction years were associated with climate events for a particular delay±1 y is at a cumulative above-average period of≥2.2 SD and a decline ≥1.4 SD (P < 0.00104): 11 of the reintroduction years were preceded by climate events at 15 ± 1 y. The plague reintroduction years in 1408 and 1409 map back to a single climate event in 1394, and the plague reintroduction years in 1828 and 1830 map back to a single climate event in 1814, thus reducing the 11 reintroductions to nine unique climate events. The dashed line indicates the permutation test statistic score (i.e., the number of unique climate events at a particular delay± 1 y), and the two horizontal lines indicate P values associated with test statistic scores of 7 and 9, respectively. (C) Temporal distribution of these climate events during the second pandemic (squares, red when one of the nine climate events listed in B) and their relation to the plague incidence in Europe 15 y later (slanted lines).
Fig. 4. Schematic of the process of plague reintroductions into Europe. A new reintroduction of plague consists of three stages, namely, a rodent population crash (1–2 y) after the onset of the decline in climatic conditions, transport of the disease to Europe (10–12 y), and the spread of the disease through the European maritime trade network (<3 y). The average spatial extents of the nine climate fluctuations that were found to correlate with plague reintro-ductions in Europe are shown as red squares, showing the difference in the Monsoon Asia Drought Atlas (26) between the onset of the decline in the cli-mate fluctuation and 2 y later. Also shown are the relevant trade routes (brown and blue lines), known wildlife plague reservoirs (orange), and the European harbors associated with new maritime introductions of plague (gray circles).
ECO
ancient DNA of Y. pestis from plague victims throughout the second plague pandemic (1, 24, 40).
Methods
Plague Outbreaks. The majority of the plague outbreak data are derived from the seminal work of Biraben (41) in 1976. This extensive list of plague out-breaks in medieval Europe has been partially digitized at least twice (42, 43). We merged these digital versions, letting the peer-reviewed version of Büntgen et al. (43) take precedence when there was disagreement on the geographic coordinates of a town. We further expanded this dataset by georeferencing data on plague outbreaks in Russia (44, 45), Constantinople (46, 47), and Turkey (47), using GeoHack, Wikipedia, and Google maps to georeference the listed places. We discarded entries that did not define a town but merely referred to regions. A link to the complete dataset is provided inSI Text.
Climate Proxies. A total of 15 tree-ring datasets (nine from Europe and six from Asia) were used in this study. All of these datasets cover the time span of the second plague pandemic. Subsequent standardization and chronology development steps were chosen to preserve interannual high-frequency variability, relevant to studying rapid expansions and collapses in rodent populations over time. For all nine European datasets for which we had access to the raw TRW measurement series, we removed nonclimatic, biologically induced growth trends (so-called“age trends”) from the raw TRW mea-surements by applying cubic smoothing splines with a 50% frequency-response cutoff at 20 y (48). This method rigorously removes any low-frequency in-formation from the time series. For tree-ring index calculation, residuals after power transformation were individually calculated between the orig-inal measurements and their corresponding curve fits (49). The forig-inal chro-nologies were calculated using a biweight robust means, and their variance was stabilized using methods introduced by Osborn et al. (50) and improved by Frank et al. (51). These methods include a time-dependent“100-y mov-ing window” approach for adjusting temporal changes in both sample replication and interseries correlation. To achieve comparable records for the six Asian datasets that have equal time series characteristics and similar color spectra, we used 20-y cubic smoothing splines to high-pass-filter the original mean chronologies provided by the authors of the corresponding publications (Table S1). Variance stabilization, as used for the European chronologies and described above, was further performed. All 15 high-frequency tree-ring chronologies were finally normalized (i.e., z-scores with a mean of 0 and an SD of 1 were calculated over the common period). A link to the complete dataset is provided inSI Text.
Trade Routes. The maritime trade routes and harbors shown in the various figures are a combination of the maritime part of the main trading routes of Europe dataset from Evans (22) and the Venetian galley route dataset from Spufford, (52), both of which are digitized and available online at the Old World Trade Routes project (53). To the list of maritime harbors provided by these two sources, the harbor of Izmir (Smyrna) was added because plague was frequently reintroduced to that harbor by sea during the early modern period (23), when it was one of the main harbors of the Ottoman Empire (54). The overland-based trade routes are from the Silk Road routes dataset from the Historical Atlas of Eurasia, third edition, compiled by Gross (55). In addition to these trade routes, the Horse and Tea Road trade route is in-cluded. We noted the coincidence of the coarsely defined Tea Road pre-sented by Cui et al. (24) and a modern highway, and use the latter as a more detailed approximation of this trade route. Although we put effort into comparing different trade route datasets, it should be evident that the trade routes included in our figures should not be regarded as authoritative.
Known Plague Foci. The location of known plague foci in Eurasia and Northern Africa were, as far as available, acquired from scientific and public health literature. Not all of these plague foci are currently active, but all have been active in the recent past. A keyhole markup language data file of these plague foci, with the individual references, is provided in a link to the complete dataset inSI Text.
Statistical Testing. We used a permutation test to calculate whether plague-relevant climate fluctuations in Asian climate proxies preceded reintro-ductions of plague into Europe by a particular interval in years. Permutation testing gave us the flexibility to design a test statistic that (i) is not very sensitive to missing reintroductions (new reintroductions of plague would have been hard to detect from the outbreak record in years when plague
was still highly prevalent in Europe); (ii) can deal with a situation where it is not clear which climate event corresponds to which putative plague rein-troduction, due to climate events and plague reintroductions interleaving (as in Fig. 2); and (iii) can handle some temporal variation in the time it takes for plague to traverse from Asia to Europe. We describe here the details of the permutation test.
First, our plague-relevant climate fluctuations were defined as periods of above-average conditions for tree-ring growth, followed by a continuous decline in conditions (for reasons detailed in the Introduction). Because we had no a priori understanding of what minimal size of the above-average period and the continuous decline in tree-ring records would translate to plague outbreaks in various nearby rodent populations, we explored a number of minimal thresholds for both parameters, in the range of 1–5 SDs (SDs of the relative TRW in these stabilized tree-ring records), stepping through them in steps of 0.2 SD.
Second, we translated these climate fluctuations to climate events to be able to describe the interval between the fluctuation and the reintroduction of plague in terms of years. We chose to use the year when climate fluctu-ations shift from their above-average period into the continuously declining phase. The decline in primary production in vegetation is assumed to lead to a decline in the rodent population, which, in turn, causes fleas to crowd on the remaining rodents (15) and seek out secondary hosts (8). We therefore consider this transition year the defining year of the climate fluctuation for plague transmission to humans and their animals. Note that we could also use as a definition the year after the decline has started, because doing so just shifts the climate event year in an identical fashion for all climate fluc-tuations, and thus gives the same results. The results of Fig. 3 are robust to changes in the way we translate climate fluctuations to climate events. We explore the robustness of the results in detail inFigs. S5andS6andSI Text.
Third, we applied a permutation test. A permutation tests consists of two components, namely, the randomization of the observed data and a test statistic by which both the observed data and the randomized datasets are scored. The P value of the permutation test is then the fraction of randomized datasets that have an equal or higher test statistic score than the observed data has. In technical terms, we resampled the absence or presence of plague reintroductions in the time frame 1330–1850 CE, and determined all of the possible intervals by which climate events preceded plague reintroductions by≤20 y. We applied as a test statistic the highest aggregation of unique climate events that occurred at a particular in-terval of±1 y within those 20 y (Fig. 2D). The criterion for unique climate events was added so that potential reintroduction years that are only 1 or 2 y apart are not contributing twice to the test statistic score if they are both referring to the same climate event (Fig. 2B). We created 50,000 randomized sets of plague reintroductions by resampling the reintro-duction years across the time frame 1330–1850 CE, while excluding resampled datasets whose reintroduction years followed more closely upon each other than in the observed 16 reintroduction years, for inter-vals between sequential years of up to 50 y. This approach in randomi-zation is necessary to avoid overestimating the significance of the observed data, because climate events cannot occur at very short intervals from each other (because they are derived from multiyear nonoverlapping climate fluc-tuations), and resampled datasets with many reintroduction years at short intervals from each other would otherwise have a lower average test statistic score. We look with more detail at the distribution of the reintroduction years inFig. S7andSI Textbut find no significant nonrandom distribution or periodicity in the reintroduction years.
Spatial Extent of Climate Events. The spatial extent that the nine climate events in the climate proxy of western Central Asia covered was estimated by making use of a gridded paleoclimatic drought index, the Monsoon Asia Drought Atlas of Cook et al. (26). Fig. 4 shows in red those grid-squares where the difference between the starting years of these nine climate events minus the drought index score 2 y later indicates a decline in pre-cipitation levels. The intensity of the red squares indicates the amplitude of the change toward drought.
ACKNOWLEDGMENTS. We thank Mark Achtman, Elisabeth Carniel, and Øle Christian Lingjærde for their valuable comments. We thank the editor and reviewers for their contributions in improving the quality of the paper. The projects leading to this publication have received funding from the Seventh Framework Programme as Marie Curie IEF 302329 and from the European Research Council under the European Union’s Horizon 2020 Research and Innovation Program (Grant 324249).
1. Haensch S, et al. (2010) Distinct clones of Yersinia pestis caused the black death. PLoS Pathog 6(10):e1001134.
2. Harbeck M, et al. (2013) Yersinia pestis DNA from skeletal remains from the 6(th) century AD reveals insights into Justinianic Plague. PLoS Pathog 9(5):e1003349. 3. Stenseth NC, et al. (2008) Plague: Past, present, and future. PLoS Med 5(1):e3. 4. Ell SR (1984) Immunity as a factor in the epidemiology of medieval plague. Rev Infect
Dis 6(6):866–879.
5. Davis DE (1986) The scarcity of rats and the Black Death: An ecological history. J Interdiscip Hist 16(3):455–470.
6. Keeling MJ, Gilligan CA (2000) Metapopulation dynamics of bubonic plague. Nature 407(6806):903–906.
7. Ben-Ari T, et al. (2011) Plague and climate: Scales matter. PLoS Pathog 7(9):e1002160. 8. Samia NI, et al. (2011) Dynamics of the plague-wildlife-human system in Central Asia are controlled by two epidemiological thresholds. Proc Natl Acad Sci USA 108(35): 14527–14532.
9. Stenseth NC, et al. (2006) Plague dynamics are driven by climate variation. Proc Natl Acad Sci USA 103(35):13110–13115.
10. Reijniers J, et al. (2012) A curve of thresholds governs plague epizootics in Central Asia. Ecol Lett 15(6):554–560.
11. Kausrud KL, et al. (2007) Climatically driven synchrony of gerbil populations allows large-scale plague outbreaks. Proc Biol Sci 274(1621):1963–1969.
12. Hudson PJ, Cattadori IM (1999) The Moran effect: A cause of population synchrony. Trends Ecol Evol 14(1):1–2.
13. Koenig WD (2002) Global patterns of environmental synchrony and the Moran effect. Ecography 25(3):283–288.
14. Davis S, Trapman P, Leirs H, Begon M, Heesterbeek JAP (2008) The abundance threshold for plague as a critical percolation phenomenon. Nature 454(7204):634–637. 15. Reijniers J, Begon M, Ageyev VS, Leirs H (2014) Plague epizootic cycles in Central Asia.
Biol Lett 10(6):pii: 20140302.
16. Tersago K, et al. (2009) Hantavirus disease (nephropathia epidemica) in Belgium: Effects of tree seed production and climate. Epidemiol Infect 137(2):250–256. 17. Semenza JC, Menne B (2009) Climate change and infectious diseases in Europe. Lancet
Infect Dis 9(6):365–375.
18. Granville AB (1825) A. B. Granville’s letter on the quarantine bill. The Pamphleteer (Sherwood and Co., London), Vol 25, pp 393–403.
19. Devaux CA (2013) Small oversights that led to the Great Plague of Marseille (1720-1723): Lessons from the past. Infect Genet Evol 14:169–185.
20. Hufthammer AK, Walløe L (2012) Rats cannot have been intermediate hosts for Yersinia pestis during medieval plague epidemics in Northern Europe. J Archaeol Sci 40(4):1752–1759.
21. Wheelis M (2002) Biological warfare at the 1346 siege of Caffa. Emerg Infect Dis 8(9): 971–975.
22. Evans J (1967) The Flowering of the Middle Ages (The Great Civilizations) (Thames & Hudson Ltd, London).
23. Dols MW (1979) The second plague pandemic and its recurrences in the Middle East: 1347-1894. J Econ Soc Hist Orient 22(2):162–189.
24. Cui Y, et al. (2013) Historical variations in mutation rate in an epidemic pathogen, Yersinia pestis. Proc Natl Acad Sci USA 110(2):577–582.
25. Li Y, et al. (2008) Different region analysis for genotyping Yersinia pestis isolates from China. PLoS ONE 3(5):e2166.
26. Cook ER, et al. (2010) Asian monsoon failure and megadrought during the last mil-lennium. Science 328(5977):486–489.
27. Lei X, et al. (2014) Wet climate and transportation routes accelerate spread of human plague. Proc R Soc Lond B Biol Sci 281(1780):1–9.
28. Christakos G, Olea RA, Yu H-L (2007) Recent results on the spatiotemporal modelling and comparative analysis of Black Death and bubonic plague epidemics. Public Health 121(9):700–720.
29. Fedorov VN (1960) Plague in camels and its prevention in the USSR. Bull World Health Organ 23:275–281.
30. Benedictow OJ (2013) Yersinia pestis, the bacterium of plague, arose in East Asia. Did it spread westwards via the Silk Roads, the Chinese maritime expeditions of Zheng He,
or over the vast Eurasian populations of sylvatic (wild) rodents? Journal of Asian History 47(1):1–31.
31. Cohn SK, Jr (2008) Epidemiology of the Black Death and successive waves of plague. Med Hist Suppl (27):74–100.
32. Welford MR, Bossak BH (2009) Validation of inverse seasonal peak mortality in me-dieval plagues, including the Black Death, in comparison to modern Yersinia pestis-variant diseases. PLoS ONE 4(12):e8401.
33. Braun F (2004) Städtesystem und Urbanisierung im Ostseeraum in der frühen Neuzeit: Wirtschaft, Baukultur und historische Informationssysteme: Beiträge des wissen-schaftlichen Kolloquiums in Wismar vom 4. und 5. September 2003 (LIT, Munster, Germany). German.
34. Luterbacher J, Dietrich D, Xoplaki E, Grosjean M, Wanner H (2004) European seasonal and annual temperature variability, trends, and extremes since 1500. Science 303(5663): 1499–1503.
35. Xoplaki E, et al. (2005) European spring and autumn temperature variability and change of extremes over the last half millennium. Geophys Res Lett 32(15):L15713. 36. Schotthoefer AM, et al. (2011) Effects of temperature on early-phase transmission of
Yersina pestis by the flea, Xenopsylla cheopis. J Med Entomol 48(2):411–417. 37. Schotthoefer AM, et al. (2011) Effects of temperature on the transmission of Yersinia
Pestis by the flea, Xenopsylla Cheopis, in the late phase period. Parasit Vectors 4(1): 191.
38. Walløe L (2008) Medieval and modern bubonic plague: Some clinical continuities. Med Hist Suppl (27):59–73.
39. Link VB (1951) Plague on the high seas. Public Health Rep 66(45):1466–1472. 40. Bos KI, et al. (2011) A draft genome of Yersinia pestis from victims of the Black Death.
Nature 478(7370):506–510.
41. Biraben JJN (1976) Les hommes et la peste en France et dans les pays européens et méditerranéens (Mouton, Paris-La Haye). French.
42. Atanasiu V, Priol C, Tournieroux A, Ornato E (2008) Yersinia. Georeferences for places of plague occurrence in Europe 1347-1600. Available at www.bernstein. oeaw.ac.at/atlas/yersinia-description.pdf.
43. Büntgen U, Ginzler C, Esper J, Tegel W, McMichael AJ (2012) Digitizing historical plague. Clin Infect Dis 55(11):1586–1588.
44. Alexander JT (1986) Reconsiderations on plague in early modern Russia, 1500-1800. Jahrb Gesch Osteur 34(2):244–254.
45. Melikishvili A (2006) Genesis of the anti-plague system: The Tsarist period. Crit Rev Microbiol 32(1):19–31.
46. Congourdeau M-H (1999) La peste noire à Constantinople de 1348 à 1466 [Black Death in Constantinople (1343-1466)]. Med Secoli 11(2):377–389. French. 47. Marien G (2009) The Black Death in early Ottoman territories: 1347–1550. PhD
dis-sertation (Bilkent University, Ankara, Turkey).
48. Cook ER, Peters K (1981) The smoothing spline: A new approach to standardizing forest interior tree-ring width series for dendroclimatic studies. Tree-Ring Bulletin 41: 45–53.
49. Cook ER, Peters K (1997) Calculating unbiased tree-ring indices for the study of cli-matic and environmental change. Holocene 7(3):361–370.
50. Osborn TJ, Briffa KR, Jones PD (1997) Adjusting variance for sample-size in tree-ring chronologies and other regional mean timeseries. Dendrochronologia 15:89–99. 51. Frank D, Esper J, Cook ER (2007) Adjustment for proxy number and coherence in
a large-scale temperature reconstruction. Geophys Res Lett 34(16):1–5.
52. Spufford P (2002) Power and Profit: The Merchant in Medieval Europe (Thames & Hudson, London).
53. Ciolek TM (1999) 1999-present. Old World Trade Routes (OWTRAD) Project. Canberra: www.ciolek.com—Asia Pacific Research Online. Available at www.ciolek.com/owtrad. html. Accessed February 16, 2014.
54. Frangakis E (1985) The ottoman port of Izmir in the eighteenth and early nineteenth centuries, 1695-1820. Revue de l‘Occident musulman et de la Méditerranée 39(39): 149–162.
55. Gross RWF (2012) Historical Atlas of Eurasia, 3rd Ed. Available at productforums.google. com/forum/#!msg/gec-history-illustrated-moderated/9UrX_lQEzYE/ORYfbWZhPuEJ. Ac-cessed July 11, 2013.
ECO