Copyright © University of Washington. Published by Cambridge University Press, 2018. doi:10.1017/qua.2018.51
Neogene to Quaternary uplift history along the passive margin of the
northeastern Arabian Peninsula, eastern Al Hajar Mountains, Oman
Daniel Moraetisa*, Frank Matterna, Andreas Scharfa, Gianluca Frijiab, Timothy M. Kuskyc,d, Ye Yuanc, Issa El-Hussaine a
Department of Earth Sciences, Sultan Qaboos University, Al-Khod, Muscat 123, Oman
b
Department of Physics and Earth Science, University of Ferrara, Via Saragat 1, 44122, Ferrara, Italy
c
State Key Laboratory for Geological Processes and Mineral Resources, Three Gorges Research Center for Geohazards, Ministry of Education, China University of Geosciences, Wuhan 430074, China
d
Center for Global Tectonics, School of Earth Sciences, China University of Geosciences, Wuhan 430074, China
eEarthquake Monitoring Center, Sultan Qaboos University, Al-Khod, Muscat 123, Oman
(RECEIVEDJuly 24, 2017; ACCEPTEDApril 20, 2018)
Abstract
This work explores the uplift history of the best exposed marine terraces in the northeastern Arabian Peninsula (eastern Al Hajar Mountains). A multidisciplinary approach was employed, including a topographic survey,14C dating, thin section studies, and scanning electron microscopy analyses. Six distinctive marine terraces with widths ranging from tenth of meters to kilometers and elevations from 5 to ~400 m were studied. These terraces record an along-strike heterogeneous uplift history, while they show temporally variable uplift rates ranging between 0.9 to 6.7 mm/yr, which correlates well with other published uplift rates of marine terraces of the eastern Arabian Peninsula. We attribute the variable uplift along strike of the terraces, to a combination of uplift mechanisms: (1) during early to mid-Miocene along deep-rooted reverse faults that bound large crustal-scale blocks, (2) Pliocene or post-Pliocene uplift on the outer wall of the forebulge of the lower Arabian Plate as it bends to enter the Zagros-Makran subduction zone, and (3) a possible slowdown of subduction for the past ~40 ka.
Keywords:Marine terraces; Quaternary; Arabian plate; Tectonic uplift
INTRODUCTION
Paleo-shorelines and marine terraces are geomorphological features, denoting an interaction between sea level and shoreline. The study of the elevations of paleo-shorelines and their ages in relation to eustatic sea levels is a tool to under-stand recent crustal movements and earthquake history. Such studies have been conducted in tectonically active areas such as forearcs overlying subducted plates in the Mediterranean Sea, South America, and South Asia (e.g., Mancini et al., 2007; Regard et al., 2010; Mouslopoulou et al., 2015a; Gharibreza, 2016). Uplift studies of subducted plates are rare, however, and usually attributed to the bulging lithosphere as it is bending towards the subduction zone (Bradley and Kusky, 1986). Establishing the uplift history of the subducted margin in a forebulge setting descending into a trench on the order of 100–200 km distance has lately been discussed, and
the new insights are far from the notion of tectonic quies-cence where eustasy can be clearly identified with little influence of tectonic uplift (Bradley and Kusky, 1986; Pedoja et al., 2006, 2011).
The northern and northeastern Arabian Plate is being subducted within the continental and oceanic lithosphere. The oceanic lithosphere formed at a mid-ocean ridge of the Neo-Tethys Sea. A former passive margin has already dis-appeared under the Zagros zone, while part of the ocean lithosphere is still down-bending in the Makran zone (White, 1984). These aspects create a complex and rare case of landscape uplift of the Arabian Plate, combining different tectonic mechanisms derived from plate convergence and/or slab stagnation and forebulge formation (Fournier et al., 2006; Hansman et al., 2017).
Pedoja et al. (2011) suggested that Quaternary uplift can be intense even in passive margins due to elastic flexure of sediment loading or far-field stress, which makes the uplifted coastal areas key areas to study plate motion processes. Marine terraces uplifted during the Quaternary and especially the Holocene, with its sea-level rise, represent a criticalfield
*Corresponding author at: Department of Earth Sciences, College of Science, Sultan Qaboos University, Al-Khod, Muscat 123, Oman. E-mail address: [email protected] (D. Moraetis).
for the understanding of uplift mechanisms. Such cases have been recorded in the northern Arabian Peninsula (Wood et al., 2012). A comprehensive review of 890 global sites shows that uplift data for Oman’s margin are largely missing (Pedoja et al., 2011, 2014). This gap needs to befilled. It is known that the northern and northeastern margin of the Arabian Peninsula is bordered by the Zagros-Makran sub-duction zone (Fig. 1a), which is uplifting the Eurasian Plate at rates of up to 5± 1.37 mm/yr (Gharibreza, 2016), while northeastern Oman is still in an early stage of the Arabia/ Eurasia collision. This makes northeastern Oman an inter-esting area in which to study the response of the continental crust of a former passive margin approaching the subduction zone.
The Sultanate of Oman has a complex geological record, including several orogenies and other tectonic events. A new episode started during the Paleogene with the onset of the Arabia/Eurasia collision along the Zagros and Makran sub-duction zones, which are a continent-continent and an ocean-continent subduction zone, respectively. Owing possibly to the onset of this convergence, extensive marine-terrace develop-ment along the northeastern coast of Oman is one of the region’s most significant and striking features. The marine terraces have been identified and described in the course of geological mapping (Le Métour et al., 1986; Wyns et al., 1992a, 1992b). While thefirst relative dating attempt (Plio-cene and later) was made by Wyns et al. (1992a), the most recent works on these terraces identify them in terms of land-scape characteristics and support the understanding of their marine origin (Kusky et al., 2005; Hoffman et al., 2013; Yuan et al., 2016; Mattern et al., 2018).
The present work provides for thefirst time detailed time constraints on the uplift of a sequence of marine terraces and other geomorphic characteristics (e.g., notches and abrasion platforms) over a distance of 25 km between the villages of
Tiwi and Fins (Fig. 1b). We characterize the geomorphology of the study area and assign related14C ages to certain surface features in order to calculate uplift rates. Areas of different uplift of the northeastern Arabian Peninsula are then identi-fied and compared to other uplifted areas under consideration of the regional tectonic regimes along the Arabian subduction zone.
GEOLOGICAL AND TECTONICS HISTORY
OF THE AL HAJAR MOUNTAINS
The Al Hajar (also called“Oman”) Mountains of the north-eastern Arabian Peninsula are the product of several post-Paleozoic tectonic events owing to the overall convergence between Gondwana and Eurasia, lasting until today (e.g., Fournier et al., 2006; Fig. 1a). Closure of the Neo-Tethys Ocean between Gondwana and Eurasia led to obduction of the famous Semail Ophiolite during the late Cretaceous (e.g., Searle and Malpas, 1980; Lippard et al., 1986; Goffé et al., 1988; Nolan et al., 1990; Hacker et al., 1996) and adjacent passive-margin sediments to the southwest (Hawasina Basin). Both allochthonous nappe systems (Semail Ophiolite and the underlying Hawasina nappes) were thrust south-westward onto the Arabian platform for ~150 km during the Campanian (Hacker et al., 1996). Between the Maastrichtian and the Oligocene-Miocene boundary, the tectonic develop-ment of the Al Hajar Mountains was relatively quiet, as indicated by accumulation of more than 2000 m of mainly shallow-marine Neogene limestone, nonconformably over-lying the Semail Ophiolite (Fig. 1b and description in the Supplementary Data; Mann et al., 1990; Wyns et al., 1992a; Fournier et al., 2006). Figure 1a shows the current tectonic situation at the northeastern margin of the Arabian Plate, which is bound by the Zagros-Makran subduction zone.
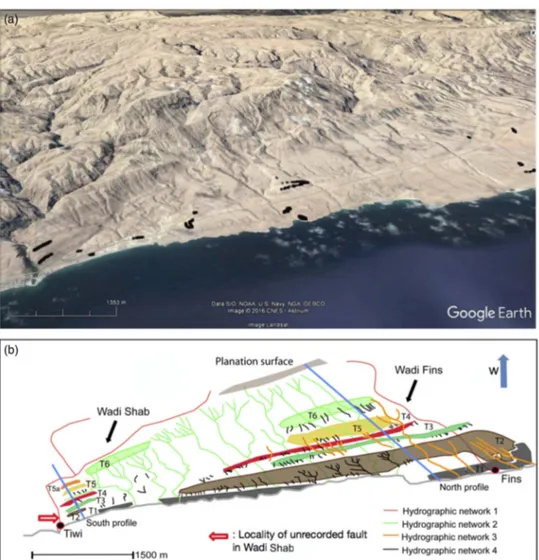
Figure 1.(color online) (a) Tectonic map of northern Oman, modified after Mattern and Scharf (2018). HW, Hawasina Window; JAD, Jabal Akhdar Dome; SHD, Saih Hatat Dome. (b) Geological map of the study area, redrawn after Wyns et al. (1992a). Dashed outline depicts the study area.
Deformation in the Zagros Mountains, which started ~22 Ma ago, amounts to 440 km of slab fed into the subduction zone (Zagros-Makran fold and thrust belts; Agard et al., 2005; Gavillot et al., 2010; Monthereau, 2011; Khadivi et al., 2012) and is still active (Vernant et al., 2004). This interval is
marked by the final exhumation of three large domes in
northeastern Oman: the Hawasina Window and the Jabal Akhdar and Saih Hatat domes (Mount et al., 1998; Poupeau, et al., 1998; Saddiqi et al., 2006). Figure 1a also shows the current tectonic situation at the northeastern margin of the Arabian Plate. Quaternary deformation in the Al Hajar Mountains is reflected by faults cutting through Quaternary wadi gravel (Kusky et al., 2005), hydrothermal activity on the northern margins of the Jabal Akhdar and Saih Hatat domes (Mattern and Scharf, 2018), and formation of coastal terraces between Muscat and Sur near Tiwi (Kusky et al., 2005; Hoffmann et al., 2013; Yuan et al., 2016; Al Hatrushi 2017).
METHODOLOGY
Topographic survey
The topographic survey was performed with a double pre-cision real-time kinematic (RTK) GPS receiver, and it was readily corrected for coordinates and elevation under the reference points supplied by the National Survey Authority of the Sultanate of Oman. The topographic dataset includes a total of 5526 survey points, measured under an excellent geometric dilution of precision (GDOP) and accuracy of <0.3 cm in height. The topographical survey covered a surface area of 3 × 25 km (length from northeast to south-west), mainly between and around the villages of Fins and Tiwi. The survey points were distributed in 17 localities. The number of terraces which were surveyed included
terraces T1 to T4, while terraces T5 to T6 were observed in thefield and on Google Earth images. Terraces T5 and T6 were not topographically surveyed due to distance limita-tion (<10 km) in the radio-frequency connection between the reference base points and the rover. The topographic survey took place on two days on November 28 and October 31, 2015 between 13:00 to 17:00. The tidal fluc-tuation is given in the Supplementary Data for the sampling dates with maximum tide at 2.69 to 2.89 m, respectively (Supplementary Table 1).
Shuttle Radar Topography Mission (SRTM) data were used to create (1) an elevation map, (2) an aspect ratio map, and (3) a slope gradient map. SRTM data were of version 4.1 with a spatial resolution of 90 m (Reuter et al., 2007). The 30-m resolution data was not available for the study area. The SRTM data were processed with ArcMap version 10.1 for the production of the elevation map with a hillshades, a surface aspect map, and a surface slope map by using the respective tools. The SRTM ASCIIfile was masked for our study area. In the slope tool of Arc Map 10.1, the z-factor was defined as 0.00001036 (30°).
Sample characterization and radiocarbon dating
Eight samples were collected for thin-section analysis from different localities, and analyzed under transmitted light. The samples were collected in the localities considered critical for the interpretation of geomorphological features, mainly between Fins and Tiwi. The samples are mainly conglomer-ates from notch 1 (Fig. 2e, f), terraces T1 (Fig. 2a, d, h) and T2 (Fig. 2b, g), and the slope between terraces T2 and T3 (Fig. 2c.). Sample FE13 is from a coral reef (Mattern et al., 2018). Sample details are summarized in Table 1.Since marine bioclasts (rather than intact fossils) are commonly embedded in the matrix or cement of the samples,
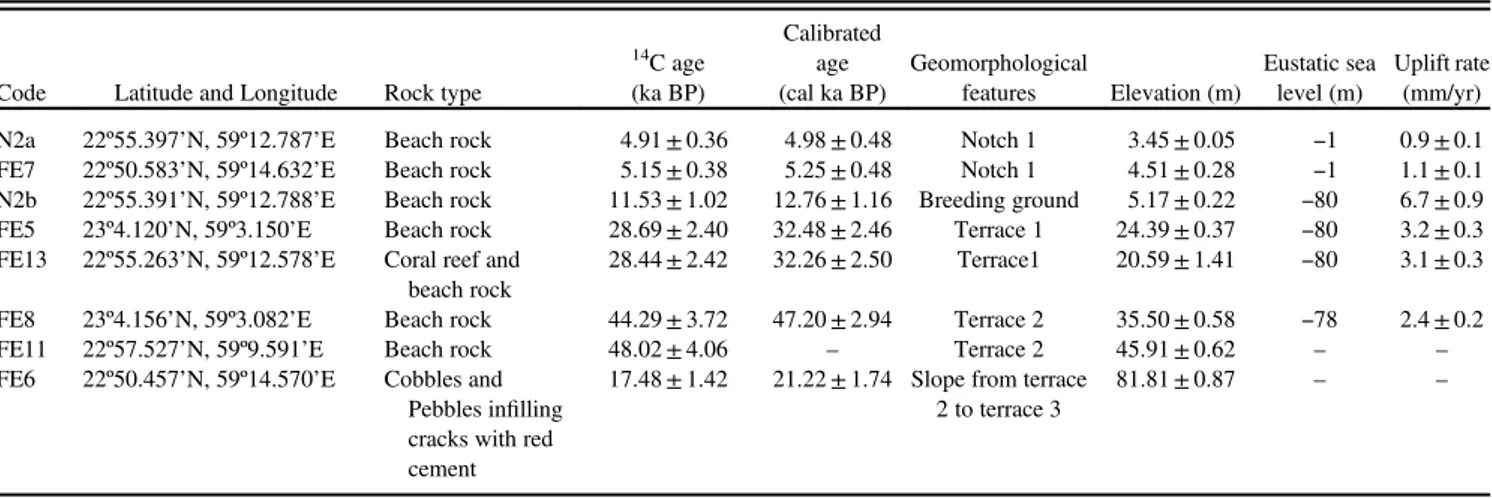
Table 1. Sample descriptions,14C data (±2σ), geomorphology, and average elevations with standard deviation (std). Eustatic sea level adopted from Siddall et al. (2003) and Rohde (2011). All dated species were a mixture of gastropods and shells, except coralline algae for sample FE13 and calcite from paleosol for sample FE6.
Code Latitude and Longitude Rock type
14 C age (ka BP) Calibrated age (cal ka BP) Geomorphological features Elevation (m) Eustatic sea level (m) Uplift rate (mm/yr) N2a 22º55.397’N, 59º12.787’E Beach rock 4.91± 0.36 4.98± 0.48 Notch 1 3.45± 0.05 −1 0.9± 0.1 FE7 22º50.583’N, 59º14.632’E Beach rock 5.15± 0.38 5.25± 0.48 Notch 1 4.51± 0.28 −1 1.1± 0.1 N2b 22º55.391’N, 59º12.788’E Beach rock 11.53± 1.02 12.76± 1.16 Breeding ground 5.17± 0.22 −80 6.7± 0.9 FE5 23º4.120’N, 59º3.150’E Beach rock 28.69± 2.40 32.48± 2.46 Terrace 1 24.39± 0.37 −80 3.2± 0.3 FE13 22º55.263’N, 59º12.578’E Coral reef and
beach rock
28.44± 2.42 32.26± 2.50 Terrace1 20.59± 1.41 −80 3.1± 0.3 FE8 23º4.156’N, 59º3.082’E Beach rock 44.29± 3.72 47.20± 2.94 Terrace 2 35.50± 0.58 −78 2.4± 0.2 FE11 22º57.527’N, 59º9.591’E Beach rock 48.02± 4.06 – Terrace 2 45.91± 0.62 – – FE6 22º50.457’N, 59º14.570’E Cobbles and
Pebbles infilling cracks with red cement
17.48± 1.42 21.22± 1.74 Slope from terrace 2 to terrace 3
the authors decided to measure a mixture of bioclasts. Four samples were investigated under a scanning electron micro-scopy (SEM) with energy dispersive x-ray (EDS; Jeol JSM-7600). The selection criteria of the samples for SEM analysis mainly followed the presence of cement and matrix. The same eight samples were analyzed for14C dating. The samples were crushed and pretreated with HCl to remove interferences from secondary carbon due to inorganic and biologically derived deposition. The 14C preparations were performed by carefully removing coatings of calcite matrix. The matrix and the biological clastic material may contain “old” carbon, which may lead to overestimated 14
C ages. This possible problem has been addressed by Mouslopoulou et al. (2015a). It can be overcome by dating shells/tests of encrusting organisms or boring organisms of the paleo-shoreline. Bioencrustation does not appear at our sites, except
for sample FE13, while the boring material from other places, especially notch 1, is considered highly altered by dissolution and precipitation processes. Thus, the 14C analyses in the present study were performed in marine biological clastic material, except for sample FE13, which is a coral. Although the most desirable, appropriate kind of dating material was unavailable for 14C measurements, the soundness of our analysis is considered satisfactory, especially when plotted against sample elevations and their relation to the sequential
geomorphologic development. 14C was measured with an
ultra-low background liquid scintillation spectrometer
(Quantulus 1220 model) in the14C Geochronology Lab of the College of Environmental Sciences, China University of Geosciences, Wuhan. The total amount of each analyzed sample was 7–9 mg. The Libby half-life was used for calcu-lation of raw14C yr BP. The calibrated years of the raw14C data were derived from OxCal 4.3 online software (Bronk Ramsey, 2009). The calibration curve Marine 13 (Reimer et al., 2013) was applied and the reservoir marine offset (ΔR) of 196± 59 was used in the calibration. The reservoir offset was calculated from the published data of Southon et al. (2002), according to which theΔR of the Indian Ocean is 158± 68, as determined from 31 samples. We calculated our ΔR from the average of five samples (two from Oman and three from Pakistan and India). Although it was slightly higher, it may be more representative for the present study
area. Our ΔR calculation is relatively close to ΔR of
255± 55, as proposed by Zazzo et al. (2012) for northern Oman. The highΔR in the Gulf of Oman and further towards the Indian Ocean is due to not well-equilibrated water because of the upwelling in the Arabian Sea. Sample FE6 was calibrated with the IntCal 13 curve since it is considered a paleosol. Sample FE11 was out of range. Thus, a calibration date is not provided. We include it in our analysis, however, since it showed goodfitting with the stratigraphy. The 14C specific activity was calibrated with the specific activity of 4 standards, the Chinese sugar carbon (CSC), NBS oxalic acid standard (OXI) sucrose, ANU sucrose (IAEA C-6), and tree-ring growth (1847–1854; Xu et al., 2010, 2013).
RESULTS
Geomorphologic observations in the terraces
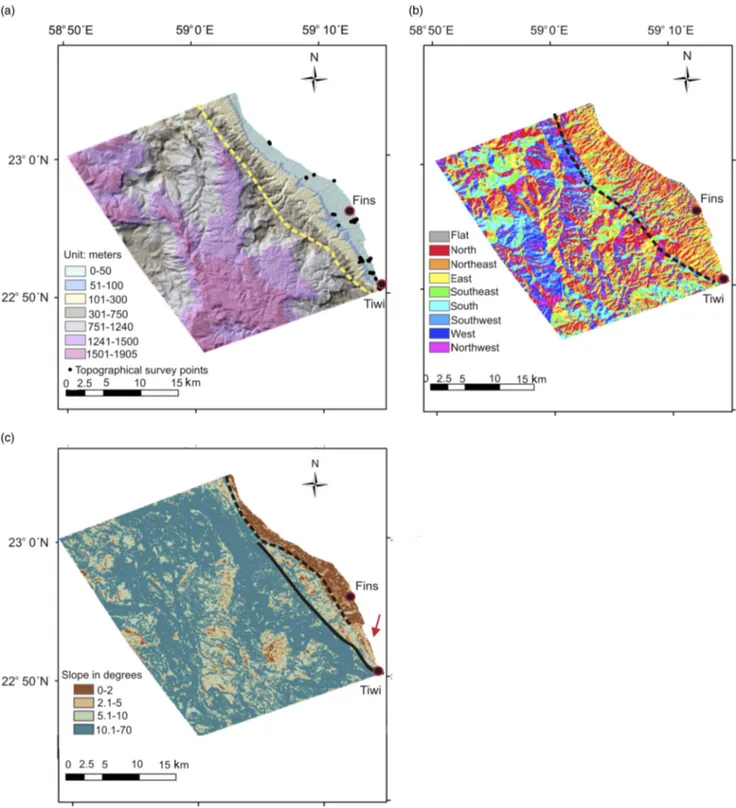
The digital elevation model reveals several characteristics of the study area (Fig. 3a–c). Cenozoic rocks have been identi-fied up to an elevation of >1,900 m (Fig. 3a). The elevation map (dashed line bounds the terraces area in Fig. 3a) with hillshades reveal a series of terraces that parallel the north-west- to southeast-striking coastline with elevation classes of0–50, 51–100, 101–300, and 301–700 m (Fig. 3a). The
coastline also strikes parallel to most of the faults mapped in this area, including the Ja´alan Fault (compare “Active faulting” with the rose diagram of Supplementary Figure 1). The aspect ratio map (Fig. 3b) clearly depicts an area with the overall landscape surface facing the northeast and paralleling
Figure 2.(color online) Samples collected from wave-cut notch 1 (e, f), terrace T1 (a, d, h), terrace T2 (b, g) and the slope between T2 and T3 (c).
the coastline. This northeast-dipping surface is bordered with a dashed line in Figure 3b. The areas southwest of the region described above exhibit a variety of orientations due to steeply eroded mountain slopes and wadi embankments. Figure 3c shows the landscape slope angles, categorized into
four groups. Thefirst group with very low slope angles of 0–2° (abrasion platforms) is extensively represented in the area between Fins and Tiwi (marked by the dashed, black line Fig. 3c). Southwest of the dashed line, towards the solid black line (landward in Fig. 3c) is an obvious change in the
Figure 3.(color online) (a) Elevation clustering map, dashed line bounds the area with all terraces and topographical survey points (black dots). (b) Slope aspect map. Dashed line shows the aspects of the study area. (c) Slope gradient map. Dashed line and solid lines separate two areas of lower angle (abrasion platforms 0–2°) and higher angle (>2–5°), respectively. Arrow shows an area close to Tiwi at the coastline where the slope gradient changes markedly.
landscape with steeper angles (>2–5° and >5–10°). Com-paring the elevation map (Fig. 3a) with the slope gradient map (Fig. 3c), one notices that the areas with a slope of 0–2° occur at an elevation between 0 and ~100 m, where most of the Quaternary deposits are exposed (Wyns et al., 1992a). The slope angles which prevail from an elevation of ~100 m to approximately 400 m range from>5–10°. At elevations of ≥400 m, the slopes are very steep (>10°).
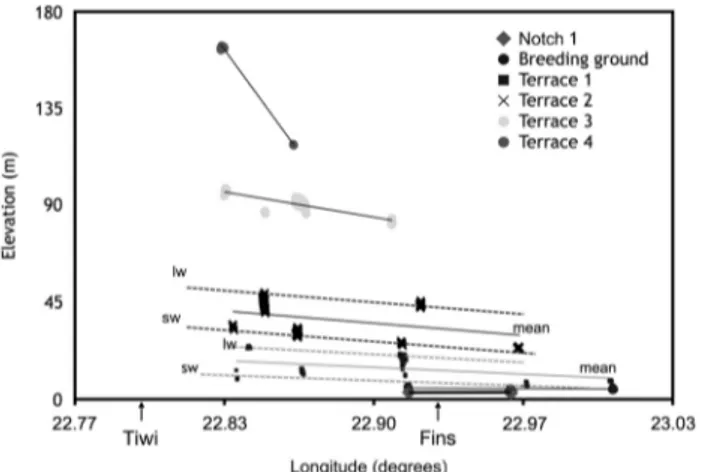
The longitudinal elevation variability of four terraces (from seaward T1 to landward T4) is depicted in Figure 4. The average elevations for T1 to T4 are 15, 38, 89, and 118 m (± <1 m), respectively. The approximate elevations, accord-ing to Google Earth data, for T5, T5a, and T6 are 137, 195, and 370 m, respectively (at least± 10 m margin of error are obtained, comparing the elevation of the RTK measurements and the Google Earth in the surveyed T1 to T4). The T1/T2 slope, which is calculated for the distance between the high-est and the lowhigh-est area, measures 1.1 to 1.15°, which agrees well with the slope map. T1 and T2 indicate an environment of wave-cut abrasion platforms (Supplementary Figures 2a and b). These terraces are also associated with the most extensive Quaternary deposits (Supplementary Figures 2c and d). The same abrasion platforms become narrower (in some cases disappearing) northwest of Fins and southeast of Tiwi (profiles 1 to 24 from Tiwi to Fins; Supplementary Figures 3a and 4a). The northwest-striking elevation profiles 28 to 29 also illustrate the nearly flat areas close to the coastline (Supplementary Figure 4b). The slope gradient was not measured for T3, T4, and T5 in the topographic survey. The DEM analyses show, however, that they are included mainly in the 5–10° class, as they are located close and/or higher than 100 m. On analogous grounds, T6 has been categorized to belong to an even more steeply sloping land surface (>5–10°).
Figure 4 shows the longitudinal slope of the same terraces from Tiwi towards Fins. The elevations, both of the lower and upper boundary of each terrace, were measured wherever
possible. The landward and seaward areas are shown with dashed lines in Figure 4 for T1 and T2. A correlation between the southeastern (Tiwi) and northwestern (Fins) terraces was possible by correlating lithological characteristics in the respective terraces. Tilting of the terraces towards Fins or northwestward is obvious, especially for the higher terraces T3 and T4. The terraces T1 to T4 are shown in Figure 5a towards Fins (standing at point II of Fig. 5a). The same ter-races are shown towards Tiwi in the Supplementary Data (Supplementary Figure 5a towards Tiwi, standing at point I of Fig. 5a). The investigation from point III (Supplementary Figure 5b) shows a terrace (T5a) at a higher elevation than terrace T5, which has no analogue towards the Fins area. The paleo-shorelines are restricted to narrower and steeper ter-races or benches towards Tiwi, while their morphologically “equivalent” parts towards Fins are wider and extend over different elevations. (For the meaning of “equivalent,” see Supplementary Data).
Geomorphologic observations regarding the
notches
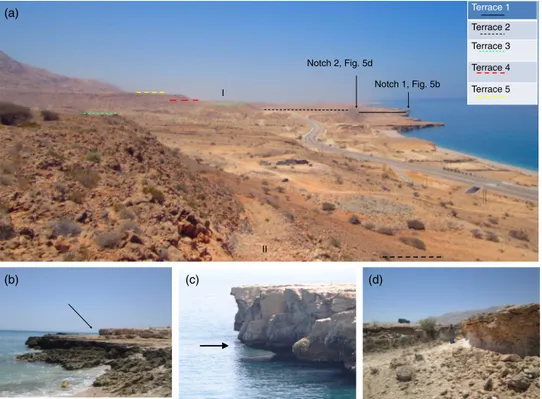
The most recent uplifted notch (notch 1), which is below terrace T1, is preserved in several localities shown in Figure 5b (also Supplementary Figures 6a and b) close to Fins and north of Fins close to Dibbab (Supplementary Figure 6c). Below notch 1, a new notch has been formed in today’s tidal range (Fig. 5c, thick arrow). Notch 1 was topographically surveyed at an average elevation of 3.5 m.
Notch 1 is clearly above the maximum tidal fluctuation,
which is 2.89 m (Supplementary Table 1) and exhibits a multitude of characteristic Lithophaga borings in limestone (Supplementary Figure 6a). The borings are mostly preserved below the conglomerate deposits, which partly cover notch 1. Notch 1 is still in the reach of storm waves, which are eroding the conglomerates and the bioencrustation. T1 follows immediately above notch 1 and constitutes a breeding ground for coral reefs (Supplementary Figures 7a–7c; Mattern et al., 2018). A second notch (notch 2) was identified above terrace T1 and landward from the coral reef at an elevation of 23 m. This notch is preserved in fewer places than notch 1 and the actual characteristics of a biologically eroded notch as described above are not preserved. In addition, other sea-level indicators could be identified, such as dissolution features (“honeycombs”; see Pizzaroli, 1996) and a small erosional arch (vugs; Supplementary Figures 8a and b).
Hydrographic network analysis
The hydrographic network is shown in Figures 6a and 6b. The different grayscale colors are assigned to different geo-logical histories of the channels. Hydrographic network 1 flows through the areas with the westward aspect (planation surface) towards the areas of the marine terraces (northeast flow direction). Some elements of this network, however, are developed parallel to faults striking southeast-northwest.
Figure 4. Longitudinal elevation variability in different terraces, depicted by different symbols. Solid lines show the fitted linear lines, which depict the mean longitudinal elevation change of each terrace and dashed lines show the landward (lw) and seaward (sw) crest elevation.
Wadi Shab discharges close to Tiwi and shows the southeast direction offlow, which follows the northwest-striking faults, as depicted in Figure 6b (unrecorded fault).
Hydrographic network 2 is restricted to the area of the marine terraces and trends in a northeast direction. The channels have not yet reached the area of the planation sur-face by headward erosion. The slope of the streams is remarkably steep towards the crest near the planation surface (Fig. 6b), especially landwards from terrace T6, while the channel gradients characteristically decrease from terrace T3 to T2, denoting a relatively large time span between the creation of terraces T3 and T2.
Hydrographic network 3, with northeasternflow direction, flows through different marine terraces (T6 to T1) lower than the planation surface (Fig. 6b). The drainage system of this network shows either a loss of tributaries between T3 to T2 and/or a change in the valley depth, especially among those streams extending from T6 to T1.
Hydrographic network 4 is characterized by wadis that are restricted to only one terrace. They are of two different types, those which scoured the crests of the terraces, giving them comb-like shapes, and those which display a dendritic drai-nage pattern and are only associated with T2.
Thin-section descriptions
All sample localities and the respective geomorphologic features are shown in Figure 7a. Samples FE8 and FE11
belong to terrace T2. The conglomerates are characterized by pebbly limestone clasts. The samples exhibit two dis-tinct characteristics: (1) the vuggy porosity, which post-dates a matrix with foraminifera and bivalve clasts; and (2) the microcrystalline to isopachous bladed cement of high-Mg composition (13.2%; Supplementary Figure 9), post-dating the main dissolution phase (arrow 3 in Fig. 7e–7f; and Supplementary Figure 10). An erosive pedogenic crust in sample FE11 with an enriched content of Al indicates a terrestrial environment that postdates conglomerate forma-tion (Supplementary Figures 10, 11, 12a–e). In addition, sample FE8 contains quartz (Supplementary Figure 13). The same pedogenic crust was found in sample FE6, col-lected from filled fissures recently exposed by road exca-vations (arrow 4 in Fig. 7g; and Supplementary Figures 14a–d, 15, 16).
Samples FE5, FE13, and N2b belong to the same terrace (T1) and were collected from higher to lower elevation, respectively. All samples are characterized by vuggy and moldic porosity (arrow 1 in Fig. 7d) along with clasts of marine-species origin in a microcrystalline matrix. An iso-pachous microcrystalline cement (evolved also to bladed/ dogtooth morphologies; Supplementary Figure 17) lines the pores and, therefore, postdates the porosity (arrows 2 and 3 in Fig. 7d, Supplementary Figure 18). Sample FE13 is a boundstone that contains red algae and corals (elevation = 20.6 m; Supplementary Figure 18). Sample N2b shows aci-cular cement lining the clasts (second generation; arrow 1 in
Terrace 1 Terrace 2 Terrace 3 Terrace 4 Terrace 5 Notch 1, Fig. 5b Notch 2, Fig. 5d II I (a) (b) (c) (d)
Figure 5.(color online) (a) Overview photograph of terraces T1 to T5, view to the northeast. Figure shows viewpoints I and II in parentheses. The image was taken from point II towards point I. Reverse image is shown in Supplementary Figure 5a. (b) Notch 1 at Fins (thick arrow) with a person for scale. (c) New notch (thick arrow). The cliff is about 4 m high. (d) Notch 2, as indicated in (a), with a person for scale.
Fig. 7c, Supplementary Figure 19). Chemical analyses of the needles show a low to medium Mg content (4.5%; Supple-mentary Figures 20 and 21).
Thin sections of samples FE7 and N2a from notch 1 are coral- and gastropod-bearing limestone conglomerate with limestone pebbles. Vuggy porosity (sample FE7, arrow 1 in Fig. 7b) is the dominant pore system with the pores often lined by a microcrystalline, low-Mg (1.4–2.8 ± 0.1%) calcite cement rim (arrow 2 in Fig. 7b; and Supplementary Figures 22 and 23) and more rarely bladed to equant cement, clearly postdating dissolution (arrow 3 in Fig. 7b). Bioclasts of marine origin are present in the matrix of sample FE7.
Active faulting
The mapped faults, as documented by Wyns et al. (1992a), represent a 20–30 km wide fault zone, which we refer to as the“Coast Parallel Shear Zone” (CPSZ). The strike of the CPSZ is subparallel to the marine shelves and the coastline (Kusky et al., 2005). Overall, the faults strike mainly in a
west-northwest to northwest direction, which is related to faulting during the late Cretaceous to early Miocene in at least two extensional phases, namely Stage I and Stage IIa of Fournier et al. (2006). The CPSZ was reactivated in a sinistral transgressive mode as of the Miocene (compare Wyns et al., 1992a; Fig. 6a in Ali et al., 2016). The two faults with the largest vertical displacement are the Ja´alan and Qalhat reverse faults (Wyns et al., 1992a; Kusky et al., 2005). The west-northwest-striking Ja´alan Fault has a maximum ver-tical offset of 3 km and the north-northwest-striking Qalhat Fault has a maximum vertical displacement of ~5 km (Ali et al., 2016). Both faults are considered active (Dickson, 1986; Wyns et al., 1992a; Ali et al., 2016). A major earthquake in the fifteenth century ruptured probably the Qalhat Fault and damaged Qalhat village (Dickson, 1986). The Qalhat Fault juxtaposes Cenozoic and Precambrian basement rocks in its hanging wall (Wyns et al., 1992a). The history of the two aforementioned faults probably predates the Cenozoic, and both faults might have been reactivated during the past 14 Ma (Wyns et al., 1992a).
Figure 6.(color online) (a) Google Earth image of the study area and the topographical survey points (black dots). (b) Schematic sketch showing marine terraces T1 to T6, the hydrographic network, and the traces of topographic profiles from the northern and southern end of the area. The profiles are shown in Figure 7a as “south” and “north” profile. The planation surface is at an elevation of ~2,000 m.
We identified an area with newly exposed faults north of Fins. We documented eight normal faults along the highway north of Fins (Supplementary Table 2, Supplementary Figures 24, 25a and b). Six of them strike almost perpendi-cular to the coastline with dip directions of 150–170°, while they all showed 1 to 2 m of maximum vertical displacement. Yet two other previously unmapped faults were recorded with dip directions of 318° and 28° and displacements of 1 to 2 m. It is uncertain whether these faults were active during the Quaternary. The systematic search for faults in the embank-ments of the major wadis incising the terraces revealed only one normal fault striking parallel to the coastline (Fault 8; Supplementary Table 2). The cataclastic Fault 8 is located along the boundary between marine terraces T2 and T3. (Supplementary Figures 25c and d). No estimation of the displacement for this fault was possible. Southeast of the study area, a major fault (Fault 9) has been identified, striking parallel to the coastline. This fault, striking north-northwest, has been mapped by Wyns et al. (1992a). We classify this fault as a sinistral transpressive fault with a positive flower structure, based on the analysis of Riedel shears (Supplementary Figures 26a and b).
Uplift rates and eustatic sea level
To be consistent, calculation of the uplift rate included the eustatic sea-level curves used by other studies in the Arabian Peninsula (Wood et al., 2012). For the ages up to the last
glacial maximum (LGM), the Rohde’s (2011) composite
curve was used, while the curve of Siddall et al. (2003) was selected for the ages higher than the LGM instead of the curve used by Shackleton (1987). The former provides a detailed eustatic sea-level record for the time between 75 to 25 cal ka BP. The samples N2a and FE7 dated within the last 5 ka and may provide for lower uplift rates with respect to Bird et al.’s (2010) sea-level curve. Similarly, Wood et al. (2012) showed that uplift values can be lowered from 1.4± 0.1 to 0.4 ± 0.1 mm/yr using Bird et al.’s (2010) curve with an eustatic sea level of ~3 m higher at 5 cal ka BP than in the curve of Rohde (2011). We avoided use of the afore-mentioned eustatic sea-level curves, however, since several archeological studies show that the eustatic sea level stabi-lized at 5 cal ka BP (Biagi 1994; Berger et al., 2013; Preston et al., 2015). Most of the mentioned studies support the idea that Neolithic settlement intensified later than 6 cal ka BP
Figure 7.(a) Schematic diagram of the southern and northern topographic profile in the study area. Schematic position of the samples, geomorphic characteristics, and conglomerates are shown. Note the difference in morphology between the two sections. Terraces are narrower in the south with respect to the north. Wadi Shab is deeply cutting in the southern profile behind terrace T5a. (b-g) Thin-section photographs with crossed nicols, except for samples FE11 and FE6. Arrows and numbers corresponding to“Thin-section descriptions” in the text.
while the eustatic sea-level was stable. It appears that the sea level was stable during the last 6 cal ka BP with continuous mangrove development, except between 4.40–4.25 cal ka BP when hyperarid conditions prevailed, as recorded in Oman caves (Fleitmann et al., 2007; Berger et al., 2013). Similar results have been obtained for the northern Arabian Peninsula along the Gulf Coast (Evans et al., 1969). No submarine archaeological sites have been recorded in Oman up to now, which differs from other parts of the world for the mid- to late Holocene (Pirazzoli et al., 1996; Pavlopoulos, 2012; Mous-lopoulou et al., 2015a).
The calculation of uplift rates is based on the elevation data of our topographic survey in the areas where the samples were collected. The uplift rates range from 0.9± 0.1 to 6.7± 0.9 mm/yr with an average uplift rate of 2.9 ± 0.3 mm/yr. Averaging the uplift rates is based on six samples. The calcu-lations are based on the classical approach Ur= (Ht - He) / A, where Ur is the calculated uplift rate, Ht the elevation of the land, He the eustatic sea level, and A the detected age (Siddall et al., 2003; Rohde, 2011). The apparent uplift rate is 0.74 mm/yr (Fig. 8a). The real uplift calculated from sample FE8 (at an apparent uplift of 35 m) is 113 m considering the eustatic level (-78 m) at 47 ka. The difference between appar-ent and real uplift rates can be well explained by tectonic events that coincided with periods of eustatic sea-level rise. This effect is also known as the“Sadler effect” (Sadler, 1981; Mouslopoulou et al., 2015b, 2016).
DISCUSSION
Landscape response to the variable uplift
The petrographic characteristics of the samples show that T1 was probably continuously uplifted, while T2 shows alter-nating periods between marine conditions and subaerial exposure. Notch 1 shows that it has been rapidly uplifted. For terraces T3 to T6, no marine deposits have been identified. The geomorphologic characteristics, however, suggest that T3 is older than T1 and T2.
Terrace T2 should have been created and covered with conglomerates during Marine Oxygen Isotope Stage (MIS) 3 (Stages i and ii in Fig. 8b). Sample FE8 (44,270–50,150 cal
yr BP) and the uncalibrated sample FE11 (48,020± 2030
14C yr BP) of terrace T2 indicate an uplift unable to com-pletely preclude transgressions, as is revealed by dissolution effects prior to the marine cement precipitation (Stage iii in Fig. 8b). The pedogenic crust in sample FE11 is similar to the one of sample FE6 (22,960–19,480 cal yr BP). The pedo-genic crustfilled fractures with displacive effect during the LGM. Displacement of clasts occurred during alternations of cold and warm periods at the transition from the last glacia-tion to the interglacial period when such condiglacia-tions may have prevailed (Table 1; Fuchs and Buerkert, 2008).
Notch 2, which separates terraces T2 and T1, does not provide clear evidence of biologically eroded notches. The preserved coral reef seawards of notch 2 points to conditions
for a notch to form by low-energy wave action (Pizzaroli, 1996). The only period for the creation of notch 2 is time-constrained between late MIS 3 and before MIS 2, when the sea level was relatively stable (notch 2 and stage iv in Fig. 8b). This implies that notch 2 is of similar age as the coral reef (FE13, stage iv in Fig 8b).
T1 and samples FE5 (34,940–30,02014C cal yr BP), FE13
(34,760–29,760 14C yr BP), and N2b (13,290–12,410
14
C yr BP) exhibit a remarkable, seaward, younging trend that records a continuous uplift. Petrographic data from samples FE5, FE13, and N2b of T1 suggest that they have been deposited on an abrasion platform, exposed to mixing of fresh and sea water (a low stand in MIS3; stage v in Fig. 8b). The two generations of cement (with a low to moderate Mg content) postdate dissolution. Preservation the coral reef (sample FE13) with the corals in growth position suggest fast removal of the terrace from the zone of wave erosion (Pizzaroli, 1996; Stiros et al., 2011; Mattern et al., 2018). The calculated uplift rate as depicted in Table 1 increased during T1 formation, with the highest uplift rate for sample N2b,
Figure 8.(a) Calibrated 14C Age (cal yr BP) versus present-day elevation of the samples. (b) Samples age relative to the eustatic sea level, as modified by Siddall et al. (2003). Stages i to vi are discussed in“Landscape response to the variable uplift.” Numbers 1 to 5.5 correspond to marine oxygen isotope stages (MIS), according to Siddall et al. (2003) and Rohde (2011).
which supports the ideas of fast removal from wave action and outpacing the eustatic sea-level rise of T1.
Notch 1 is considered a tidal notch (mid-littoral biological erosional feature) and a reliable sea-level indicator (Pizzaroli, 1996). This view is corroborated by more evidence such as the development of the notch in a uniformly weathering resistance layer and the development of bioencrustation near the vertex of the notch. The conglomerate that covers the borings may cause a blurring effect for the interpretation of either a rapid (co-seismic) or a slow (inter-seismic) uplift (Laborel and Laborel-Deguen, 1994; Pirazzoli et al., 1994; Stiros et al., 2011). The preservation of the Lithophaga shells in the borings, the preserved notch morphology, and the new notch below notch 1, however, suggest a fast, co-seismic uplift (Stiros et al., 1992). The conglomerate covering notch 1 could represent highly wet periods with high supply of sediment (Burns et al., 2001; Radies et al., 2005; Fuchs and Buerkert, 2008). Indeed, notch 1 and samples FE7 and N2a were sampled close to the mouths of the two major wadis (Wadi Shab and Wadi Fins). The influx of fresh water asso-ciated with rain and transport of coarse clastic material from the wadis caused deposition of shallow-water conglomerates with gastropods in a low-Mg matrix. The low-Mg micro-crystalline rim cement postdates vuggy dissolution, which may well reflect recent uplift and fluids circulating in a vadose meteoric zone. The uplift ensued during a stable sea level (stage vi in Fig. 8b).
No Quaternary deposits have been identified on terraces T3 to T6. Geomorphologic observations, however, show that terraces T3–T6 display a major time gap in uplift events, which is reflected by different down-cutting of the hydro-graphic network (see“Geomorphologic observations in the terraces” and “Hydrographic network analysis”) and the degree of landscape erosion. This is important considering that pluvial periods were similar from MIS 11 to T3 (Blechschmidt et al., 2009). T3-T6 could be characterized as a possible rasa (sensu stricto), which means that they predate T2 and T1 and are possibly of early Pleistocene age or older (Pedoja et al., 2014). The same is inferred also from the tilting of T3 and T4, as these were mostly affected by the spatial uplift variability within our study area. The elevation “jump” between T2 to T3 denotes a possibly much higher uplift that possibly corresponds to other tectonic uplift events than discussed in“Eastern Al Hajar Mountains uplift mechanisms,” below.
Spatial and temporal uplift variability
The spatially different uplift within our study area shows that, within the 25-km stretch of our study area, the uplift is het-erogeneous and faults exhibit different amounts of offsets (see“Geomorphologic observations in the terraces”). Com-paring the elevation of T3 and T4 between the northwest and southeast, and taking into account the absence of abrasion platforms in the south, we conclude that the southeast was raised higher than the northwest. The northwest-striking
reverse fault parallelling the coastline at the mouth of Wadi Shab is possibly related to differential uplift rates close to Tiwi, but no structural measurements could be taken to verify whether faulting contributed to the differential uplift. This has been described in several other cases due to fault segmentation and variations of fault slip along strike or other effects which are deviating from theoretical considerations of uniform uplift in one area (Pirazzoli et al., 1986; Stiros, 1996; Kontogianni et al., 2002). The“deviating” terraces T3 to T5a close to Tiwi are situated in the hanging wall of the afore-mentioned fault. In this case, we argue that the crust along the coastline of northeastern Oman is segmented by faults that bound different blocks with different uplift histories of ter-races of probably Pliocene and earlier ages. For a discussion of the segmentation and uplift mechanism, see“Geological and Tectonics History of the Al Hajar Mountains.”
The spatial-uplift variability can also be deduced in a larger frame beyond our study area at a distance of more than ~100 km (Batinah coastal plain, Quriyat, Sur). In fact, the coastline northwest of Quriyat towards Muscat and the Batinah area and to the southeast near Sur exhibits wadi valleys which are flooded by sea water, indicating subsidence rather than uplift (Supplementary Figures 27a and b). Moreover, in contrast to the ~2000 m of elevated Cenozoic rocks close to the study area, the Batinah area exhibits a Cenozoic basin with a 7– 10 km thick succession of Cenozoic rocks that are below sea level (Tertiary Basin; Fig. 15 in Al-Lazki et al., 2002). Southeast of the Sur depression,flooded valleys and salt pans occur, and Cenozoic rocks are found at an elevation of only 200 m. The emerging question from the spatially different uplift over long distance is its cause.
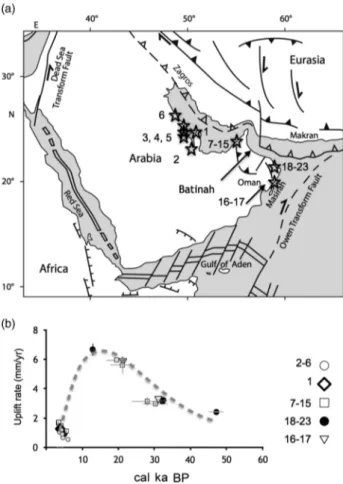
Comparing our uplift rates with 17 published uplift rates (Ridley and Seeley, 1979; McClure and Vita-Finzi, 1982; Gardner, 1988; Wood et al., 2012) from the northern and northeastern Arabian Peninsula (Fig. 9a and b, Supplemen-tary Table 3), we observed a similar trend of the uplift-rate variability during the last ~35 ka. The uplift rates are nor-malized in the sea-level curves used in the present study, while we could not verify whether the data from Ridley and Seeley (1979), McClure and Vita-Finzi (1982), and Gardner (1988) were calibrated. We consider them as raw and cali-brated them. We observed a standard deviation of the uplift rate of 0.03 mm/yr, which does not changing the trend of the curve in Figure 9b. The elevations of similarly old terraces are different, however. In the northern Arabian Peninsula (Qatar, eastern Saudi Arabia, and United Arab Emirates), the elevation of the terrace samples older than 5 cal ka BP is much lower than that of terraces of the same age in our study area. This could be explained from slightly higher uplift rates in our study area, as is shown in Supplementary Table 3.
The overall uniform uplift rate across the northern and eastern Arabian Peninsula may suggest a uniform uplift mechanism for the late Pleistocene and Holocene. The curve in Figure 9b cannot be explained by a certain fault mechan-ism, as it has been analyzed for similar terraces in other types of plate boundaries (Kontogianni et al., 2002). It is intriguing, however, that the curve of Figure 9b resembles that of
co-seismic and inter-seismic activities as described by Kontogianni et al. (2002). We suggest that dating older ter-races (T3–T6) will contribute to modeling of earthquake cycles at millenial time scale (Thatcher, 1984).
Eastern Al Hajar Mountains uplift mechanisms
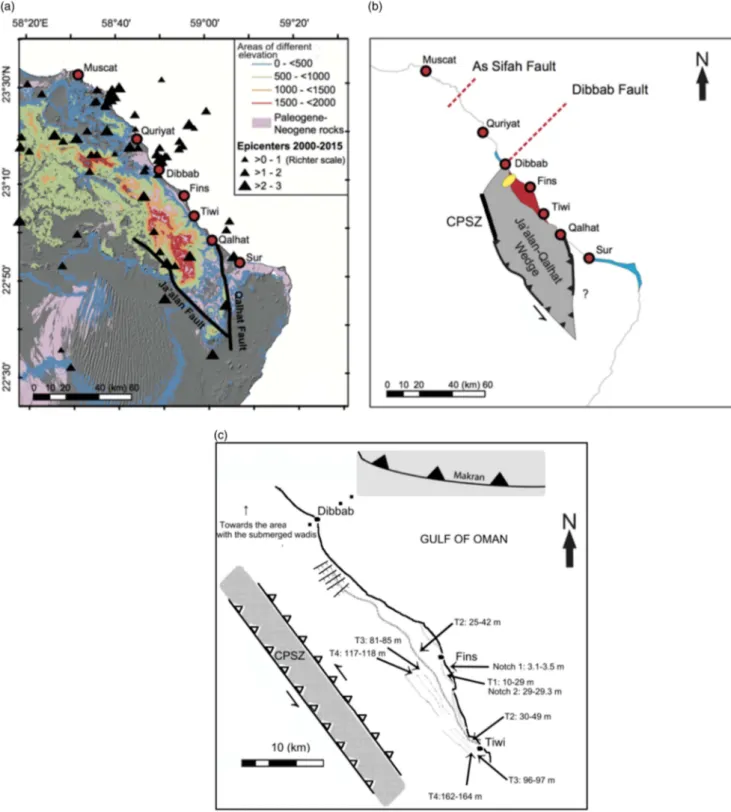
Our study area is located north of two major faults that cre-ated a wedge-shaped block with the hanging wall hosting the marine terraces (Fig. 10a and b). This wedge is delimited in the south by the northwest-striking Ja´alan and the north-northwest-striking Qalhat faults and in the west by the sinistral transpressive CPSZ (Fig. 10b and c). The northern end of the wedge is defined, near As Sifah and/or Dibbab, by two hitherto unmapped northeast-striking faults (“As Sifah and Dibbab faults”; black, dashed lines in Fig. 10b). The low-scale earthquake epicenters (between 2000 and 2015, 3 km< depth <12 km; Richter magnitude M ≤ 3) define the As Sifah and Dibbab faults. Moreover, the epicenters cluster at the margins of the wedge (Fig. 10a). Thefive newly foundnortheast-striking normal faults (see “Geomorphologic
observations in the terraces”) are closely located and oriented parallel to the Dibbab Fault (elliptical area, shaded with squares in Fig. 10b). Similarly, Kusky et al. (2005) referred to northeast-striking faults in the Gulf of Oman near Dibbab (Fielding et al., 2001) without pointing to those deduced here. The Qalhat Fault separates Cenozoic sedimentary rocks in its footwall from Neoproterozoic basement rocks in its hanging wall, marking this important fault as one with a long history, at least prior the late Cre-taceous contractional event (Filbrandt et al., 1990). The reactivation of the fault wedge is related to the overall northeast-southwest compression and the Zagros continent-continent collision zone between Arabia and Eurasia (Fournier et al., 2006; Scharf et al., 2016), also taking into account the displacement of mid-Miocene rocks (Wyns et al., 1992a). The wedge was uplifted to the south, while no substantial uplift is recorded at its northern end. The wedge must be bordered along the Dibbab or As Sifah faults in the north (Fig. 10b). Hansman et al. (2017) sug-gested an alternative uplift mechanism that is not related to compression in the subduction zone but to shortening of the lithosphere due to a slowdown of subduction in the Zagros-Makran subduction zone. The present study cannot support either of the two mechanisms. It is certain that the planation
surface has been exposed due to Ja´alan-Qalhat Wedge
activation during the Miocene period.
The identical uplift rates suggest a possible uniform mechanism along the whole northern to northeastern coast of Arabian Peninsula. This is corroborated by the fact that similar recent terraces have developed near Sur and Dibbab with only 200 m relief of Paleocene rocks (contrary to the ~2,000 m near our study area). Several theories for younger uplift mechanisms (late Miocene–Quaternary) exist. The theory suggested by Kusky et al. (2005) and Yuan et al. (2016) and represented in Hansman et al. (2017) is that uplift of the Al Hajar Mountains is related to their current location on the active forebulge on the downgoing Arabian Plate in the Arabia/Eurasia collision zone. Uplift of>500 m on flex-ural bulges on continental lithosphere ~150 km before the plates enter the trenches is well-documented worldwide (e.g., Watts et al., 1982; Burke et al., 1986; Bradley and Kusky, 1986; Baarli, 1990; Bradley and Kidd, 1991). This mechan-ism can explain the abundant northwest- and north-north-west-striking coast-parallel faults, and the partitioning into different fault blocks (Ja'alan-Qalhat Wedge; Fig. 10b) by the crosscutting northeast-striking faults (Kusky et al., 2005). It also explains the enormous Cenozoic basin off the Batinah Coast (Fig. 15) in Al-Lazki et al., 2002), which is situated on the down-bending part of the bulge. The basin would repre-sent a flexural extension basin of the upper continental crust bending towards the Zagros-Makran subduction zone (cf. Bradley and Kidd, 1991). Thus, we are encouraged to attribute uplift in our study to a large extent to forebulge
mechanics, especially regarding the higher terraces
T3 to T6, which show a higher elevation “step” and an
older hydrographic network than the lower terraces
Figure 9.(a) Map illustrating the distribution of the localities of dated samples from 1, Ridley and Seeley (1979); 2–6, McClure and Vita-Finzi (1982); 7–15, Wood et al. (2012); 16–17, Gardner (1988); 18–23, present study. (b) Uplift rates calculated from the previous publications normalized to the same eustatic sea-level curve (Siddall et al., 2003; Rohde, 2011). The type of dating technique, 2σ for the age result, and the uplift rate (wherever given) are presented in Supplementary Table 3. Error bars indicate 2σ. Gray dashed line shows the variability trend.
(see “Geomorphologic observations in the terraces”). This argument may be strengthened if Pliocene and older terrace ages can be demonstrated, as they would be coeval with the
age of the forebulge of the Makran zone (Wyns et al., 1992a; Rodgers and Gunatilaka, 2002; Kusky et al., 2005; Hansman et al., 2017).
Figure 10.(color online) (a) Outcrops of Cenozoic rocks and relief. Triangles show the earthquake epicenters of 2000–2015 and the (1) Qalhat and (2) Ja´alan faults are depicted. (b) Schematic sketch of the Ja´alan-Qalhat Wedge. Black shaded areas indicate exposed Cenozoic rocks at low elevation. The striped pattern shows area with higher uplifted terraces (study area). Square shaded ellipse depicts the area with normal faults 1–6 (Supplementary Table 2). The uplifted area is part of the Ja’alan-Qalhat Wedge with its westernmost boundary of the Coastal Parallel Shear Zone (CPSZ). (c) Map showing the study area from the assumed Dibbab Fault to Tiwi, including marine terraces and their elevations, and new mapped extensional faults. The Coastal Parallel Zone (CPSZ) with sinistral mode is shown. The trench of the Makran subduction zone (gray background) is 160 km further to the north-northwest. The area of the submerge wadis is 15 km north from Dibbab.
The forebulge mechanism cannot solely explain the late Pleistocene to mid-Holocene uniform uplift rate in Qatar, eastern Saudi Arabia, the United Arab Emirates, and our study area. Manaman et al. (2011) and Motaghi et al. (2017) demonstrated a shallow dip angle of the Arabian Plate and stagnation in the Zagros collision zone, which does not sup-port a forebulge mechanism for the northern Arabian Penin-sula. Slab stagnation in the Zagros collision zone may be similar to the slab slowdown, as suggested by Hansman et al. (2017) for the late Eocene doming of the Saih Hatat and Jabal Akhdar areas. We speculate that our results for the younger terraces argue for another recent mechanism for the uniform uplift. The slowdown of subduction in the Zagros-Makran zone may be a candidate. At the regional scale, the Ja ´alan-Qalhat Wedge and the CPSZ could have been tectonically reactivated by the slab slowdown. This respective uplift could have occurred during the late Pleistocene to mid-Holocene, based on the notch 1 formation and coral reef preservation. Other mechanisms of less regional effect may be isostatic rebound of the Arabian crust in response to the erosion of the Al Hajar Mountains and/or salt doming (Wood et al., 2012).
In summary, we argue that the marine terraces in our study area have been uplifted by a combination of at least two older mechanisms that have been active for a long time (block uplift and bulging) and were complemented more recently (late Pleistocene to Holocene) by a possible slab slowdown.
CONCLUSIONS
This study describes thefirst systematic and interdisciplinary analysis of marine terraces in the area between Tiwi and Fins (northeast Oman). The uplift rates and the geomorphologic features of the study area point to a variability in spatial and temporal scale of the geologic history of the eastern Al Hajar Mountains. Significant findings are as follows.
(1) The microscopic and geomorphological characteristics revealed that T2 and T1 showed temporally variable uplift rates. Uplift in T2 was not able to preclude sea-transgression events, while, for T1, the uplift effectively removed the coral reef and notch 2 from the eustatic sea level. Preservation of notch 1 at the crest of T1 implies a co-seismic uplift within the mid-Holocene.
(2) The spatial variability of the uplift is identified along the strike of the marine terraces. The Ja´alan-Qalhat Wedge shows higher uplift towards Tiwi and less uplift towards Fins. This spatial variability is constrained by the Dibbab and As Sifah faults and the Ja´alan-Qalhat Wedge, which are bounding probably large crustal blocks. The northwest limit of this wedge is the CPSZ. (3) The complex uplift history of the northeastern Arabian Peninsula and the development of the most extensive marine terraces began by initiation of the Zagros-Makran subduction and the reactivation of the northwest-striking Ja´alan and the north-northwest-striking Qalhat faults and in the west of the sinistral transpressive CPSZ. This event created the planation
surface in our study area. Flexural uplift due to the Arabian Plate bending beneath the Makran zone may have also contributed in the uplift, creating distinctive terraces of higher elevation,“step-like” terraces T3-T6. The coeval age of T3 and of higher terraces to the flexural bending is still to be proved.
(4) The uniform uplift in the eastern Arabian Plate during the late Pleistocene to mid-Holocene indicates a common cause other than the forebulge. A possible candidate mechanism could be a slab slowdown, which has also reactivated the Ja´alan-Qalhat Wedge and the CPSZ.
ACKNOWLEDGMENTS
We thank technician Hamdan Al Zidi of Sultan Qaboos University for preparation of thin sections and the Center of Analytical Applied Unit (CAARU) at Sultan Qaboos University for the SEM-EDX analyses. The transportation costs were covered by Sultan Qaboos University. We truly appreciate the critical manuscript review and guidance by Drs. Vasiliki Mouslopoulou, John Begg, and Kosmas Pavlopoulos. The reference points for the topographic survey were supplied by the National Survey Authority of the Sultanate of Oman. This project was supported by the Fundamental Research Funds for the Central Universities, China University of Geosciences (Wuhan), Project No. CUGCJ1709. Finally, we are thankful for the two anonymous reviewers.
SUPPLEMENTARY MATERIALS
To view supplementary material for this article, please visit https://doi.org/10.1017/qua.2018.51
REFERENCES
Agard, P., Omrani, J., Jolivet, L., Mouthereau, F., 2005. Conver-gence history across Zagros (Iran): constraints from collisional and earlier deformations. International Journal of Earth Sciences 94, 401–419.
Al Hatrushi, M.S., 2017. Morphology of the raised shore platforms along the coastline between Daghmar and Dhabab, Sultanate of Oman. Journal of Arts and Social Sciences 8, 13–24. Al-Lazki, I.A., Seber, D., Sandvol, E., 2002. A crustal transect
across the Oman Mountains on the eastern margin of Arabia. GeoArabia 7, 47–77.
Ali, M., Al Bahri, Q.A., Al Harthy, A., 2016. Gravity Experiment in Oman for Exposing a Basin. Bahria University Research Journal of Earth Sciences 1, 24–27.
Baarli, B.G., 1990. Peripheral bulge of a foreland basin in the Oslo region during the Early Silurian. Paleogeography, Paleoclima-tology, Paleoecology 78, 149–161.
Berger, J.F., Charpentier, V., Crassard, R., Martin, C., Davtian, G., Lopez-Saez, J.A., 2013. The dynamics of mangrove ecosystem, changes in sea level and the strategies of Neolithic settlements along the coast of Oman (6000–3000 cal. BC). Journal of Archaeological Science 40, 3087–3104.
Biagi, P., 1994. A radiocarbon chronology for the aceramic shell-middens of coastal Oman. Arabian Archaeology and Epigraphy 5, 17–31.
Bird, M.I., Austin, W.E.N., Wurster, C.M., Fifeld, L.K., Mojtahid, M., Sargeant, C., 2010. Punctuated eustatic sea-level rise in the early mid-Holocene. Geology 38, 803–806.
Blechschmidt, I., Matter, A., Preusser, F., Rieke-Zapp, D., 2009. Monsoon triggered formation of Quaternary alluvial megafans in the interior of Oman. Geomorphology 110, 128–139.
Bradley, D.C., Kidd, W.S.F., 1991. Flexural extension of the upper continental crust in collisional foredeeps. Geological Society of America Bulletin 103, 1416–1438.
Bradley, D.C., Kusky, T.M., 1986. Geologic methods of estimating convergence rates during arc-continent collision. Journal of Geology 94, 667–681.
Bronk Ramsey, C., 2009. Bayesian analysis of radiocarbon dates. Radiocarbon 51, 337–360.
Burke, K., Kidd, S.F.W., Kusky, M.T., 1986. Archean foreland basin tectonics in the Witwatersrand, South Africa. Tectonics 5, 439–456. Burns, S.J., Fleitmann, D., Matter, A., Neff, U., Mangini, A., 2001. Speleothem evidence from Oman for continental pluvial events during interglacial periods. Geology 29, 623–626.
Dickson, A.P., 1986. Preliminary Assessment of the Earthquake Hazard in the Sultanate of Oman. Consultancy Mission Report Prepared for the Sultanate of Oman and the United Nations Development Program (UNDP), Ministry of Communication Sultanate of Oman, Muscat.
Evans, G., Schmidt, V., Bush, P., Nelson, H., 1969. Stratigraphy and geologic history of the sabkha, Abu Dhabi, Persian Gulf. Sedimentology 12, 145–159.
Fielding, L., Ozdogan, M., Al-Malki, A., El-Baz, F., Kusky, T., 2001. Remote sensing of groundwater upwellings off the northeastern coast of Oman by Landsat thermal data. Geological Society of America, Abstracts with Programs 33, A346. Filbrandt, J.B., Nolan, S.C., Ries, A.C., 1990. Late Cretaceous and
early Tertiary evolution of Jebel Ja´alan and adjacent areas, NE Oman. In: Robertson A.H.F., Searle, M.P., Ries, A.C. (Eds.), The Geology and Tectonics of the Oman Region, Geological Society, London, Special Publications 49, 697–714.
Fleitmann, D., Burns, S.J., Mangini, A., Mudelsee, M., Kramers, J., Villa, I., Neff, U., et al., 2007. Holocene ITCZ and Indian monsoon dynamics recorded in stalagmites from Oman and Yemen (Socotra). Quaternary Science Reviews 26, 170–188. Fournier, M., Lepvrier, C., Razin, P., Jolivet, L., 2006. Late
Cretaceous to Paleogene Post-obduction extension and subse-quent Neogene compression in the Oman Mountains. GeoArabia 4, 17–40.
Fuchs, M., Buerkert, A., 2008. A 20 ka sediment record from the Hajar Mountain range in N-Oman, and its implication for detecting arid–humid periods on the southeastern Arabian Peninsula. Earth and Planetary Science Letters 265, 546–558. Gardner, R.A.M., 1988. Aeolianites and marine deposits of the
Wahiba sands. Character and Paleoenvironments. Journal of Oman Studies, Special Report 3, 75–94.
Gavillot, Y., Axen, G.J., Stockli, D.F., Horton, B.K., Fakhari, D., 2010. Timing of thrust activity in the High Zagros fold-thrust belt, Iran, from (U-Th)/He thermochronology. Tectonics 29, T4025. http://dx.doi.org/10.1029/2009TC002484.
Gharibreza, M., 2016. Evolutionary trend of paleoshorelines in the Coastal Makran zone (Southeast Iran) since the mid-Holocene. Quaternary International 392, 203–212.
Goffé, B., Michard, A., Kienast, J.R., LeMer, O., 1988. A case of obduction related high P, low T metamorphism in upper crustal nappes, Arabian continental margin, Oman: P-T paths and kinematic interpretation. Tectonophysics 151, 363–386. Hacker, B.R., Mosenfelder, J.L., Gnos, E., 1996. Rapid
emplace-ment of the Oman ophiolite: thermal and geochronical constrains. Tectonics 15, 1230–1247.
Hansman, J.R., Ring, U., Thomson, N.S., den Brok, B., Stübner, K., 2017. Late Eocene uplift of the Al Hajar Mountains, Oman, supported by stratigraphy and low-temperature thermochronol-ogy. Tectonics, 36. http://dx.doi.org/10.1002/2017TC004672. Hoffmann, G., Rupprechter, M., Mayrhofer, C., 2013. Review of the
long-term coastal evolution of North Oman – subsidence versus uplift. Zeitschrift der Deutschen Gesellschaft für Geowis-senschaften 164, 237–252.
Khadivi, S., Mouthereau, F., Barbarand, J., Adatte, T., Lacombe, O., 2012. Constraints on paleodrainage evolution induced by uplift and exhumation on the southern flank of the Zagros-Iranian Plateau. Journal of the Geological Society, London 169, 83–97. Kontogianni, V., Tsoulos, N., Stiros, C.S., 2002. Coastal uplift,
earthquakes and active faulting of Rhodes Island (Aegean Arc): modeling based on geodetic inversion. Marine Geology 186, 299–317.
Kusky, T., Robinson, C., El-Baz, F., 2005. Tertiary-Quaternary faulting and uplift in the northern Oman Hajar Mountains. Journal of the Geological Society, London 162, 871–888. Laborel, J., Laborel-Deguen, F., 1994. Biological indicators of
relative sea-level variations and co-seismic displacements in the Mediterranean region. Journal of Coastal Research 10, 395–415.
Le Métour, J.F., Villey, M., Gramont, X., 1986. Geological map of Quryat sheet NF, 40-4D scale 1:100,000. Directorate General of Minerals, Oman Ministry of Petroleum and Minerals, Muscat. Lippard, S.J., Shelton, A.W., Gass, I.G., 1986. The Ophiolite of
Northern Oman. Geological Society of London, Memoir 11. Blackwell Scientific Publications, Oxford.
Manaman, N.S., Shomali, H., Koyi, H., 2011. New constraints on upper-mantle S-velocity structure and crustal thickness of the Iranian plateau using partitioned waveform inversion. Geophysi-cal Journal International 184, 247–267.
Mancini, M., D’Anastasio, E., Barbieri, M., De Martini, P.M., 2007. Geomorphological, paleontological and 87Sr/86Sr isotope ana-lyses of early Pleistocene paleoshorelines to define the uplift of Central Apennines (Italy). Quaternary Research 67, 487–501. Mann, A., Hanna, S.S., Nolan, S.C., 1990. The post-Campanian
tectonic evolution of the Central Oman Mountains: tertiary extension of the Eastern Arabian Margin. In: Robertson, A.H.F., Searle, M.P., Ries, A.C. (Eds.) The Geology and Tectonics of the Oman Region, Geological Society, London, Special Publications 49, 285–305.
Mattern, F., Moraetis, D., Abbasi, I., Al Shukaili, B., Scharf, A., Claereboudt, M., Looker, E., Al Haddabi, N., Pracejus, B., 2018. Coastal dynamics of uplifted and emerged Late Pleistocene near-shore coral patch reefs at Fins (eastern coastal Oman, Gulf of Oman). Journal of African Science 138, 192–200.
Mattern, F., Scharf, A., 2018. Postobductional extension along and within the Frontal Range of the Eastern Oman Mountains. Journal of Asian Earth Sciences 154, 369–385.
McClure, H.A., Vita-Finzi, C., 1982. Holocene shorelines and tectonic movements in eastern Saudi Arabia. Tectonophysics 85, T37–T43.
Monthereau, F., 2011. Timing of uplift in the Zagros belt/Iranian plateau and accommodation of late Cenozoic Arabia-Eurasia convergence. Geological Magazine 148, 726–738.
Motaghi, K., Shabanian, E., Tatar, M., Cuffaro, M., Doglioni, C., 2017. The south Zagros suture zone in teleseismic images. Tectonophysics 694, 292–301.
Mount, V.S., Crawford, R.I.S., Bergman, S.C., 1998. Regional Structural style of the Central and Southern Oman Mountains:
Jabal Akhdar, Saih Hatat and the Northern Ghaba Basin. GeoArabia 3, 475–490.
Mouslopoulou, V., Begg, J., Nicol, A., Oncken, O., Prior, C., 2015a, Formation of Late Quaternary paleoshorelines in Crete, Eastern Mediterranean. Earth and Planetary Science Letters 431, 294– 307.
Mouslopoulou, V., Nicol, A., Begg, J., Oncken, O., Moreno, M., 2015b, Clusters of megaearthquakes on upper plate faults control the Eastern Mediterranean hazard. Geophysical Research Letters 42, 10282–10289.
Mouslopoulou, V., Oncken, O., Hainzl, S., Nicol, A., 2016. Uplift rate transients at subduction margins due to earthquake clustering. Tectonics 35, 2370–2384.
Nolan, S.C., Skelton, P.W., Clissold, B.P., Smewing, J.D., 1990. Maastrichtian to Early Tertiary stratigraphy and paleogeography of the Central and Northern Oman Mountains. In: Robertson, A.H.L., M.P. Searle, Ries, A.C. (Eds.) The Geology and Tectonics of the Oman Region, Geological Society London Special Publication 49, 495–520.
Pavlopoulos, K., Kapsimalis, V., Theodorakopoulou, K., Panagiotopoulos, I., 2012. Vertical displacement trends in the Aegean coastal zone (NE Mediterranean) during the Holocene assessed by geo-archeological data. Holocene 22, 717–728. Pedoja, K., Bourgeois, J., Pinegina, T., Higman, B., 2006. Does
Kamchatka belong to North America? An extruding Okhotsk block suggested by coastal neotectonics of the Ozernoi Peninsula, Kamchatka, Russia. Geology 34, 353–356.
Pedoja, K., Husson, L., Johnson, E.M., Melnick, D., Witt, C., Pochat, S., Nexer, M., et al., 2014. Coastal staircase sequences reflecting sea-level oscillations and tectonic uplift during the Quaternary and Neogene. Earth Science Reviews 132, 13–38. Pedoja, K., Husson, L., Regard, V., Cobbold, P.R., Ostanciaux, E.,
Johnson, M.E., Kershaw, S., et al., 2011. Relative sea-level fall since the last interglacial stage: are coasts uplifting worldwide? Earth Science Reviews 108, 1–15.
Pirazzoli, P., 1986. Marine notches. In: van der Plassche, O. (Ed.), Sea-level Research: A Manual for the Collection and Evaluation of Data. GeoBooks, Norwich, pp. 361–399.
Pirazzoli, P.A., Laborel, J., Stiros, S.C., 1996. Earthquake clustering in the Eastern Mediterranean during historical times. Journal of Geophysical Research 101, 6083–6097.
Pirazzoli, P., Stiros, S.C., Arnold, M., Papageorgiou, S., 1994. Episodic uplift deduced from Holocene shorelines in the Perachora peninsula, Corinth area, Greece. Tectonophysics 229, 201–209.
Poupeau, G., Saddiqi, O., Michard, A., Goffé, B., Oberhänsli, R., 1998. Late thermal evolution of the Oman Mountains subophio-litic windows: apatite fission-track thermochronology. Geology 26, 1139–1142.
Preston, W.G., Thomas, S.G.D., Goudie, S.A., Atkinson, A.C.O., Leng, J.M., Hodson, J.M., Walkington, H., et al., 2015. A multi-proxy analysis of the Holocene humid phase from the United Arab Emirates and its implications for southeast Arabia’s Neolithic populations. Quaternary International 382, 277–292. Radies, D., Hasiotis, S.T., Preusse, F., Neubert, E., Matter, A.,
2005. Paleoclimatic significance of the Early Holocene faunal assemblages in wet interdune depositions of the Wahiba Sand Sea, Sultanate of Oman. Journal of Arid Environments 62, 109–125.
Regard, V., Saillard, M., Martinod, J., Audin, L., Carretier, S., Pedoja, K., Riquelme, R., Paredes, P., Hérail, G., 2010. Renewed uplift of the Central Andes Forearc revealed by coastal evolution
during the Quaternary. Earth and Planetary Science Letter 297, 199–210.
Reimer, P.J., Bard, E., Bayliss, A., Beck, J.W., Blackwell, P.G., Bronk Ramsey, C., Grootes, P.M., et al., 2013. IntCal13 and Marine13 Radiocarbon Age Calibration Curves 0–50,000 Years cal BP. Radiocarbon 55, 1869–1887.
Reuter, H.I, Nelson, A., Javris, A., 2007. An evaluation of void filling interpolation methods for SRTM data. International Journal of Information Science 21, 983–1008.
Ridley, A.P., Seeley, W.M., 1979. Evidence of recent coastal uplift near Al Jubail Saudi Arabia. Tectonophysics 52, 319–327. Rodgers, D.W., Gunatilaka, A., 2002. Bajada formation by
monsoonal erosion of a subaerial forebulge, Sultanate of Oman. Sedimentary Geology 154, 127–146.
Rohde, R.A., 2011. Composite Sea-level Curves (accessed March 2018). https://www.e-education.psu.edu/earth107/node/908. Saddiqi, O., Michard, A., Goffé, B., Poupeau, G., Oberhänsli, R.,
2006. Fission-track thermochronology of the Oman Moun-tains continental widows, and current problems of tectonic interpretation. Bulletin de la Societe Geologique de France 3, 127–134.
Sadler, P.M., 1981. Sediment accumulation rates and the complete-ness of stratigraphic sections. The Journal of Geology 89, 569– 584.
Scharf, A., Mattern, F., Al Sadi, S., 2016. Kinematics of Post-obduction Deformation of the Tertiary Ridge at Al-Khod Village (Muscat Area, Oman). Sultan Qaboos University Journal for Science 21, 26–40.
Searle, M.P., Malpas, J., 1980. Structure and metamorphism of rocks beneath the Semail ophiolite of Oman and their significance in ophiolite obduction. Transactions of the Royal Society of Edinburgh 71, 247–262.
Shackleton, N.J., 1987. Oxygen isotopes, ice volume and sea level. Quaternary Science Review 6, 183–190.
Siddall, M., Rohling, E.J., Almogi-Labin, A., Hemleben, Ch., Meischner, D., Schmelzer, I., Smeed, D.A., 2003. Sea-level fluctuations during the last glacial cycle. Nature 423, 853–858. Southon, J., Kashgarian, M., Fontugne, M., Metivier, B., Yim, W.
W-S., 2002. Marine reservoir corrections for the Indian Ocean and Southeast Asia. Radiocarbon 44, 167–180.
Stiros, S., 1996. Late Holocene relative sea-level changes in SW Crete: evidence of an unusual earthquake cycle. Annali Di Geofisica 39, 677–687.
Stiros, S.C., Arnold, M., Pirazzoli, P.A., Laborel, J., Laborel, F., Papageorgiou, S., 1992. Historical coseismic uplift on Euboea island, Greece. Earth and Planetary Science Letters 108, 109–117.
Stiros, C.S., Laborel, J., Laborel-Deguen, F., Morhange, C., 2011. Quaternary and Holocene coastal uplift in Ikaria Island, Aegean Sea. Geodinamica Acta 24, 123–131.
Thatcher, W., 1984. The earthquake deformation cycle, recurrence, and the time-predictable model. Journal of Geophysical Research 89, 5674–5680.
Vernant, P., Nilforoushan, F., Hatzfeld, D., Abassi, M.R., Vigny, C., Masson, F., Nankali, H., et al., 2004. Present-day crustal deformation and plate kinematics in the Middle East constrained by GPS measurements in Iran and northern Oman. Geophysical Journal International 157, 381–398.
Watts, A.B., Karner, G.D., Steckler, M.S., 1982. Lithospheric flexure and the evolution of sedimentary basins. Philosophical Transactions of the Royal Society A, 305. doi: 10.1098/ rsta.1982.0036
White, S.R., 1984. Active and passive plate boundaries around the Gulf of Oman, North-West Indian Ocean. Deep Sea Research Part A. Oceanographic Research Papers 31, 731–745.
Wood, W.W., Bailey, R.M., Hampton, B.A., Kraemer, T F., Lu, Z., Clark, D.W., James, R.H.R., Al Ramadan, K., 2012. Rapid Late Pleistocene/Holocene Uplift and Coastal Evolution of the Southern Arabian (Persian) Gulf. Quaternary Research 77, 215–220.
Wyns, R., Bechennec, F., Metour, J., Le, R.J., 1992a. Geological map of Tiwi sheet NF, 40-8B scale 1:100,000. Directorate General of Minerals, Oman Ministry of Petroleum and Minerals, Muscat.
Wyns, R., Bechennec, F., Metour, J., Le, R.J., Chevrel, S., 1992b. Geological map of Sur sheet, NF, 40-08 scale 1:250,000. Directorate General of Minerals, Oman Ministry of Petroleum and Minerals, Muscat.
Xu, X., Khosh, M.S., Druffel-Rodriguez, K.C., Trumbore, S.E., Southon, J.R., 2010. Is the consensus value of ANU sucrose (IAEA C-6) too high? Radiocarbon 52, 866–874.
Xu, X., Shen, C., Stills, K.A., Southon, R.J., 2013. Homogeneity evaluation of Chinese sugar carbon (CSC) standard for AMS14C measurement. Nuclear Instruments and Methods in Physics Research B 294, 430–434.
Yuan, Y., Kusky, T.M., Rajendran, S., 2016. Tertiary and Quaternary marine terraces and planation surfaces of Northern Oman: interaction offlexural bulge migration associated with the Arabian-Eurasian collision and eustatic sea level changes. Journal of Earth Science 27, 955–970.
Zazzo, A., Munoz, O., Saliège, J.-F., Moreau, C., 2012. Variability in the marine radiocarbon reservoir effect in Muscat (Sultanate of Oman) during the 4th millennium BC: reflection of taphonomy or environment? Journal of Archaeological Science 39, 2559–2567.