HIGHLIGHTED TOPIC
Analogs of Microgravity: Space Research without Leaving
the Planet
Greater loss in muscle mass and function but smaller metabolic alterations in
older compared with younger men following 2 wk of bed rest and recovery
Rado Pišot,1Uros Marusic,1Gianni Biolo,2Sara Mazzucco,2Stefano Lazzer,3Bruno Grassi,3 XCarlo Reggiani,4Luana Toniolo,4Pietro Enrico di Prampero,3Angelina Passaro,5Marco Narici,6 Shahid Mohammed,6Joern Rittweger,7Mladen Gasparini,8Mojca Gabrijelcˇicˇ Blenkusˇ,9and Boštjan Šimunicˇ1
1Institute for Kinesiology Research, Science and Research Centre, University of Primorska, Koper, Slovenia;2Department of
Medical, Surgical and Health Sciences, Division of Internal Medicine, University of Trieste, Trieste, Italy;3Department of
Medical and Biological Sciences, University of Udine, Udine, Italy;4Department of Biomedical Sciences, University of
Padua, Padua, Italy;5Department of Medical Sciences, Section of Internal and Cardiorespiratory Medicine, University of
Ferrara, Ferrara, Italy;6MRC/ARUK Centre for Musculoskeletal Ageing Research, University of Nottingham, Derby Royal
Hospital, Derby, United Kingdom;7Institute of Aerospace Medicine, German Aerospace Center (DLR), Cologne, Germany; 8Department of Vascular Surgery, General Hospital Izola, Izola, Slovenia; and9National Institute of Public Health of the
Republic of Slovenia, Ljubljana, Slovenia
Submitted 8 October 2015; accepted in final form 24 January 2016
Pišot R, Marusic U, Biolo G, Mazzucco S, Lazzer S, Grassi B, Reggiani C, Toniolo L, di Prampero PE, Passaro A, Narici M, Mohammed S, Rittweger J, Gasparini M, Gabrijelcˇicˇ Blenkusˇ M, Šimunicˇ B. Greater loss in muscle mass and function but smaller
metabolic alterations in older compared with younger men following 2 wk of bed rest and recovery. J Appl Physiol 120: 922–929, 2016. First published January 28, 2016; doi:10.1152/japplphysiol.00858.2015.— This investigation aimed to compare the response of young and older adult men to bed rest (BR) and subsequent rehabilitation (R). Sixteen older (OM, age 55-65 yr) and seven young (YM, age 18 –30 yr) men were exposed to a 14-day period of BR followed by 14 days of R. Quadriceps muscle volume (QVOL), force (QF), and explosive power (QP) of leg extensors; single-fiber isometric force (Fo); peak aerobic power (V˙O2peak); gait stride length; and three metabolic parameters,
Matsuda index of insulin sensitivity, postprandial lipid curve, and homocysteine plasma level, were measured before and after BR and after R. Following BR, QVOL was smaller in OM (⫺8.3%) than in YM (⫺5.7%, P ⫽ 0.031); QF (⫺13.2%, P ⫽ 0.001), QP (⫺12.3%, P ⫽ 0.001), and gait stride length (⫺9.9%, P ⫽ 0.002) were smaller only in OM. Fo was significantly smaller in both YM (⫺32.0%) and OM (⫺16.4%) without significant differences between groups. V˙O2peakdecreased more in OM (⫺15.3%) than in YM (⫺7.6%, P ⬍
0.001). Instead, the Matsuda index fell to a greater extent in YM than in OM (⫺46.0% vs. ⫺19.8%, respectively, P ⫽ 0.003), whereas increases in postprandial lipid curve (⫹47.2%, P ⫽ 0.013) and homocysteine concentration (⫹26.3%, P ⫽ 0.027) were ob-served only in YM. Importantly, after R, the recovery of several parameters, among them QVOL, QP, and V˙O2peak, was not
com-plete in OM, whereas Fo did not recover in either age group. The results show that the effect of inactivity on muscle mass and function is greater in OM, whereas metabolic alterations are greater in YM. Furthermore, these findings show that the recovery of preinactivity conditions is slower in OM.
aging; prolonged physical inactivity; functional decline; recondition-ing
NEW & NOTEWORTHY
We compared the responses of older and young men to 14 days of bed rest and subsequent rehabilitation. The effect of inac-tivity on muscle mass and function (muscle force and power, fiber strength, and V˙O2peak) was greater in older men, whereas metabolic alterations (insulin sensitivity, postprandial lipid curve, and homocysteine levels) were greater in young men. Recovery of preinactivity conditions occurred more slowly in older men. The results emphasize the importance of avoiding or minimizing periods of inactivity in old age.
PHYSICAL INACTIVITY OF ELDERLY people is a relevant health
problem because its deleterious effects involve not only muscle mass and function (22), but also energy metabolic balance (21, 24) and cardiovascular function (4). A sudden decrease in physical activity can also significantly worsen health already impaired by the aging process. In this perspective, the negative effect of hospitalization on the health of elderly people (19a) could be partly explained by the disease-related problems and changes in their daily habits (8), but it also could be due to a sudden reduction in physical activity.
Because of their clinical implications, the effects of physical inactivity in older subjects have been widely studied in the last years. Bed rest (BR) protocol, which was originally designed to study the effect of microgravity during space flight (30), offers a realistic and useful model for studying the effect of decreased physical activity and muscle disuse experienced by bedridden patients. A number of BR experiments with older subjects have been carried out in the last 10 yr (6, 12, 14, 15, 22, 23, 36). Taking into account the risk of throm-boembolic complications (4), alternative protocols that are less systemically hazardous, such as unilateral leg
immobi-Address for reprint requests and other correspondence: B. Grassi, Dept. of Medical and Biological Sciences, Univ. of Udine, Piazzale M. Kolbe 4, I-33100 Udine, Italy (e-mail: [email protected]).
lization (17, 34) or unilateral leg suspension (11, 18, 19) also have been applied in older subjects. These latter exper-imental protocols proved to be very useful for studying changes in muscle mass, strength, or single muscle fiber properties, but they are less convenient for exploring met-abolic and other systemic changes induced by prolonged inactivity (39). The results obtained were to some extent controversial. In elderly subjects, prolonged disuse was found to be associated with an accelerated age-related de-terioration of neuromuscular function (34, 38) in the lower contractile properties of vastus lateralis single muscle fibers (17–19) and isometric contractile performance of quadriceps muscle (34). Other studies, however, showed that only high-velocity muscle actions are differentially affected (11) or that changes in maximal isometric and dynamic muscle strength are similar in young and elderly subjects (17). Earlier BR studies (12, 14, 15, 22, 23) involving older adults showed significant loss in muscle mass, strength, and power, and maximal aerobic power. The decline in muscle mass was explained by impaired amino acid transport and by altered mammalian target of rapamycin (mTOR)-related signaling (14) and was accompanied by altered IL-6 and toll-like receptor 4 (TLR4) expression (15). Those studies, however, lacked a control group of younger individuals and did not consider the rehabilitation or recovery phase. Both these issues were considered in a recent study (36) in which a group of 9 older and 14 younger subjects were exposed to the same protocol, consisting of 5 days of BR followed by 8 wk of rehabilitation based on resistance training. The results showed that 5 days were sufficient for inducing significant atrophy in the older subjects but not in the younger subjects and that 8 wk of rehabilitation also was sufficient for complete recovery in the older subjects. In our view, this important and careful study leaves open several relevant questions. First, how different would be the re-sponses that develop between younger and older subjects over a longer time frame sufficient to induce significant atrophy both groups? In other words, it is still unclear whether the difference between younger and older subjects reported by Tanner et al. (36) is a difference in time course or in severity of the atrophic response to disuse. Second, given that a prolonged rehabilitation phase allows complete recovery both in younger and older subjects (36), can a difference can be detected and assessed in the initial phase of recovery? Finally, BR also involves metabolic and sys-temic adaptations, which deserve to be carefully analyzed and until now were not considered in their comparative aspects in published papers.
All these considerations prompted us to design a BR study in which younger and older participants were exposed to precisely the same protocol of inactivity in bed for 14 days, which is sufficient to induce significant atrophy in both younger and older healthy participants alike. Subjects were also exposed to a subse-quent rehabilitation period with moderate training for a corre-sponding period of 14 days, which likely is enough time to detect a diversity in the recovery response. We hypothesized that a greater deterioration in muscle and metabolic functions would occur in older subjects vs. younger subjects during bed rest, and that the older subjects would experience a slower recovery than the younger subjects during the subsequent rehabilitation period.
METHODS
Participants. Twenty-three healthy men [7 younger (YM, age
18 –30 yr) and 16 older (OM, age 55– 65 yr)] were recruited for the study. All participants underwent medical examination and routine blood and urine analysis. Basic anthropometric parameters of the two groups are reported in Table 1. Exclusion criteria included smoking; regular alcohol consumption; ferromagnetic implants; history of deep vein thrombosis with D-dimer⬎500 g/l; acute or chronic skeletal, neuromuscular, metabolic, and cardiovascular disease conditions; and pulmonary embolism. Participants were informed of the purpose, procedures, and potential risks of the study before signing an informed consent. The study was performed in accordance with the ethical standards of the 1964 Declaration of Helsinki and was approved by the National Ethical Committee of the Slovenian Ministry of Health on April 17, 2012, under the acronym IR-aging 1200.
Study design. The study was conducted in a controlled medical
environment at the Orthopedic Hospital of Valdoltra, Slovenia. Par-ticipants were housed in standard air-conditioned hospital rooms and were under constant surveillance with 24-h medical care. For 14 days, participants performed all daily activities in bed and received euca-lorically controlled meals three times a day. Dietary energy require-ments were designed for each subject multiplying resting energy expenditure by factors 1.2 and 1.4 in BR and ambulatory periods, respectively (1). The resting energy expenditure was calculated as in previous studies (1). The macronutrient content of food was set at 60% carbohydrates, 25% fats, and 15% proteins, according to the scheme of the so called “Mediterranean diet” and adopted in previous BR protocols (1). Energy balance was checked weekly by fat mass assessment. The daily protein intake was 1.1–1.25 g/kg in both groups, in BR and recovery periods, respectively, except a subgroup of OM who received a dietary supplement (see below).
After BR participants underwent a rehabilitation protocol (R) that consisted of 2 wk of a supervised, multimodal exercise program with three sessions per week. In each session, participants performed a 12-min warm-up, 15–20 min of balance and strength training, and 20 –30 min of endurance training. The protocol included two inter-ventions in that eight randomly selected OM followed a daily routine of 45 min of computerized cognitive training by navigating through virtual mazes with the use of a joystick during the BR period. They also received a nutritional support based on 0.4 g whey protein·kg body wt⫺1·day⫺1 at breakfast during the R period. Because no significant differences between the parameters reported in this study were detected between the eight OM who received these interventions and the other eight OM, the two OM groups were pooled for statistical analysis.
Procedures. All assessments were performed at baseline data
collection (BDC) before the beginning of BR, after 14 days of BR (BR14), and on day 14 of R (R⫹14).
Anthropometric determinations consisted of body mass index and fat mass calculation using bioimpedance with a tetrapolar impedance meter (BIA101; Akern, Florence, Italy).
Quadriceps muscle volume (QVOL) of the right leg was measured using turbo spin-echo, T1-weighted, magnetic resonance imaging (MRI) obtained with 1.5 T MRI system (Magnetom Avanto; Siemens
Table 1. Baseline anthropometric parameters for the two groups of participants
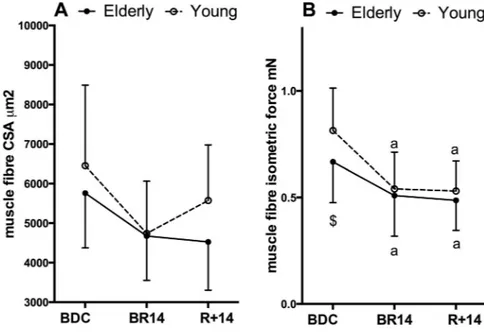
Subject Parameters Younger Older P
Number 7 16
Age, yr 23.1⫾ 2.9 59.6⫾ 3.4 ⬍ 0.001
Stature, m 1.77⫾ 0.07 1.73⫾ 0.05 0.192
Body mass, kg 74.8⫾ 8.8 79.9⫾ 12.3 0.336 Body mass index, kg/m2 24.0⫾ 2.4 26.6⫾ 4.4 0.142
Medical Solution, Erlangen, Germany). On each MRI slice, contours corresponding to the quadriceps muscles were delineated by an expert in MRI imaging using the image processing tool OsiriX (version 4.1.2; Pixmeo Sarl). QVOL was then derived by summing a series of evenly spaced truncated cones between each two axial images, a process that included an average of 25 images (range 23–28) and covered the entire length of the quadriceps.
Peak knee extensors muscle force (QF) of the right leg was estimated from maximal voluntary isometric contraction (MVC) at a 110° knee angle with hip fixed at 90°. Force was measured by an electrical transducer (TSD121C; BIOPAC Systems) with 1-kHz sam-pling frequency implemented on a custom-built chair for isometric contractions of knee extensor muscle groups. After familiarization, participants performed two MVCs with a 2-min rest. The MVC with highest QF was taken into account for further analysis.
Lower limb peak explosive power (QP) of bilateral efforts was determined by means of the Explosive Ergometer described in detail by Lazzer et al. (26). Participants were secured on a seat by a safety belt tightened around shoulders and abdomen, they placed the soles of their feet against the force platforms (LAUMAS PA 300; Parma, Italy), and were asked to accelerate the seat backward by pushing from the force platforms. Before explosive efforts, the knee angle was set at 110°. After familiarization, participants performed four maximal explosive jumps with a 2-min rest in between. The attempt with the highest QP normalized by body weight was taken for further analysis. Peak aerobic power (V˙O2peak) was determined by a graded exercise
test on a mechanically braked cycloergometer (839E; Monark Ergo-medic). During the test, ventilatory and gas exchange responses were measured continuously with a metabolic unit (Quark-b2; Cosmed,
Italy). After determining rest values, participants warmed up at 80 W and thereafter, 20-W increments were imposed every minute until volitional exhaustion. Values obtained at exhaustion were considered peak values and expressed normalized to body weight.
Gait analysis was performed while participants walked at their preferred speed with the 10-m OptoGait system (Microgate, Bolzano, Italy). Each participant walked for 60 s and an average stride length was taken for further analysis.
A simple orthostatic test was performed at BDC and at the very end of BR, measuring heart rate with a strap heart rate monitor (Polar), which allowed continuous recording for 10 min.
Single muscle fiber analysis was performed from samples obtained from the midregion of the left vastus lateralis muscle. Biopsies was performed after anesthesia of the skin, subcutaneous fat tissue, and muscle fascia with 2 ml of lidocaine (2%). A small incision was then made to penetrate skin and fascia, and the tissue sample was harvested with a purpose-built rongeur (Zepf Instruments, Tuttlingen, Ger-many). A part of the sample to be used for single-fiber analysis was quickly placed into storage [high potassium, EGTA, and glycerol solution, see (13)] and stored at⫺20°C, while another part was frozen in isopentane cooled with fluid nitrogen. Single muscle fiber segments were dissected from the samples stored in high potassium, EGTA, and glycerol and mounted in the setup as previously described (13). Cross-sectional area (CSA) was measured from three diameters as-suming a circular shape, and isometric force (Fo) was measured in four subsequent maximal activations (pCa, 4.6; sarcomere length, 2.6 m; temperature, 12°C) see Doria et al. (13).
Insulin sensitivity was assessed in the postprandial condition after a standard meal test (500 ml, 500 kcal, vanilla flavor, Nutricomp; B. Braun) consisting of 15% proteins, 30% fats, and 55% carbohydrates. Blood samples were collected hourly for 6 h after meal load to assess plasma concentrations of insulin, glucose, and triglycerides. Insulin sensitivity in the postprandial condition was assessed using the Mat-suda index or insulin sensitivity index calculated as follows:
10000
兹
glyT0· insT0· insmean· glymeanwhere glyT0is the plasma glucose concentration at baseline; insT0is
the plasma insulin concentration at baseline; glymean is the mean
glucose concentration measured during the 6 h of meal test; insmeanis
the mean insulin concentration measured during the 6 h of meal test; and 10,000 is a constant that provides numbers that are easy to manage and compute.
Changes in concentrations of triglycerides during the first 3-h meal test were assessed calculating the area under the curve (AUC) of triglycerides in plasma concentration vs. time using the linear trape-zoidal method.
Fasting plasma homocysteine concentration was determined as previously reported (27).
Statistical analysis. After assuring normal distribution by visual
inspection (histogram, Q-Q plot) and using the Shapiro-Wilk’s test, the data were analyzed with SPSS 19.0 software (IBM, Chicago, IL). Nonsignificant interactions in 3 (BDC, BR14, R⫹14) ⫻ 3 (YM, OM with interventions, OM without interventions) repeated measurements The general linear model (GLM) led us to proceed with 3 (BDC, BR14, R⫹14) ⫻ 2 (YM, OM) repeated-measures GLM, with time as a within factor and group as a between factor. After establishing significant main effects we performed post hoc analysis with Bonferroni corrections. BDC values were used as covariates in case different BDC values were obtained. Statistical significance for all analyses was set at␣ ⫽ 0.05.
RESULTS
All participants were able to comply with the study protocol. None of the subjects dropped out of the study and no medical complications occurred other than transient hypotension during the 10-min orthostatic tolerance testing on BR14 in seven participants [3 OM (18.8%), 4 YM (57.1%)].
As expected, significant differences were present at BDC between OM and YM. In particular, QVOL was 16.2% lower in OM (1,666⫾ 234 ml) than in YM (1,987 ⫾ 270 ml), P ⫽ 0.010; QF was 19.9% lower in OM (546⫾ 111 N) than in YM (681 ⫾ 115 N), P ⫽ 0.014; and QP was 34.9% lower in OM (32.7 ⫾ 5.76 W/kg) than in YM (50.2 ⫾ 4.54 W/kg), P ⬍ 0.001. V˙O2peakwas⫺31.4% lower in OM than in YM (26.8 ⫾ 4.92 and 39.2 ⫾ 5.06 ml O2·kg⫺1·min⫺1, respectively), P ⬍ 0.001. A significant difference also was detectable in single muscle fibers in that Fo was 33.7% lower in OM (0.667 ⫾ 0.192 mN) compared with YM (0.814 ⫾ 0.099 mN), P ⫽ 0.024; whereas the difference in CSA was below statistical significance (OM, 5,760⫾ 1,383 m2vs. YM, 6,452⫾ 2,036 m2), P⫽ 0.43.
Some differences between older and younger subjects were also detectable at BDC in plasma metabolic parameters. GlyT0 (OM 96 ⫾ 9.9, YM 87 ⫾ 11 mg/dl) and insT0(OM 5.87 ⫾ 4.89, YM 5.14⫾ 2.91 U/ml) were not significantly different in OM compared with YM, whereas significant differences were detectable in plasma lipid concentrations. Plasma cholesterol was 51.1% higher in OM than YM (198⫾ 38 and 131 ⫾ 10 mg/dl, respectively, P ⬍ 0.01), and the same was true for triglycerides that were 110% higher in OM than YM (118⫾ 41 and 56 ⫾ 16 mg/dl, respectively, P ⬍ 0.01). Low-density lipoprotein was 69.6% higher in OM than YM (134⫾ 37 and 79⫾ 13 mg/dl, respectively, P ⬍ 0.01), whereas no significant difference was detectable in high-density lipoprotein levels (OM 40 ⫾ 7, YM 40 ⫾ 6 mg/dl). Finally, a significant difference was detectable in postprandial triglycerides AUC; it was 123% higher in OM compared with YM (OM 393⫾ 140, YM 176 ⫾ 56.9 h·mg⫺1·dl⫺1, respectively, P ⫽ 0.001). No difference was observed in insulin sensitivity as assessed with Matsuda index (see below).
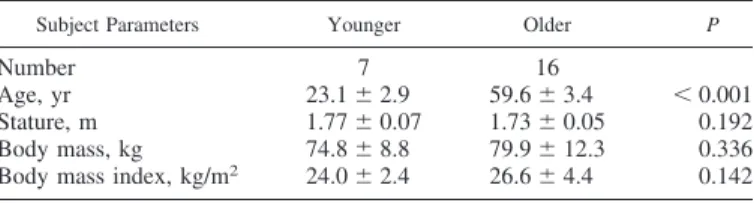
All functional and metabolic parameters measured were affected by BR and rehabilitation. Changes in structural and functional parameters of lower limb muscles are shown in Figure 1. QVOL (Fig. 1A) showed a decrease at BR14 in YM and OM by⫺5.7 ⫾ 3.9% (P ⫽ 0.017) and ⫺8.4 ⫾ 3.7% (P ⬍ 0.001), respectively. Taking into account the existing differ-ence at BDC, QVOL decreased significantly more in OM than in YM at BR14 (P⫽ 0.031) and, moreover, in OM QVOL also remained lower than BDC values at R⫹14 (P ⫽ 0.013). The two parameters expressing the contractile function, QF (Fig. 1B) and QP (Fig. 1C), declined significantly at BR14 only in OM by ⫺13.2 ⫾ 12.4% (P ⬍ 0.001) and ⫺12.3 ⫾ 10.4% (P ⬍ 0.001), respectively. It is important to note that QF at R⫹14 recovered completely, whereas QP remained lower compared with BDC by ⫺7.8 ⫾ 8.9% (P ⫽ 0.009).V˙O2peak (Fig. 2A) decreased significantly at BR14 in YM and OM by ⫺7.6 ⫾ 4.8% (P ⫽ 0.007) and ⫺15.3 ⫾ 11.0% (P ⬍
0.001), respectively. At R⫹14 V˙O2peakwas fully recovered in YM, whereas in OM it remained lower compared with BDC values (⫺9.3 ⫾ 13.4%, P ⫽ 0.020) and was different than in YM. Gait stride length (Fig. 2B) decreased only in OM at BR14 (⫺9.9 ⫾ 11.3%, P ⫽ 0.002) but it was fully recovered at R⫹14.
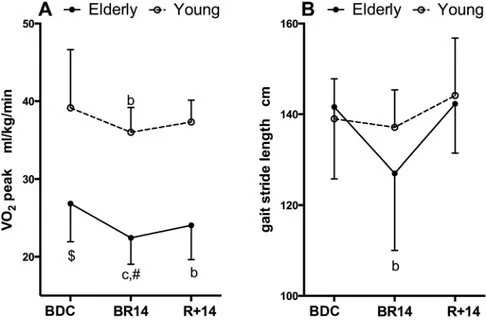
Single-fiber CSA showed a BR-related decrease that did not reach statistical significance because of the large interindi-vidual variability (Fig. 3A). In contrast, isometric force, Fo (Fig. 3B), showed a marked and significant decrease at BR14, greater in YM (⫺32.0 ⫾ 27.6%, P ⫽ 0.030) than in OM (⫺23.4 ⫾ 40.9%, P ⫽ 0.045), with an interaction effect close to significant (P⫽ 0.132). Interestingly, at R⫹14, Fo was still lower than BDC both in YM (⫺34.3%, P ⫽ 0.030) and OM (⫺27.0%, P ⫽ 0.043).
Relevant parameters of glucose and lipid metabolism were explored in relation to a standardized mixed meal, as described
Fig. 1. Changes in muscle volume and contractile function in relation to bed rest (BR) and rehabilitation. Changes in quadriceps volume (QVOL), force in isometric maximal voluntary contraction (QF), and explosive power (QP) of leg extensor muscles during BR and rehabilitation are shown in A, B, and C, respectively. Baseline data collection (BDC) at the beginning of BR; BR14 values were determined after 14 days of BR; R⫹14 values were determined on day
14 of recovery. MVC, maximal voluntary contraction. Data are displayed as means⫾ standard deviation (SD). $Denotes significant difference between groups
at BDC with P⬍ 0.05; a, b, and c denote significant difference from BDC at BR14 or R⫹14 with P ⬍ 0.05 (a), P ⬍ 0.01 (b), P ⬍ 0.001 (c); #denotes significant difference between groups at BR14 or R⫹14 after adjusting BDC differences with P ⬍ 0.05.
Fig. 2. A: changes in peak aerobic power normalized to body mass. B: changes in gait stride length. Data are displayed as means⫾ SD. $Denotes significant differ-ence between groups at BDC with P⬍ 0.05; a, b, and c denote significant difference from BDC at BR14 or R⫹14 with P ⬍ 0.05 (a), P ⬍ 0.01 (b), P ⬍ 0.001 (c); #denotes significant difference between groups at BR14 or R⫹14 after adjusting BDC differences with P ⬍ 0.05.
in METHODS. At BDC in the postprandial state, OM exhibited
comparable insulin sensitivity (measured with the Matsuda index), but greater lipemia (i.e., AUC triglycerides) than YM. Interestingly, this was associated with higher triglycerides and cholesterol concentrations in the plasma in fasting conditions in OM compared with YM (see above), but it was not related to a different body composition because at baseline, the two groups did not show significant differences in percent body fat (Fig. 4A). Body composition was altered by inactivity only in OM as indicated by the determination of fat mass percentage, which increased at BR14 only in OM by 2.3 ⫾ 3.2% (P ⫽ 0.022) (see Fig. 4A). Body mass, however, was not signifi-cantly altered by BR and rehabilitation: body mass index, expressed in kg/m2, was 24.0⫾ 2.3, 23.1 ⫾ 2.1, and 24.1 ⫾ 2.2 in YM and 26.6⫾ 4.0, 25.5 ⫾ 4.6, and 26.4 ⫾ 4.7 in OM at BDC, end of BR, and end of rehabilitation, respectively.
The Matsuda index (Fig. 4B), which measures postprandial insulin sensitivity, showed a decrease with inactivity in both YM and OM. Surprisingly, the decrease in Matsuda index at BR14
was significantly greater in YM (⫺46.0 ⫾ 11.9%, P ⫽ 0.003) than in OM (⫺19.8 ⫾ 22.5%, P ⫽ 0.006) with an interaction effect of P⫽ 0.003 (see Fig. 4B). In OM, the Matsuda index was fully recovered at R⫹14. The postprandial AUC of triglycerides (Fig. 4C) showed a minor and not significant variation in OM at BR14 (P⫽ 0.121), whereas it increased in YM (47.2 ⫾ 40.0%, P⫽ 0.013) with an interaction effect of P ⫽ 0.015.
Finally, at BR14, plasma homocysteine concentration in the fasting state (Fig. 4D) increased from BDC values only in YM (26.3⫾ 21.4%, P ⫽ 0.027), whereas it did not change in OM.
DISCUSSION
We designed a BR experiment to compare the response to disuse and rehabilitation in younger and older subjects accord-ing to the followaccord-ing principles: 1) younger and older partici-pants were exposed to exactly the same inactivity and rehabil-itation protocols, 2) the inactivity or BR period (14 days) was sufficiently long to induce a response in young and old men,
Fig. 3. Variations in average cross-sectional area (CSA) of single muscle fibers dissected from a biopsy sample taken from vastus lateralis muscle (A), and changes in isometric force developed by the same fibers during maximal activations (B). Data are displayed as means⫾ SD. $Denotes significant difference between groups at BDC with P ⬍ 0.05; a, b, and c denote significant difference from BDC at BR14 or R⫹14 with P ⬍ 0.05 (a), P⬍ 0.01 (b), P ⬍ 0.001 (c); #denotes significant difference between groups at BR14 or R⫹14 after adjusting BDC differences with P⬍ 0.05.
Fig. 4. A: variations in body composition expressed as % fat abundance as determined with bioimpedance measurement. B: insulin response as determined by the Matsuda test in a postprandial phase. C: area under the curve (AUC) of plasma triglyceride variations in the postprandial phase. D: plasma levels of homocysteine. Data are displayed as means⫾ SD. $Denotes significant difference between groups at BDC with P ⬍ 0.05; a, b, and c denote significant difference from BDC at BR14 or R⫹14 with P ⬍ 0.05 (a), P ⬍ 0.01 (b), P ⬍ 0.001 (c); #denotes significant difference between groups at BR14 or R⫹14 after adjusting BDC differences with P⬍ 0.05.
and 3) the recovery was analyzed after a 14 days of rehabili-tation, a duration suitable to detect possible differences among the two age groups.
To obtain an integrated or holistic view we aimed to detect changes at multiple levels from skeletal muscles that are obvious direct target of inactivity (QVOL, force, power, single fibers) in terms of cardiorespiratory performance (V˙O2peak), motor control (gait), metabolism (Matsuda index, triglycerides AUC, plasma homocysteine), and anthropometric parameters. As expected, age-related differences were present among YM and OM at BDC (i.e., before the BR experiment started), and this made the comparison more complex. Therefore, for many parameters we determined the fractional or percent variations during BR and rehabilitation. Quadriceps volume and contractile function of leg extensor muscles both in iso-metric conditions and during an explosive effort were lower in OM [see (31)]. A lower force was also detectable in single fibers dissected from biopsy samples of vastus lateralis muscle [see (10)]. Peak aerobic power, which during the cardiorespi-ratory maximal test on a cycle ergometer is usually limited by cardiovascular function [see (16)], was also lower in the older subjects in accordance with expectations. In contrast, body composition was not significantly different and insulin resis-tance was not significantly higher in OM, although triglycer-ides AUC were significantly greater in OM, suggesting a moderate age-dependent metabolic impairment [see (5)].
Both YM and OM experienced a significant decrease in muscle volume (QVOL) during the 2 wk of BR, but this was accompanied by an impaired contractile function in terms of maximal voluntary isometric force and explosive power (QF and QP) only in older men. The loss of QVOL per week in OM was ⬃4%, thus fully comparable to the values reported by Drummond et al. (14, 15), and 30% greater of the weekly loss of QVOL observed in YM. The greater atrophic response in OM likely finds an explanation in the altered amino acid transport and mTOR signaling recently described by Tanner et al. (36). Moreover, although 2 wk of rehabilitation was suffi-cient for a complete recovery of QVOL in YM, this was not the case in OM. In fact, after 2 wk of rehabilitation, QVOL was still significantly lower compared with BDC values in OM. This can be partly attributed to the peculiar increase in anabolic resistance observed in older men in relation to reduced loco-motor activity (3). The contractile impairment of the knee extensor muscles (QF and QP) was consistent with the de-crease in the force-generating capacity of single muscle fiber (Fo), but might also imply a reduced neural drive. This is also suggested by the alteration in gait parameters observed only in OM and not in YM. Impairment of locomotor activity after BR in older individuals has been recently reported (7), and evi-dence of reduced neural drive in lower limb contraction during BR is also available (29). The decrease in force developed by single muscle fibers was present both in YM and in OM and was comparable to findings in young subjects exposed to BR (28, 37). Interestingly, the decrease in force was more pro-nounced in YM, although statistical significance was not reached. Moreover, in both YM and OM the recovery period of 2 wk was not sufficient to regain BDC values. This is in accordance with recent data reported by Hvid et al. (18), who showed in a different disuse model (i.e., unilateral leg suspen-sion) that recovery of single muscle fibers after disuse occurs
with a much slower time course than the decrease during the inactivity period.
V˙O2peakwas lower at BDC in OM compared with YM, as expected, and underwent a significant decline during BR in both groups. Similar, Kortebein et al. (23) reported that 10-day BR resulted in a significant decline of ⫺12.2% in maximal aerobic capacity in 11 older individuals. Importantly, our results showed that the decline in YM was 50% smaller than the decline in OM and only in this latter group did we observe that a recovery period of 2 wk was not sufficient to regain BDC values. Recent studies (32, 33) have suggested a significant role of an impairment in skeletal muscle oxidative metabolism in limiting whole body oxidative function during exercise in young subjects exposed to BR. The specific role of skeletal muscles in limiting oxidative function following BR (and subsequent rehabilitation) in older individuals remains to be elucidated.
At baseline, although OM exhibited a lower QVOL than YM, overall body composition was similar in the two groups, as indicated by the similar percent of fat mass. As stated above, a difference was observed in concentrations of cholesterol and triglycerides in fasting conditions and in postprandial handling of triglycerides, as shown by higher postprandial triglycerides AUC in OM. This suggests a moderate age-dependent altera-tion in lipid metabolism in the postprandial state (5). As expected and according to previous BR studies (2, 9), at BR14 in younger subjects, insulin sensitivity decreased significantly, whereas postprandial lipemia increased. Surprisingly, in OM the BR-induced insulin resistance was less pronounced than in YM. In fact, the Matsuda index of insulin sensitivity decreased at BR14 in OM only, by 19.8% (vs. 46% in YM), and postprandial lipemia did not change significantly from BDC values.
Interestingly, homocysteine plasma level, which is consid-ered a risk factor for coronary, cerebral, and peripheral artery diseases (20), showed an increase only in YM and not in OM. The lower effect of BR on glucose and lipid metabolic param-eters in older individuals is an interesting finding and points to a lower sensitivity of the metabolism to inactivity in older individuals.
Although skeletal muscles play an important role in lower-ing glycemia, the observed changes in muscle volume in OM do not point in the direction of a contrasting increase in insulin resistance. Actually, in OM, QVOL was lower before BR and underwent a further greater decrease at BR14. The same is true for changes in muscle fiber type distribution, which was characterized by a greater abundance of slow fibers in OM compared with YM at BDC (P⫽ 0.044, data not shown) and a trend, albeit statistically not significant, to a slow-to-fast shift in both groups (data not shown). A most likely explanation for the lower metabolic effect of BR in OM compared with YM is that characteristics in older individuals more closely resembled a metabolic syndrome, they already were less active than the younger subjects and, therefore, the effects of a change in lifestyle on metabolism were less marked. In our opinion, however, the issue deserves further investigation.
It is worth emphasizing further that analysis of the recovery phase also provided potentially important and relevant infor-mation for translational medicine. Although all parameters describing muscle volume and function showed a complete recovery in YM at the end of 14 days of rehabilitation, in OM
an incomplete recovery was detectable in QVOL and contrac-tile performance as measured by QP. In addition, V˙O2peakwas also lower at the end of the 2 wk of rehabilitation than that determined at BDC before beginning BR. Finally, Fo measured on single muscle fibers in vitro likewise did not recover in a time interval of rehabilitation equal to the time interval of inactivity, in accordance with recent observations by Hvid et al. (18). In our view, the lack of recovery, or at least the slower recovery in OM, is one of the most important messages to be elicited from the present study. Actually, the present data suggest that it is necessary to pay special attention both to the rehabilitation phase in older individuals and to design protocols to keep older individuals active even when hospitalization is required.
In conclusion, two main and partially contradictory findings are outcomes of this comparative study on adaptations to BR in healthy younger and older subjects, both exposed to precisely the same conditions of inactivity. The effect on muscle mass and function is greater in older men, whereas metabolic alter-ations are greater in younger adult men. The comparative analysis of the recovery period unambiguously highlights how older participants had difficulty regaining preinactivity conditions. The greater detrimental effect of physical inac-tivity and the delayed recovery in older adults documented by the present findings strongly emphasize the importance of an active lifestyle in old age and avoiding or minimizing periods of inactivity, particularly when these are due to hospitalization and BR.
ACKNOWLEDGMENTS
We thank the study participants for their time and effort to ensure the project was a success. We acknowledge the excellent assistance of the entire staff of the Orthopaedic Hospital Valdoltra (Koper, Slovenia). Additionally, we thank the research team and the students in Applied Kinesiology at the University of Primorska for their help and logistical support, and many other researchers and colleagues from various institutions and countries who con-tributed to the smooth undertaking of the study.
GRANTS
The study was conducted in the framework of the PANGeA project, CB147 - Physical Activity and Nutrition for Quality Ageing, supported by the Cross-border Cooperation Program Slovenia–Italy 2007–2013 and cofinanced by European Regional Development Fund Grant 042-2/2009-18/052012, and by Slovenian National Project L5-5550, Development of noninvasive marker for muscle atrophy, Grant 1000-15-1988.
DISCLOSURES
No conflicts of interest, financial or otherwise, are declared by the authors.
AUTHOR CONTRIBUTIONS
R.P., G.B., B.G., C.R., P.E.d.P., A.P., M.V.N., J.R., and B.S. conception and design of research; U.M., S. Mazzucco, S.L., L.T., A.P., S. Mohammed, J.R., M. Gasparini, M. Gabrijelcˇicˇ, and B.S. performed experiments; U.M., S. Mazzucco, S.L., B.G., C.R., L.T., A.P., S. Mohammed, J.R., M. Gasparini, M. Gabrijelcˇicˇ, and B.S. analyzed data; R.P., U.M., G.B., S. Mazzucco, S.L., B.G., C.R., L.T., P.E.d.P., A.P., M.V.N., S. Mohammed, J.R., M. Gasparini, M. Gabrijelcˇicˇ, and B.S. interpreted results of experiments; U.M. and C.R. prepared figures; R.P., G.B., C.R., and M.V.N. drafted manuscript; R.P., U.M., G.B., B.G., C.R., M.V.N., and J.R. edited and revised manuscript; R.P., U.M., G.B., S. Mazzucco, S.L., B.G., C.R., L.T., P.E.d.P., A.P., M.V.N., S. Moham-med, J.R., M. Gasparini, M. Gabrijelcˇicˇ, and B.S. approved final version of manuscript;.
REFERENCES
1. Biolo G, Agostini F, Simunic B, Sturma M, Torelli L, Preiser JC,
Deby-Dupont G, Magni P, Strollo F, di Prampero PE, Guarnieri G,
Mekjavic IB, Pisot R, Narici MV. Positive energy balance is associated
with accelerated muscle atrophy and increased erythrocyte glutathione turnover during 5 wk of bed rest. Am J Clin Nutr 88: 950 –958, 2008. 2. Blanc S, Normand S, Pachiaudi C, Fortrat JO, Laville M, Gharib C.
Fuel homeostasis during physical inactivity induced by bed rest. J Clin
Endocrinol Metab 85: 2223–2233, 2000.
3. Breen L, Stokes KA, Churchward-Venne TA, Moore DR, Baker SK,
Smith K, Atherton PJ, Phillips SM. Two weeks of reduced activity
decreases leg lean mass and induces “anabolic resistance” of myofibrillar protein synthesis in healthy elderly. J Clin Endocrinol Metab 98: 2604 – 2612, 2013.
4. Brower RG. Consequences of bed rest. Crit Care Med 37, Suppl 10: S422–S428, 2009.
5. Chong MF, Fielding BA, Frayn KN. Metabolic interaction of dietary sugars and plasma lipids with a focus on mechanisms and de novo lipogenesis. Proc Nutr Soc 66: 52–59, 2007.
6. Coker RH, Hays NP, Williams RH, Xu L, Wolfe RR, Evans WJ. Bed rest worsens impairments in fat and glucose metabolism in older, over-weight adults. J Gerontol A Biol Sci Med Sci 69: 363–370, 2014. 7. Coker RH, Hays NP, Williams RH, Wolfe RR, Evans WJ. Bed rest
promotes reductions in walking speed, functional parameters, and aerobic fitness in older, healthy adults. J Gerontol A Biol Sci Med Sci 70: 91–96, 2015.
8. Covinsky KE, Palmer RM, Fortinsky RH, Counsell SR, Stewart AL,
Kresevic D, Burant CJ, Landegeld CS. Loss of independence in
activ-ities of daily living in older adults hospitalized with medical illnesses: increased vulnerability with age. J Am Geriatr Soc 51: 451–458, 2003. 9. Cree MG, Paddon-Jones D, Newcomer BR, Ronsen O, Aarsland A,
Wolfe RR, Ferrando A. Twenty-eight-day bed rest with
hypercortisol-emia induces peripheral insulin resistance and increases intramuscular triglycerides. Metabolism 59: 703–710, 2010.
10. D’Antona G, Pellegrino MA, Adami R, Rossi R, Carlizzi CR,
Cane-pari M, Saltin B, Bottinelli R. The effect of ageing and immobilization
on structure and function of human skeletal muscle fibres. J Physiol 552: 499 –511, 2003.
11. Deschenes MR, Holdren AN, McCoy RW. Adaptations to short-term muscle unloading in young and aged men. Med Sci Sports Exerc 40: 856 –863, 2008.
12. Deutz NE, Pereira SL, Hays NP, Oliver JS, Edens NK, Evans CM,
Wolfe RR. Effect of-hydroxy--methylbutyrate (HMB) on lean body
mass during 10 days of bed rest in older adults. Clin Nutr 32: 704 –712, 2013.
13. Doria C, Toniolo L, Verratti V, Cancellara P, Pietrangelo T, Marconi
P, Paoli A, Pogliaghi S, Fanò G, Reggiani C, Capelli C. Improved V˙O2
uptake kinetics and shift in muscle fiber type in high-altitude trekkers. J
Appl Physiol 111: 1597–1605, 2011.
14. Drummond MJ, Dickinson JM, Fry CS, Walker DK, Gundermann
DM, Reidy PT, Timmerman KL, Markofski MM, Paddon-Jones D, Rasmussen BB, Volpi E. Bed rest impairs skeletal muscle amino acid
transporter expression, mTORC1 signaling, and protein synthesis in re-sponse to essential amino acids in older adults. Am J Physiol Endocrinol
Metab 302: E1113–E1122, 2012.
15. Drummond MJ, Timmerman KL, Markofski MM, Walker DK,
Dick-inson JM, Jamaluddin M, Brasier AR, Rasmussen BB, Volpi E.
Short-term bed rest increases TLR4 and IL-6 expression in skeletal muscle of older adults. Am J Physiol Regul Integr Comp Physiol 305: R216 – R223, 2013.
16. Ferretti G. Maximal oxygen consumption in healthy humans: theories and facts. Eur J Appl Physiol 114: 2007–2036, 2014.
17. Hvid L, Aagaard P, Justesen L, Bayer ML, Andersen JL, Ørtenblad
N, Kjaer M, Suetta C. Effects of aging on muscle mechanical function
and muscle fiber morphology during short-term immobilization and sub-sequent retraining. J Appl Physiol 109: 1628 –1634, 2010.
18. Hvid LG, Suetta C, Nielsen JH, Jensen MM, Frandsen U, Ørtenblad
N, Kjaer M, Aagaard P. Aging impairs the recovery in mechanical
muscle function following 4 days of disuse. Exp Gerontol 52: 1–8, 2014. 19. Hvid LG, Suetta C, Aagaard P, Kjaer M, Frandsen U, Ørtenblad N. Four days of muscle disuse impairs single fiber contractile function in young and old healthy men. Exp Gerontol 48: 154 –161, 2013. 19a.Inouye SK, Wagner DR, Acampora D, Horvitz RI, Cooney LM Jr,
Hurst LD, Tinetti ME. A predictive index for functional decline in
20. Jensen MK, Bertoia ML, Cahill LE, Agarwal I, Rimm EB, Mukamal
KJ. Novel metabolic biomarkers of cardiovascular disease. Nat Rev
Endocrinol 10: 659 –672, 2014.
21. Knudsen SH, Hansen LS, Pedersen M, Dejgaard T, Hansen J, Hall
GV, Thomsen C, Solomon TP, Pedersen BK, Krogh-Madsen R.
Changes in insulin sensitivity precede changes in body composition during 14 days of step reduction combined with overfeeding in healthy young men. J Appl Physiol 113: 7–15, 2012.
22. Kortebein P, Ferrando A, Lombeida J, Wolfe R, Evans WJ. Effect of 10 days of bed rest on skeletal muscle in healthy older adults. JAMA 297: 1772–1774, 2007.
23. Kortebein P, Symons TB, Ferrando A, Paddon-Jones D, Ronsen O,
Protas E, Conger S, Lombeida J, Wolfe R, Evans WJ. Functional
impact of 10 days of bed rest in healthy older adults. J Gerontol A Biol Sci
Med Sci 63: 1076 –1081, 2008.
24. Krogh-Madsen R, Thyfault JP, Broholm C, Mortensen OH, Olsen
RH, Mounier R, Plomgaard P, van Hall G, Booth FW, Pederson BK.
A 2-wk reduction of ambulatory activity attenuates peripheral insulin sensitivity. J Appl Physiol 108: 1034 –1040, 2010.
26. Lazzer S, Pozzo R, Rejc E, Antonutto G, Francescato MP. Maximal explosive muscle power in obese and non-obese prepubertal children. Clin
Physiol Funct Imag 29: 224 –228, 2009.
27. Mazzucco S, Agostini F, Mangogna A, Cattin L, Biolo G. Prolonged inactivity up-regulates cholesteryl ester transfer protein independently of body fat changes in humans. J Clin Endocrinol Metab 95: 2508 –2512, 2010.
28. Mounier Y, Tiffreau V, Montel V, Bastide B, Stevens L. Phenotypical transitions and Ca2⫹activation properties in human muscle fibers: effects of a 60-day bed rest and countermeasures. J Appl Physiol 106: 1086 –1099, 2009.
29. Mulder ER, Stegeman DF, Gerrits KH, Paalman MI, Rittweger J,
Felsenberg D, de Haan A. Strength, size and activation of knee extensors
followed during 8 weeks of horizontal bed rest and the influence of a countermeasure. Eur J Appl Physiol 97: 706 –715, 2006.
30. Pavy-Le Traon A, Heer M, Narici MV, Rittweger J, Vernikos J. From space to Earth: advances in human physiology from 20 years of bed rest studies (1986 –2006). Eur J Appl Physiol 101: 143–194, 2007. 31. Pearson SJ, Young A, Macaluso A, Devito G, Nimmo MA, Cobbold
M, Harridge SD. Muscle function in elite master weightlifters. Med Sci
Sports Exerc 34: 1199 –1206, 2002.
32. Porcelli S, Marzorati M, Lanfranconi F, Vago P, Pisot R, Grassi B. Role of skeletal muscle impairment and brain oxygenation in limiting oxidative metabolism during exercise after bed rest. J Appl Physiol 109: 101–111, 2010.
33. Salvadego D, Lazzer S, Marzorati M, Porcelli S, Rejc E, Simunic B,
Pisot R, di Prampero PE, Grassi B. Functional impairment of skeletal
muscle oxidative metabolism during knee extension exercise after bed rest. J Appl Physiol 111: 1719 –1726, 2011.
34. Suetta C, Hvid LG, Justesen L, Christensen U, Neergaard K,
Simon-sen L, Ørtenblad N, Magnusson SP, Kjaer M, Aagaard P. Effects of
aging on human skeletal muscle after immobilization and retraining. J
Appl Physiol 107: 1172–1180, 2009.
35. Suetta C, Magnusson SP, Beyer N, Kjaer M. Effect of strength training on muscle function in elderly hospitalized patients. Scand J Med Sci
Sports 17: 464 –472, 2007.
36. Tanner RE, Brunker LB, Agergaard J, Barrows KM, Briggs RA,
Kwon OS, Young LM, Hopkins PN, Volpi E, Marcus RL, LaStayo PC, Drummond MJ. Age-related differences in lean mass, protein synthesis
and skeletal muscle markers of proteolysis after bed rest and exercise rehabilitation. J Physiol 593: 4259 –4273, 2015.
37. Trappe S, Creer A, Slivka D, Minchev K, Trappe T. Single muscle fiber function with concurrent exercise or nutrition countermeasures dur-ing 60 days of bed rest in women. J Appl Physiol 103: 1242–1250, 2007. 38. Urso ML, Clarkson PM, Price TB. Immobilization effects in young and
older adults. Eur J Appl Physiol 96: 564 –571, 2006.
39. Widrick JJ, Trappe SW, Romatowski JG, Riley DA, Costill DL, Fitts
RH. Unilateral lower limb suspension does not mimic bed rest or
space-flight effects on human muscle fiber function. J Appl Physiol 93: 354 –360, 2002.