R E S E A R C H
Open Access
The use of kDNA minicircle subclass
relative abundance to differentiate
between
Leishmania (L.) infantum and
Leishmania (L.) amazonensis
Marcello Ceccarelli
1, Luca Galluzzi
1*, Aurora Diotallevi
1, Francesca Andreoni
1, Hailie Fowler
2, Christine Petersen
2,
Fabrizio Vitale
3and Mauro Magnani
1Abstract
Background: Leishmaniasis is a neglected disease caused by many Leishmania species, belonging to subgenera Leishmania (Leishmania) and Leishmania (Viannia). Several qPCR-based molecular diagnostic approaches have been reported for detection and quantification of Leishmania species. Many of these approaches use the kinetoplast DNA (kDNA) minicircles as the target sequence. These assays had potential cross-species amplification, due to sequence similarity between Leishmania species. Previous works demonstrated discrimination between L. (Leishmania) and L. (Viannia) by SYBR green-based qPCR assays designed on kDNA, followed by melting or high-resolution melt (HRM) analysis. Importantly, these approaches cannot fully distinguish L. (L.) infantum from L. (L.) amazonensis, which can coexist in the same geographical area.
Methods: DNA from 18 strains/isolates of L. (L.) infantum, L. (L.) amazonensis, L. (V.) braziliensis, L. (V.) panamensis, L. (V.) guyanensis, and 62 clinical samples from L. (L.) infantum-infected dogs were amplified by a previously developed qPCR (qPCR-ML) and subjected to HRM analysis; selected PCR products were sequenced using an ABI PRISM 310 Genetic Analyzer. Based on the obtained sequences, a new SYBR-green qPCR assay (qPCR-ama) intended to amplify a minicircle subclass more abundant in L. (L.) amazonensis was designed.
Results: The qPCR-ML followed by HRM analysis did not allow discrimination between L. (L.) amazonensis and L. (L.) infantum in 53.4% of cases. Hence, the novel SYBR green-based qPCR (qPCR-ama) has been tested. This assay achieved a detection limit of 0.1 pg of parasite DNA in samples spiked with host DNA and did not show cross amplification with Trypanosoma cruzi or host DNA. Although the qPCR-ama also amplified L. (L.) infantum strains, the Cqvalues were dramatically increased compared to qPCR-ML. Therefore, the combined analysis of Cqvalues from qPCR-ML and qPCR-ama allowed to distinguish L. (L.) infantum and L. (L.) amazonensis in 100% of tested samples.
Conclusions: A new and affordable SYBR-green qPCR-based approach to distinguish between L. (L.) infantum and L. (L.) amazonensis was developed exploiting the major abundance of a minicircle sequence rather than targeting a hypothetical species-specific sequence. The fast and accurate discrimination between these species can be useful to provide adequate prognosis and treatment.
Keywords: Leishmania (L.) infantum, Leishmania (L.) amazonensis, qPCR, HRM, kDNA, Minicircles
* Correspondence:[email protected]
1Department of Biomolecular Sciences, University of Urbino“Carlo Bo”,
Urbino, PU, Italy
Full list of author information is available at the end of the article
© The Author(s). 2017 Open Access This article is distributed under the terms of the Creative Commons Attribution 4.0 International License (http://creativecommons.org/licenses/by/4.0/), which permits unrestricted use, distribution, and reproduction in any medium, provided you give appropriate credit to the original author(s) and the source, provide a link to the Creative Commons license, and indicate if changes were made. The Creative Commons Public Domain Dedication waiver (http://creativecommons.org/publicdomain/zero/1.0/) applies to the data made available in this article, unless otherwise stated.
Background
Leishmaniasis is a spectral neglected disease caused by many Leishmania species, primarily transmitted by phlebotomine sand flies [1]. Leishmaniasis is a public health problem in 98 countries, in both rural and urban areas. About 12 million people are currently affected by the disease; in particular, 0.2–0.4 million cases per year of visceral leishmaniasis (VL) and 0.7–1.2 million cases per year of cutaneous leishmaniasis (CL) have been esti-mated [2]. Leishmania parasites are classified in three different subgenera: Leishmania (Leishmania), Leish-mania (Viannia) and Leishmania (Sauroleishmania). Parasites in the subgenera Leishmania and Viannia in-fect mammals, whereas the Sauroleishmania inin-fect reptiles [3]. Over 30 Leishmania species have been identified, including many that are non-pathogenic or of minor medical importance. The Leishmania donovani complex belongs to the subgenus Leishmania (Leish-mania), the etiological agent of VL and CL, and includes L. (L.) infantum and L. (L.) donovani. The species belonging to the subgenus Leishmania (Viannia) are etio-logical agents of CL and mucocutaneous leishmaniasis.
An accurate diagnostic method that allows the distinc-tion between Leishmania species with overlapping geographical distributions is needed [4]. Since isoenzy-matic characterization is laborious and time-expensive, various molecular approaches have been developed based on detection of different Leishmania target sequences [5, 6]. In particular, the conserved region of Leishmania kinetoplast DNA (kDNA) minicircles has been used as a specific target for real-time PCR assays, able to distinguish Old World [7, 8] and New World species [9]. The kDNA is situated at the base of the flagellum and contains thousands of minicircles and dozens of maxicircles concatenated in a giant network [10]. The high number of minicircles (10,000–26,000 copies/parasite) [11–13] make them an attractive target for Leishmania detection with high sensitivity [14]. However, the minicircle network is composed of different minicircle subclasses conserved in different Leishmania species [15, 16]. Therefore, most of the available PCR or qPCR assays designed for a single species can potentially amplify more than one Leishmania species [13, 14, 17].
Previous works demonstrated the possibility to dis-criminate between L. (Leishmania) and L. (Viannia) by SYBR green-based qPCR assays designed on kDNA conserved sequences, followed by melting or high-resolution melt (HRM) analysis [13, 18]. These approaches did not efficiently distinguish L. (L.) infantum from L. (L.) amazonensis, which can coexist in the same geographic area. These species infect both humans and dogs [19], and their differentiation is critical for correct treatment. In fact, both species can present with
cutaneous manifestations, but L. (L.) amazonensis can also cause diffuse disease that does not respond well to current treatments [5]. Moreover, the use of immunosuppressant may alter the clinical course of Leishmaniasis (e.g. viscero-tropic strains can result in cutaneous lesions, and dermotropic strains can result in visceral disease). These issues are particularly important in South America, where both species are endemic, and deforestation and uncon-trolled urbanisation are responsible for the growing incidence of leishmaniasis [20].
The aim of this work is to investigate the kDNA sequence variability among different Leishmania species and to exploit these differences to develop a qPCR-based analysis that differentiates L. (L.) infantum from L. (L.) amazonensis.
Methods
Leishmania strains, clinical samples and DNA extraction
The DNA from promastigotes of Leishmania spp. isolates listed in Table 1 was chelex-purified. Conjunc-tival swabs (CS) or buffy coat (BC) samples from 21 dogs diagnosed with leishmaniasis were provided by the veterinary clinic “Santa Teresa” (Fano, Italy). The DNA from CS and BC samples was extracted as previously described [21]. The L. amazonensis and L. (Viannia) spp. clinical isolates were provided by Instituto de Patología Experimental (IPE), Facultad de Ciencias de la Salud -Universidad Nacional de Salta- Argentina and typed at the species level at the Institute of Biomedicine and Molecular
Table 1 Leishmania strains/isolates used in this study
Species Strain or isolate Zymodeme
L. (L.) infantum MHOM/TN/80/IPT1 MON-1
L. (L.) infantum MHOM/FR/78/LEM75 MON-1
L. (L.) infantum MHOM/ES/81/BCN1 MON-29
L. (L.) infantum MHOM/DZ/82/LIPA59 MON-24
L. (L.) infantum MHOM/IT/93/ISS822 MON-201
L. (L.) infantum MHOM/IT/86/ISS218 MON-72
L. (L.) infantum Clinical isolate V2921 MON-1
L. (L.) infantum Clinical isolate 31u MON-1
L. (L.) infantum Clinical isolate 49u MON-1
L. (L.) infantum Clinical isolate 791 MON-1
L. (L.) infantum Clinical isolate 10816 MON-1
L. (L.) amazonensis MHOM/BR/00/LTB0016 na
L. (L.) amazonensis IFLA/BR/67/PH8 MON-41
L. (L.) amazonensis Clinical isolate na
L. (V.) panamensis Clinical isolate na
L. (V.) guyanensis Clinical isolate na
L. (V.) braziliensis Clinical isolate na
L. (V.) braziliensis MHOM/BR/75/M2904 na
Immunology, CNR (Palermo, Italy) [13]. The L. infantum clinical isolates have been characterised by multilocus enzyme electrophoresis (MLEE) at Istituto Superiore di Sanità (Rome, Italy).
The DNA extracted from isolates and strains was quantified using a Qubit fluorometer (Life Technologies, Carlsbad, USA). Human and canine DNA from uninfected donors, purified using the DNeasy Blood & Tissue kit (Qiagen, Valencia, USA), as well as DNA from Trypanosoma cruziwere used as negative controls.
qPCR assays
An 111 bp KDNA region was amplified by a qPCR assay using primers MLF and MLR (referred as qPCR-ML from hereon) as previously described [13]. Briefly, PCR reac-tions were carried out in 25μl volume with 1 μl template DNA (corresponding to 0.1–1 ng parasite DNA) and 24 μl SYBR green PCR master mix (Diatheva srl, Fano, Italy) containing 1 U Taq Polymerase and 200 nM of each
primer in a Rotor-Gene 6000 instrument (Corbett Life Science, Mortlake, Australia). The amplification condi-tions were: 94 °C for 10 min, 40 cycles at 94 °C for 30 s, 60 °C for 20 s and 72 °C for 20 s. At the end of each run, a melting curve analysis was performed from 78 to 92 °C, with a slope of 1 °C/s, and 5 s at each temperature. The reactions were performed in duplicate or triplicate.
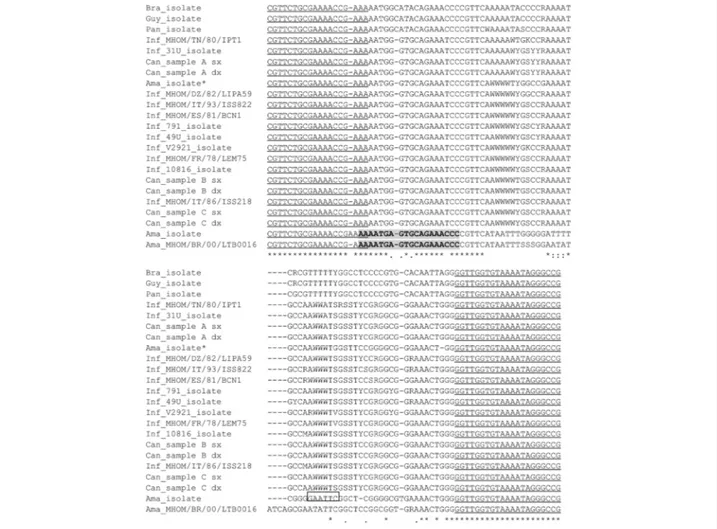
To amplify L. (L.) amazonensis DNA minicircles, a new qPCR assay (referred as qPCR-ama from hereon) was designed using the forward primer LMi-amaF (5′-AAA ATG AGT GCA GAA ACC C-3′) with the reverse primer MLR. The LMi-amaF primer was designed specifically for this work exploiting two mismatches (G/A and T/C) among L. (L.) infantum and L. (L.) amazonensis sequences (Fig. 1). The LMi-amaF sequence was tested with BLAST against the non-redundant nucleotide database (organism limited to Leishmania). The position of all primers in the qPCR-ML amplicons is shown in Fig. 1. The qPCR-ama was performed at the same
Fig. 1 CLUSTAL multiple alignments of qPCR-ML amplicon sequences performed by MUSCLE. The MLF and MLR primer sequences are underlined; the sequence of LMi-amaF primer is in bold. The EcoRI restriction site in L. (L.) amazonensis isolate is boxed. *Sequence of non-digested products after EcoRI restriction
conditions described above. A standard curve for qPCR-ama was established using L. (L.) qPCR-amazonensis MHOM/ BR/00/LTB0016 DNA serial dilutions, ranging from 1.0 to 1 × 10⁻⁴ ng. The standard curve concentration was expressed as ng/μl. To evaluate the potential interfer-ence of host DNA as background in the qPCR analysis, 30 ng of human DNA were spiked in the reaction tubes. The cycle threshold (Cq) values were determined using
the quantitation analysis of the Rotor-Gene 6000 software, setting a threshold to 0.15.
High-resolution melt (HRM) analysis
The qPCR-ML amplicons, obtained by all stains/isolates listed in Table 1 and by 62 samples from 21 dogs affected by leishmaniasis, were analysed in duplicate by HRM protocol on a Rotor-Gene 6000 instrument as described previously [13] with slight modifications. Briefly, HRM was carried out over the range from 78 °C to 92 °C, rising at 0.1 °C/s and waiting for 2 s at each temperature. Each sample was run in duplicate or triplicate, and the gain was optimised before melting on all tubes. HRM curve analysis was performed with the derivative of the raw data, after smoothing, with the Rotor-Gene 6000 software. Only samples with Cqvalues
˂ 30 were considered for subsequent analysis [13, 22].
PCR product sequencing
The qPCR-ML products obtained from the canine clin-ical samples and the strains/isolates (Table 1, except for IFLA/BR/67/PH8 and MHOM/BR/75/M2904 strains), were purified using the MinElute PCR purification kit (Qiagen) and directly sequenced using both MLF and MLR primers. DNA sequencing was performed using the BigDye Terminator v. 1.1 Cycle Sequencing Kit on ABI PRISM 310 Genetic Analyzer (Applied Biosystems, Foster City, USA). Sequences were manually edited and aligned using default options in MUSCLE [23]. Phylo-genetic and nucleotide composition analyses were conducted using MEGA version 6 [24].
RFLP analysis
The RFLP analysis was performed on qPCR-ML products with EcoRI restriction enzyme (Roche Life Sciences, Indianapolis, USA), following the manufacturer’s protocol. The EcoRI digestion was performed at 37 °C for 2 h in a 20μl mixture containing 7 U of enzyme and 50–100 ng of PCR products. The digestion mixtures were analysed on a 3% high-resolution MetaPhor (Cambrex, East Rutherford, USA) agarose gel, and the selected products were excised, purified with MinElute PCR purification kit (Qiagen) and sequenced as described above.
Statistical analysis
Statistical analysis was performed with GraphPad InStat version 3.06 (GraphPad Software, San Diego, CA).
Differences among Tm values were evaluated using an
Unpaired t-test with Welch’s correction. Normality dis-tribution was assessed by D’Agostino & Pearson omni-bus normality test (alpha = 0.05).
Results
Inter- and intra-specific genetic variability of kDNA minicircles
To investigate the genetic variability in the kDNA minicir-cle sequences amplified by qPCR-ML assay, the PCR products from all strains/isolates reported in Table 1 (ex-cept L. amazonensis IFLA/BR/67/PH8 and L. braziliensis MHOM/BR/75/M2904) and 6 CS samples from 3 dogs with leishmaniasis were directly and bidirectionally sequenced. The electropherograms showed superimposed peaks in some region, suggesting a further kDNA se-quence heterogeneity. Therefore, sese-quences were manu-ally edited before alignment. Numerous polymorphic loci were found (Fig. 1). The Leishmania (Viannia) subgenus isolates had significantly lower GC content respect to Leishmania (Leishmania) isolates (47.4% ± 0.2% and 51.3% ± 0.5%, respectively) (Mann–Whitney test, U = 3.00, P= 0.015), explaining melting differences found previously [13]. The sequences of Leishmania (Viannia), L. (L.) amazonensisisolates/strains and L. (L.) infantum strains/ clinical samples, clustered separately (Fig. 2).
A restriction site for EcoRI was evidenced in the L. (L.) amazonensis isolate, but it was not confirmed in L. (L.) amazonensisMHOM/BR/00/LTB0016 strain (Fig. 1), mak-ing it not feasible to develop a PCR-RFLP assay to distin-guish L. (L.) amazonensis from L. (L.) infantum. Moreover,
Fig. 2 Maximum likelihood phylogenetic tree of qPCR-ML amplicons. The tree was constructed with MEGA 6 software using Tamura-Nei model. *Sequence of non-digested product after EcoRI restriction
the RFLP analysis of the L. (L.) amazonensis isolate revealed a partial digestion of the PCR product (Additional file 1: Figure S1). The non-cleaved band was extracted from the gel and directly sequenced. The lack of a EcoRI restriction site, as well as many similarities with the L. (L.) infantum sequences (Figs. 1 and 2), showed the presence of different minicircle classes amplified by the qPCR-ML assay.
HRM analysis alone does not fully discriminate between L. (L.) infantum and L. (L.) amazonensis
Previously, we demonstrated that HRM analysis of qPCR-ML products can discriminate between the Leishmania subgenera Leishmania and Viannia, and can differentiate the L. (L.) infantum MHOM/TN/80/IPT1 reference strain (two melting peaks) from L. (L.) amazonensis (one melting peak) [13]. However, HRM analysis performed on several clinical specimens from dogs infected by L. (L.) infantum, showed two peaks comparable to L. (L.) infantum MHOM/ TN/80/IPT1 or a profile with a single melting peak, suggesting a kDNA minicircle parasite variability [13]. To
confirm and further extend these data, we performed HRM analysis on qPCR-ML products obtained by amplification of L. (L.) infantum strains/isolates listed in Table 1 and 62 canine clinical samples from 21 dogs infected by L. (L.) infantum. The results showed that 22% and 56% of the L. (L.) infantum amplicons presented a double melting peak and a single melting peak, respectively. The remaining 22% of samples was undetermined due to lack of reproducibility between replicates. L. (L.) amazonensis amplicons always had a single melting peak. Tm values between L. (L.)
amazonensis isolate, and MHOM/BR/00/LTB0016 strain was not significantly different (unpaired t-test with Welch’s correction, t = 1.23, P = 0.246). Tm values of strain IFLA/
BR/67/PH8 were not considered due to late amplification (Cq˃ 30) and consequent lack of reproducible Tmprofiles
[22]. The mean Tm of L. (L.) amazonensis amplicons was
significantly different from the mean Tmof L. (L.) infantum
amplicons showing a single peak (unpaired t-test with Welch’s correction, t = 8.77, P ˂ 0.001) (Table 2). However, the Tm value distribution overlapped (Fig. 3), therefore
Table 2 Tm comparison of L. (L.) amazonensis and L. (L.) infantum amplicons showing a single HRM peak Number of
replicates
TmMean ± SD (SE) D’Agostino & Pearson omnibus normality test Unpaired t-test with Welch’s correction
K2 P-value P-value
L. (L.) amazonensis 16 83.91 ± 0.20 (0.05) 0.1456 0.93 < 0.001
L. (L.) infantum 114 84.44 ± 0.36 (0.03) 1.28 0.53
Abbreviations: Tmhigh resolution melting temperature,SD standard deviation, SE standard error
Fig. 3 Tmvalues distribution of qPCR-ML amplicons of L. (L.) amazonensis and L. (L.) infantum with single melting peak. a Box-and-whisker plot is representing qPCR-ML amplicons Tmdistribution. The chart shows the distribution of data into quartiles, the smallest and the largest observation, and the mean (x). No outliers were identified. b Examples of overlapping melting curves obtained from L. (L.) amazonensis MHOM/BR/00/LTB0016 (Tm84.10–84.15 ° C) (upper panel) and L. (L.) infantum MHOM/IT/86/ISS218 (Tm84.15–84.20 °C), clinical isolate 791 (Tm84.10–84.15 °C), clinical isolate 10816 (Tm83.93 °C) (lower panel). These melting curves, showed in duplicates, represent an example of lack of discrimination between L. (L.) infantum and L. (L.) amazonensis
samples having Tmvalues˂ 84.4 °C appeared in a range of
uncertainty, as well as samples undetermined due to lack of concordance between replicates or due to late amplification (i.e. Cq˃ 30). Taken together, HRM analysis did not allow
discrimination between L. (L.) amazonensis and L. (L.) infantumin 53.4% of cases. Therefore, an approach based on a second qPCR was needed.
qPCR assay for amplification ofL. (L.) amazonensis
A qPCR assay which amplified an 88 bp sequence from L. (L.) amazonensis (qPCR-ama) was designed using a new forward primer (LMi-amaF) and the reverse primer MLR. The sequence of the LMi-amaF primer was first evaluated in silicousing BLAST. We found 100% identity in 10 out of 16 (62.5%) sequences of L. (L.) amazonensis kDNA minicircle present in GenBank (Additional file 2: Figure S2). Notably, no sequence of L. (L.) infantum matched with the LMi-amaF primer. Moreover, only one sequence out of 101 (1%) of L. (L.) donovani, 3 out of 11 (27%) of L. (L.) Mexicana, and 7 out of 24 (29%) of L. (V.) braziliensis matched with LMi-amaF sequence, accounting for the largest presence of the minicircle subclass matching LMi-amaF primer in L. (L.) amazonensis.
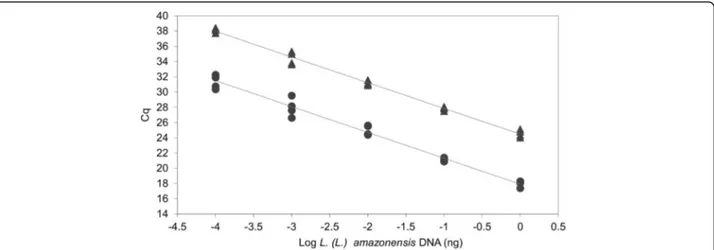
The efficiency and detection limit of the qPCR-ama assay were evaluated using 10-fold serial dilutions of L. (L.) amazonensis MHOM/BR/00/LTB0016 DNA (from 1.0 to 1 × 10⁻⁴ng) in 2 independent experiments in duplicate or triplicate. There was a linear correlation between the log of DNA concentration and Cqvalue (slope =-3.39, R2
= 0.98) with a reaction efficiency of 97% (Fig. 4). To verify the interference of host DNA, the standard curve was also spiked with 30 ng of purified human DNA. The presence of host DNA delayed the Cqvalues in the standard curve,
while the assay efficiency remained similar (Fig. 4). The detection limit was 0.1 pg of parasite DNA in the spiked samples, corresponding roughly to 1.3 parasites/PCR tube.
Fig. 4 qPCR-ama standard curves constructed with serial dilutions of L. (L.) amazonensis MHOM/BR/00/LTB0016 DNA. The standard curves were obtained with serial dilutions ranging from 1.0 to 0.0001 ng/tube, spiked (upper curve, y = -3.3720x + 24.4850; R2= 0.9915) or non-spiked (lower curve, y =-3.3933x + 17.9160; R2= 0.9803) with 30 ng human DNA. Each point derived from a duplicate of two independent experiments
Fig. 5 Electrophoretic analysis of qPCR-ama products. Lanes 1–5: L. (L.) amazonensis MHOM/BR/00/LTB0016 serial dilution ranging from 1.0 to 0.0001 ng DNA/reaction tube; Lane 6: L. (L.) amazonensis isolate; Lane 7: L. (L.) amazonensis IFLA/BR/67/PH8; Lane 8: Trypanosoma cruzi; Lane 9: human DNA; Lane 10 canine DNA. Abbreviations: m, marker 9; NTC, no template control
This value was determined by the genome size of L. (L.) amazonensis (29.6 Mb, 64.8 fg for the diploid genome) [25], adding 9.7 fg (15%) kDNA [26]. The calculated total DNA for a single parasite was 74.5 fg.
The specificity of the primers was first tested using two strains and one isolate of L. (L.) amazonensis, Try-panosoma cruzi and host DNA (human or canine). No amplification was observed when using T. cruzi, human or canine DNA, while all L. (L.) amazonensis strains were positive on qPCR (Fig. 5). Cq values were much
lower compared to Cq obtained with qPCR-ML using
the same template amount (Table 3). The qPCR-ama was then tested with strains of L. (V.) guyaniensis, L. (V.) panamensis, L. (V.) braziliensis and L. (L.) infantum. The results showed that L. (V.) guyaniensis, L. (V.) pana-mensis, L. (V.) braziliensis also amplified. However, these species could be distinguished from Leishmania (L.) spe-cies by qPCR-ML and HRM analysis. DNA from L. (L.) infantumisolates/strains did amplify, but Cqvalues were
dramatically increased compared to qPCR-ML. If tem-plate DNA was diluted to have Cq ˃ 25 in qPCR-ML,
there was no detectable amplification from qPCR-ama (Table 3). As evidence of this, the canine clinical samples tested with qPCR-ML (with Cq ˃ 25) had negative
re-sults with qPCR-ama, confirming infection by L. (L.) infantum (Table 4). Combined evaluation of qPCR-ML and qPCR-ama Cq values provided discrimination
between L. (L.) infantum and L. (L.) amazonensis in all tested samples.
Discussion
Previous work has shown that the Leishmania (Leish-mania) and Leishmania (Viannia) subgenera could be distinguished by exploiting kDNA variability through HRM analysis of qPCR-ML amplicons [13]. Here, several qPCR-ML amplicons from different Leishmania species were sequenced, indicating the presence of different sub-classes of minicircles amplified from the same species. Notably, the presence of over 100 minicircles classes encoding different gRNAs in a strain of L. tarentolae has been reported and quantified using NGS technology, in-dicating the heterogeneity of the mitochondrial genomes in this parasite [27]. The EcoRI partial digestion of the amplicon obtained from L. (L.) amazonensis isolate con-firmed the presence of different sequences in the same PCR product. In fact, the sequence of the non-digested product evidenced a subclass of molecules without the EcoRI site, clustering with L. (L.) infantum sequences. The fact that the sequence of this product was not vis-ible in the first sequence analysis can be explained by a relatively low presence of this minicircle subclass.
Leishmania (L.) infantum and L. (L.) amazonensis in-fect both humans and dogs, and they can coexist in the same geographical area; therefore, their differentiation is critical for correct treatment. Notably, Sanches et al. [28] showed a high percentage of L. (L.) amazonesis in-fection in naturally infected dogs in an endemic area, underlining the necessity to discriminate these two spe-cies not only in human but also in veterinary medicine.
Table 3 qPCR-ML and qPCR-ama results
Species qPCR ML (Cq± SD) qPCR-ama (Cq± SD)
Undiluted Undiluted 1:10 1:100 1:1,000 1:10,000
L. (L.) infantum MHOM/TN/80/IPT1 17.26 ± 0.19 negative negative negative nt nt L. (L.) infantum MHOM/FR/78/LEM75 15.30 ± 0.41 nt 33.80 ± 0.33 37.92 ± 2.23 negative negative L. (L.) infantum MHOM/ES/81/BCN1 15.80 ± 0.77 33.70 ± 0.33 38.01 ± 1.36 negative negative nt L. (L.) infantum MHOM/DZ/82/LIPA59 16.43 ± 0.47 33.03 ± 0.61 nt nt negative negative L. (L.) infantum MHOM/IT/93/ISS822 14.73 ± 0.42 33.89 ± 0.66 nt nt negative negative L. (L.) infantum MHOM/IT/86/ISS218 15.42 ± 1.03 32.44 ± 1.18 nt nt negative negative L. (L.) infantum Clinical isolate V2921 17.09 ± 0.12 29.08 ± 0.13 nt nt negativea negative
L. (L.) infantum Clinical isolate 31u 14.30 ± 0.27 28.73 ± 0.78 nt nt negativea negative
L. (L.) infantum Clinical isolate 49u 15.71 ± 0.78 30.02 ± 0.01 nt nt negative negative L. (L.) infantum Clinical isolate 791 14.88 ± 0.51 27.76 ± 0.07 nt nt 38.81 ± 0.93 negative L. (L.) infantum Clinical isolate 10816 13.53 ± 0.46 26.53 ± 0.11 nt nt 36.67 ± 2.08 negative L. (L.) amazonensis MHOM/BR/00/LTB0016 23.79 ± 0.25 17.97 ± 0.40 21.08 ± 0.23 25.00 ± 0.66 27.97 ± 1.21 31.49 ± 0.88 L. (L.) amazonensis IFLA/BR/67/PH8 34.42 ± 0.02 15.32 ± 0.01 19.33 ± 0.32 nt nt nt L. (L.) amazonensis Clinical isolate 31.66 ± 0.19 20.87 ± 0.24 24.12 ± 0.14 nt nt nt L. (V.) panamensis Clinical isolate 22.96 ± 0.28 35.57 ± 0.56 nt negative nt nt L. (V.) guyanensis Clinical isolate 29.71 ± 0.32 33.30 ± 0.17 36.78 ± 0.46 negative nt nt L. (V.) braziliensis Clinical isolate 28.15 ± 0.85 37.87 ± 0.86 negative negative nt nt L. (V.) braziliensis MHOM/BR/75/M2904 26.07 ± 1.80 38.19 ± 0.04 negative negative nt nt Abbreviation: nt not tested
Since HRM analysis resulted inconclusive for discrimin-ation of L. (L.) infantum and L. (L.) amazonensis in about 53% of samples, a new SYBR-green qPCR assay (qPCR-ama) was designed to amplify a minicircle subclass prepon-derant in L. (L.) amazonensis, rather than targeting a hypothetical species-specific sequence. In fact, several PCR assays designed on minicircles also reported amplification of non-intended species [17, 29]. Moreover, Gomes et al. [30] showed that non-target organisms such as T. cruzi could be amplified, even if Cqvalues are˃ 30. Therefore,
the performance of different qPCR assays in series or the standardisation of multiplex qPCR appeared to be the only way of properly identifying different Leishmania species [31]. Due to the difficulties in designing species-specific primers, we based our qPCR assay on the evaluation of relative abundance of minicircle subclasses. We observed that qPCR-ML amplified several Leishmania species in-cluding L. (L.) amazonensis but to a much less sensitivity (higher Cq). The opposite was found for qPCR-ama: in this
case, L. (L.) amazonensis was amplified much more effi-ciently (lower Cq) compared to the other tested species,
be-cause primers were designed on a minicircle sequence that was more abundant in this species. Therefore, we have been
focusing on Cqrather than presence or absence of an
amp-lification curve. Hence, a minicircle subclass most repre-sented in L. (L.) amazonensis was used as a target to differentiate L. (L.) amazonensis and L. (L.) infantum. The template DNA can be diluted to make undetectable the low-represented minicircle subclasses. The data in Table 3 show clearly this point: if DNA template from L. (L.) infan-tumwas diluted to have Cq˃ 25 in qPCR-ML (considering
1:10 dilution equivalent to ~ 3.3 cycles increase), the qPCR-ama turned negative. On the contrary, under appropriate dilution conditions, the qPCR-ama will give positive ampli-fication only for L. (L.) amazonensis species (Table 3). These conditions could also be met by clinical samples, in which pathogen DNA is low represented respect to host DNA and the Cqcan be delayed (as evidenced in the qPCR-ama
standard curves).
The results of in silico analysis accounted for the pos-sibility to amplify more L. (L.) amazonensis strains other those tested in this work, despite the database does not give information about the relative abundance of the kDNA minicircle sequences into the different strains. For example, the kDNA minicircle sequence of strain IFLA/BR/67/PH8 (GenBank M21325) shows a mismatch in the LMi-amaF sequence (Additional file 2: Figure S2) but it was efficiently amplified in our assay (Table 3), probably due to the presence of another minicircle subclass matching the primer sequence.
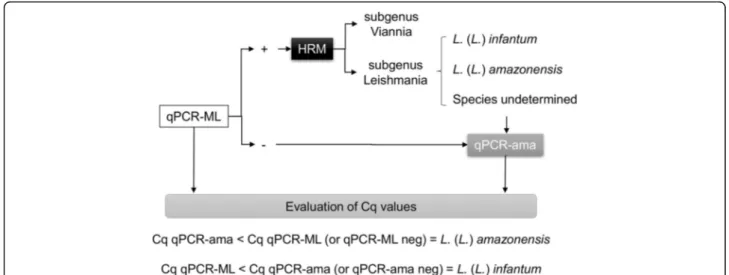
Taken together, a new diagnostic approach for Leish-mania species discrimination from clinical samples or isolates has been developed: first, a qPCR-ML followed by HRM analysis is performed. In the case of lack of amplifi-cation, or if HRM results are inconclusive, the qPCR-ama assay is performed, and the evaluation of Cq values for
both assays will allow the discrimination of the two
Fig. 6 A possible diagnostic approach based on qPCR and HRM analysis. The qPCR-ML followed by HRM analysis is performed. In the case of lack of amplification, or if HRM results are inconclusive, the qPCR-ama can also be performed. The evaluation of Cqvalues for both assays will allow discriminating between L. (L.) infantum and L. (L.) amazonensis
Table 4 qPCR-ML and qPCR-ama results in canine clinical samples Canine conjunctival swab sample qPCR-ML (Cq± SD) qPCR-ama (Cq± SD) 1 29.15 ± 0.84 negative 2 31.93 ± 1.13 negative 3 31.49 ± 0.69 negative 4 34.06 ± 0.76 negative 5 33.61 ± 0.18 negative 6 27.32 ± 0.96 negative
species (Fig. 6). This approach is affordable for any mo-lecular diagnostic laboratory equipped with an HRM qPCR instrument since it is based on an SYBR green chemistry and requires only three primers. Moreover, since the cost per reaction is relatively low (less than 1€) and the PCR conditions are the same, the two assays could be run simultaneously to speed up the diagnostic process.
Conclusions
The new approach to differentiate L. (L.) amazonensis and L. (L.) infantum infections in geographical regions in which these species co-exist could be a useful diagnosis tool. Due to qPCR sensitivity, this approach will allow spe-cies differentiation from isolated parasites and from DNA extracted from clinical samples. This study represents a proof of concept: more samples should be analysed, and accuracy studies should be performed in clinical environ-ments to validate the real utility of this method. Moreover, more species could be tested to extend the feasibility of this approach to other species or complex.
Additional files
Additional file 1: Figure S1. RFLP analysis. Amplicons obtained with qPCR-ML were digested with EcoRI as described in methods. Digestion mixtures were analysed on a 3% high-resolution MetaPhor gel. Only the amplicon from L. (L.) amazonensis isolate was partially restricted in fragments of 64 and 48 bp. 1) L. (L.) infantum MHOM/TN/80/IPT1; 2) L. (L.) amazonensis isolate; 3) L. (V.) guyanensis isolate; 4) L. (V.) panamensis isolate; 5) L. (V.) braziliensis isolate; 6) canine clinical sample A sx; m: marker 9. (PPTX 47 kb) Additional file 2: Figure S2. CLUSTAL multiple alignments of 16 L. (L.) amazonensis kDNA minicircle sequences retrieved from Genbank (partial sequences). The alignment was performed by MUSCLE with default options. The boxes indicate the positions of primers LMi-amaF and LMR; the sequences perfectly matching the LMi-amaF primer are highlighted. (DOCX 16 kb)
Abbreviations
BC:Buffy coat; CL: Cutaneous leishmaniasis; Cq: Threshold cycle; CS: Conjunctival swab; HRM: High-resolution melt; kDNA: Kinetoplast DNA; qPCR: Quantitative real-time PCR; VL: Visceral leishmaniasis
Acknowledgements
We thank Dr Antonella Migliazzo and Dr Germano Castelli from IZS Palermo for providing Leishmania spp DNA. We thank Dr Emanule Gasparini and Dr Barbara Bianchi from the“Santa Teresa” Veterinary Clinic, Fano (PU) Italy, for providing canine clinical samples.
Funding
This work was partially supported by Italian Ministry of Health (Ricerca corrente 2013 IZS SI/13 RC). The funder had no role in study design, data collection and analysis, interpretation of the data, or writing the manuscript. Availability of data and materials
All data generated or analysed during this study are included in this published article and its additional files.
Authors’ contributions
Conception and design of the study: MC, LG. Acquisition of data: MC, AD, FA, HF. Analysis and interpretation of data: MC, LG, CP, FV, MM. Drafting the article: MC, LG. Revising the article critically for important intellectual content: CP, FV, MM. All authors read and approved the final manuscript.
Competing interests
The authors declare that they have no competing interests.
Consent for publication Not applicable.
Ethics approval and consent to participate
Approval of the study was obtained on July 31st, 2012 from the Ethical Committee for Animal Experiments of the University of Urbino (CESA). The study’s title was “Diagnosi biomolecolare della leishmaniosi attraverso l’uso di campioni clinici non invasivi e loro utilizzo per il monitoraggio terapeutico” (Prot. CESA 2/2012).
Publisher’s Note
Springer Nature remains neutral with regard to jurisdictional claims in published maps and institutional affiliations.
Author details
1Department of Biomolecular Sciences, University of Urbino“Carlo Bo”,
Urbino, PU, Italy.2Department of Epidemiology, College of Public Health, University of Iowa, Iowa City, IA, USA.3Istituto Zooprofilattico Sperimentale of
Sicily“A Mirri”, Palermo, PA, Italy.
Received: 5 January 2017 Accepted: 9 May 2017
References
1. Murray HW, Berman JD, Davies CR, Saravia NG. Advances in leishmaniasis. Lancet. 2005;366:1561–77.
2. Alvar J, Velez ID, Bern C, Herrero M, Desjeux P, Cano J, et al. Leishmaniasis worldwide and global estimates of its incidence. PLoS One. 2012;7:e35671. 3. Bates PA. Transmission of Leishmania metacyclic promastigotes by
phlebotomine sand flies. Int J Parasitol. 2007;37:1097–106.
4. Goto H, Lindoso JA. Current diagnosis and treatment of cutaneous and mucocutaneous leishmaniasis. Expert Rev Anti Infect Ther. 2010;8:419–33. 5. da Silva LA, de Sousa CS, da Graca GC, Porrozzi R, Cupolillo E. Sequence
analysis and PCR-RFLP profiling of the hsp70 gene as a valuable tool for identifying Leishmania species associated with human leishmaniasis in Brazil. Infect Genet Evol. 2010;10:77–83.
6. de Vries HJC, Reedijk SH, Schallig HDFH. Cutaneous leishmaniasis: recent developments in diagnosis and management. Am J Clin Dermatol. 2015;16:99–109.
7. Nicolas L, Milon G, Prina E. Rapid differentiation of Old World Leishmania species by LightCycler polymerase chain reaction and melting curve analysis. J Microbiol Methods. 2002;51:295–9.
8. De Monbrison F, Mihoubi I, Picot S. Real-time PCR assay for the identification of cutaneous Leishmania parasite species in Constantine region of Algeria. Acta Trop. 2007;102:79–83.
9. de Paiva Cavalcanti M, Dantas-Torres F, da Cunha Gonçalves de Albuquerque S, Silva de Morais RC, de Brito ME, Otranto D, Brandão-Filho SP. Quantitative real time PCR assays for the detection of Leishmania (Viannia) braziliensis in animals and humans. Mol Cell Probes. 2013;27:122–8. 10. Shlomai J. The structure and replication of kinetoplast DNA. Curr Mol Med.
2004;4:623–47.
11. Simpson L. Kinetoplast DNA in trypanosomid flagellates. Int Rev Cytol. 1986;99:119–79.
12. Degrave W, Fernandes O, Campbell D, Bozza M, Lopes U. Use of molecular probes and PCR for detection and typing of Leishmania - a mini-review. Mem Inst Oswaldo Cruz. 1994;89:463–9.
13. Ceccarelli M, Galluzzi L, Migliazzo A, Magnani M. Detection and characterization of Leishmania (Leishmania) and Leishmania (Viannia) by SYBR green-based real-time PCR and high resolution melt analysis targeting kinetoplast minicircle DNA. PLoS One. 2014;9:e88845.
14. Mary C, Faraut F, Lascombe L, Dumon H. Quantification of Leishmania infantum DNA by a real-time PCR assay with high sensitivity. J Clin Microbiol. 2004;42:5249–55.
15. Simpson L. The genomic organization of guide RNA genes in kinetoplastid protozoa: several conundrums and their solutions. Mol Biochem Parasitol. 1997;86:133–41.
16. Lee SY, Lee ST, Chang KP. Transkinetoplastidy - a novel phenomenon involving bulk alterations of mitochondrion-kinetoplast DNA of a trypanosomatid protozoan. J Protozool. 1992;39:190–6.
17. Losada-Barragán M, Cavalcanti A, Umana-Pérez A, Porrozzi R, Cuervo-Escobar S, Vallejo AF, et al. Detection and quantification of Leishmania infantum in naturally and experimentally infected animal samples. Vet Parasitol. 2016;226:57–64.
18. Pita-Pereira D, Lins R, Oliveira MP, Lima RB, Pereira BA, Moreira OC, et al. SYBR Green-based real-time PCR targeting kinetoplast DNA can be used to discriminate between the main etiologic agents of Brazilian cutaneous and visceral leishmaniases. Parasit Vectors. 2012;5:15.
19. Tolezano JE, Uliana SRB, Taniguchi HH, Araújo MFL, Barbosa JAR, Barbosa JER, et al. The first records of Leishmania (Leishmania) amazonensis in dogs (Canis familiaris) diagnosed clinically as having canine visceral leishmaniasis from Araçatuba County, São Paulo State, Brazil. Vet Parasitol. 2007;149:280–4. 20. Gomes CM, de Paula NA, de Morais OO, Soares KA, Roselino AM, Sampaio
RNR. Complementary exams in the diagnosis of American tegumentary leishmaniasis. An Bras Dermatol. 2014;89:701–9.
21. Ceccarelli M, Galluzzi L, Sisti D, Bianchi B, Magnani M. Application of qPCR in conjunctival swab samples for the evaluation of canine leishmaniasis in borderline cases or disease relapse and correlation with clinical parameters. Parasit Vectors. 2014;7:460.
22. White H, Potts G. Mutation scanning by high resolution melt analysis. Evaluation of RotorGene 6000 (Corbett Life Science), HR1 and 384 well LightScanner (Idaho Technology) [Internet]. National Genetics Reference Laboratory (Wessex); 2006 [cited 2016 Dec 1]. p. Available from: http://www. gene-quantification.de/white-pott-hrm-comp-2006.pdf
23. Edgar RC. MUSCLE: multiple sequence alignment with high accuracy and high throughput. Nucleic Acids Res. 2004;32:1792–7.
24. Tamura K, Stecher G, Peterson D, Filipski A, Kumar S. MEGA6: Molecular Evolutionary Genetics Analysis version 6.0. Mol Biol Evol. 2013;30:2725–9. 25. Real F, Vidal RO, Carazzolle MF, Mondego JMC, Costa GGL, Herai RH, et al. The
genome sequence of Leishmania (Leishmania) amazonensis: functional annotation and extended analysis of gene models. DNA Res. 2013;20:567–81. 26. Baptista CS, Vêncio RZN, Abdala S, Carranza JC, Westenberger SJ, Silva MN, et al. Differential transcription profiles in Trypanosoma cruzi associated with clinical forms of Chagas disease: Maxicircle NADH dehydrogenase subunit 7 gene truncation in asymptomatic patient isolates. Mol Biochem Parasitol. 2006;150:236–48.
27. Simpson L, Douglass SM, Lake JA, Pellegrini M, Li F. Comparison of the mitochondrial genomes and steady state transcriptomes of two strains of the trypanosomatid parasite, Leishmania tarentolae. PLoS Negl Trop Dis. 2015;9:e0003841.
28. Sanches LD, Martini CC, Nakamura AA, Santiago ME, de Lima Dolabela B, Lima VM. Natural canine infection by Leishmania infantum and Leishmania amazonensis and their implications for disease control. Rev Bras Parasitol Vet. 2016;25:465–9.
29. Miró G, Cardoso L, Pennisi MG, Oliva G, Baneth G. Canine leishmaniosis -new concepts and insights on an expanding zoonosis: part two. Trends Parasitol. 2008;24:371–7.
30. Gomes CM, Cesetti MV, de Paula NA, Vernal S, Gupta G, Sampaio RNR, et al. Field validation of SYBR green- and TaqMan-based real-time PCR using biopsy and swab samples to diagnose american tegumentary leishmaniasis in an area where Leishmania (Viannia) braziliensis is endemic. J Clin Microbiol. 2017;55:526–34.
31. Weirather JL, Jeronimo SMB, Gautam S, Sundar S, Kang M, Kurtz MA, et al. Serial quantitative PCR assay for detection, species discrimination, and quantification of Leishmania spp. in human samples. J Clin Microbiol. 2011;49:3892–904.
• We accept pre-submission inquiries
• Our selector tool helps you to find the most relevant journal • We provide round the clock customer support
• Convenient online submission • Thorough peer review
• Inclusion in PubMed and all major indexing services • Maximum visibility for your research
Submit your manuscript at www.biomedcentral.com/submit