○
E
A Worldwide and Unified Database of
Surface Ruptures (SURE) for Fault
Displacement Hazard Analyses
by Stéphane Baize, Fiia Nurminen, Alexandra
Sarmiento, Timothy Dawson, Makoto Takao, Oona
Scotti, Takashi Azuma, Paolo Boncio, Johann
Champenois, Francesca R. Cinti, Riccardo Civico,
Carlos Costa, Luca Guerrieri, Etienne Marti, James
McCalpin, Koji Okumura, and Pilar Villamor
ABSTRACT
Fault displacement hazard assessment is based on empirical rela-tionships that are established using historic earthquake fault rup-tures. These relationships evaluate the likelihood of coseismic surface slip considering on-fault and off-fault ruptures, for given earthquake magnitude and distance to fault. Moreover, they allow predicting the amount of fault slip at and close to the active fault of concern. Applications of this approach include land use planning, structural design of infrastructure, and critical facilities located on or close to an active fault.
To date, the current equations are based on sparsely populated datasets, including a limited number of pre-2000 events. In 2015, an international effort started to constitute a worldwide and unified fault displacement database (SUrface Ruptures due to Earthquakes [SURE]) to improve further hazard estima-tions. After two workshops, it was decided to unify the existing datasets (field-based slip measurements) to incorporate recent and future cases, and to include new parameters relevant to properly describe the rupture.
This contribution presents the status of the SURE database and delineates some perspectives to improve the surface-fault-ing assessment. Original data have been compiled and adapted to the structure. The database encompasses 45 earthquakes from magnitude 5–7.9, with more than 15,000 coseismic sur-face deformation observations (including slip measurements) and 56,000 of rupture segments. Twenty earthquake cases are from Japan, 15 from United States, two from Mexico, Italy, and New Zealand, one from Kyrgystan, Ecuador, Turkey, and Argentina. Twenty-four earthquakes are strike-slip faulting events, 11 are normal or normal oblique, and 10 are reverse faulting.
To pursue the momentum, the initial and common implemen-tation effort needs to be continued and coordinated, and the maintenance and longevity of the database must be guaranteed. This effort must remain based on a large and open community of earthquake geologists to create a free and open access database.
Supplemental Content: Information on the earthquakes, includ-ing date, coordinates of epicenter, focal mechanism, surface rup-ture information, geodesy data, information on structural context, and related references, associated shapefiles, georefer-enced map file depicting the rupture sections with IDs, the com-plete dataset related to the surface rupture information, including basic information (IDs, references, and coordinates), horizontal and vertical components of slip, fault plane data, and site information and comments, and the associated shapefiles and a value of net slip determined from the horizontal and vertical components when not available (and hypothesis on the fault dip).
INTRODUCTION
Earthquakes are a major threat for many human activities, not only because of shaking but also because of induced surface deformation (fault-related surface ruptures). Reducing earth-quake losses requires anticipating probable amplitude and loca-tion of ground moloca-tions and surface displacement. Following the extensive damage that accompanied the 1971 San Fernando, California, surface rupturing earthquake (e.g., Jennings, 1997), policy makers, engineers, and scientists have had to come to grips with the difficult task of mitigating surface rupture hazards to buildings and urban lifeline infrastructure. Anticipation of a pos-sible major fault rupture in the design of the Trans-Alaska Oil Pipeline built in the 1970s, for example, paid off when the Mw 7.9 Denali fault earthquake ruptured the Earth’s surface beneath it. The pipeline accommodated the 6 m of surface-faulting displacement suffering only minor damage, thus averting a major economic and environmental disaster. This success was due to intensive geologic investigations focused on identifying
and characterizing the Denali fault in terms of its precise loca-tion and potential displacements, emphasizing that overcoming such a threat requires geological investigations and innovative engineered mitigation. Since the 1970s, scientist know-how and survey techniques of coseismic ruptures have been developed and the quality of collected data is substantially improved, even for the detection of subtle features. This provides relatively com-plete scenarios for several recent earthquakes around the globe. Modern imaging and measuring techniques provide us with the chance of improving the mapping, quantification of surface rup-ture amplitudes in the immediate wake of events and their uncertainties. The use of terrestrial light detection and ranging (lidar) on specific spots along the Mw 7.2 El Mayor–Cucapah earthquake rupture have revealed that this technique is appro-priate to estimate the uncertainties, which are difficult to assess in the field, and that apparent very irregular slip profiles could actually be caused by field choices or uncertainties (Goldet al., 2013). The Interferometric Synthetic Aperture Radar (InSAR) technique was successfully used to recognize the ruptures caused by moderate earthquakes, such as the 2014Mw 6 Napa Valley, California (DeLonget al., 2016), or faint ruptures triggered by large remote events such as 2010 Mw 7.2 El Mayor–Cucapah one (Donnellan et al., 2014). Optical correlation allowed the geoscientists to map and measure the extensive and complex rupture associated with the large 2016 Mw 7.8 Kaikōura, New Zealand, earthquake (Klinger et al., 2018). Differential lidar has recently been used to map and measure coseismic sur-face faulting and deformation for the 2016 Kaikōura earthquake (Langridgeet al., 2018;Nicolet al., 2018).
Nevertheless, to date, the absence of inclusive modern data-bases of earthquake ruptures covering a wide range of magnitude and various tectonic environments in a homogenous frame con-tinues to be a significant gap. For example, surface rupture data-sets from specific categories of earthquakes are still not widely and sufficiently represented. Among these are the reverse-faulting earthquakes and earthquakes of moderate magnitude, although recent earthquakes in the United States (2014 West Napa), Japan (2014 Nagano Province), and Italy (2016 Norcia) reminded us that these kind of moderate (Mw6–6.5) events can also induce significant surface ruptures and related hazards, either on the principal (or primary) fault or secondary ruptures that are distributed around whatever the focal mechanism (Fig.1). Improving such databases can obviously help in building more robust empirical scaling relationships between earthquake magnitude and fault displacement parameters (rupture length, average, and maximum slip), but it will also allow the analysts to substantially improve the prediction of surface-faulting like-lihood and surface slip amount throughad hoc equations used in probabilistic approaches (namely probabilistic fault displacement hazard analyses [PFDHAs]), both for on-fault and off-fault slip, for given earthquake scenario or set of earthquakes (defined for instance by a magnitude–frequency distribution).
Actually, those predictions, derived from statistical analyses of historic ruptures datasets (Youngset al., 2003;Moss and Ross, 2011;Petersenet al., 2011;Takaoet al., 2013), are useful when trying to predict future fault displacements at, and close to, an
active fault, and they are of special interest for structural design of infrastructure and critical facilities (e.g., Chen and Petersen, 2011).
During two recent meetings dedicated to fault displacement hazard analyses (FDHAs; Baizeet al., 2016;Baize and Scotti, 2017), earthquake geologists and seismic hazard practitioners shared the opinion that the surface rupture datasets and ensuing empirical relationships need to be unified, homogenized, updated, and improved. Two main outcomes from those discus-sions in terms of improvements of such a database are the need for: (1) aggregating the existing datasets, and (2) clearly defining the relevant parameters that should be recorded when capturing future surface rupture data and adding them to the database. In Menlo Park (2016), more than 110 earth scientists joined, rep-resenting consulting companies, governmental agencies, and researchers from the Americas, Europe, Asia, and Oceania. Potential distributed deformation appeared to be a key concern, particularly for long baseline structures; infrastructure such as pipelines cannot avoid fault traces along their paths and PFDHA becomes crucial to designing them to be resilient. There is a large use of field data in assessing hazard procedures, either at local scale with high level of accuracy for specific studies (e.g., paleoseismological trenches) or at global scale with compi-lation of worldwide surface rupture information.
In this article and companion material, we expose the results of a common effort to build a unified database of SUrface Ruptures due to Earthquakes (SURE) to fill this gap. To our knowledge, this project represents the first and most complete effort to catalog surface rupture data in a geospatial database with associated data and metadata; it was initiated in the framework of a working group of the International Union for Quaternary Research (INQUA). Other efforts such as the University of California Fault Displacement Hazard Initiative (UC FDHI) project from the United States are in the earliest stages of database development (Sarmiento et al., 2019).
OVERVIEW OF SURFACE RUPTURE
PHENOMENON
Earthquake physics states that fault source area and slip increase with energy and moment magnitude of the earthquake (Hanks and Kanamori, 1979). This is verified during the field postearth-quake surveys and is statistically established by empirical scaling relationships (e.g.,Wells and Coppersmith, 1994). Surface fault-ing is generally represented by a unique or a set of discrete sur-face breaks at the ground sursur-face. The major one with the larger offsets, the longer continuity, a coherent structural arrangement, and (usually) the association with a cumulative fault, is qualified as the principal (or primary) fault (Fig.2). In addition to clearly observable surface faulting, a fraction of warping, tilting, or fold-ing, which can be hard to distinguish when not underlined by outstanding surfaces or piercing lines, can be present: for instance, recent striking examples arose in New Zealand during the 2010 Mw 7.1 Darfield earthquake (South Island of New Zealand) along the dextral Greendale fault (Litchfield et al., 2014) and during the 2016 Mw 7.8 Kaikōura earthquake
(South Island of New Zealand) with the broad flexural scarps along the reverse Papatea fault (Langridgeet al., 2018) (Fig.2). Those large-aperture deformation evidences might have been unnoticed during field geological surveys as single event rup-tures, especially for old historical earthquakes. Besides principal ruptures and nonlocalized deformation, off-fault secondary
ruptures are frequently described along connected splays, parallel branches (Fig. 2), or other segments structurally connected to the principal fault. Fault length, segment continuity, and slip values along distributed off-fault ruptures are typically less than those characterizing the principal fault. Minor displacements (several millimeters to several centimeters) of tectonic origin
▴
Figure 1. Surface ruptures related to moderate earthquakes, either on the principal or distributed (synthetic or antithetic) faults, can lead to significant damage to infrastructures and lifelines. (a,b) Surface faulting during theMw6.5 Norcia earthquake (30 October 2016) affected mountain roads and temporally impeded traffic, both along (a) principal and (b) secondary antithetic segments (pictures in November 2016 and July 2017, respectively). (a) The fault offsets the new asphalt that was set up after a first damage to the road during the 24 August 2016Mw6 foreshock. (c–e) The roads crossing the principal fault strand that ruptured during the Mw6 West Napa earth-quake (24 August 2014) were severely damaged by (c) parallel or (d) en-échelon segments, and several tiny (several centimeters) dextral offsets even damaged installations (curb and buried Pacific Gas and Electric Company pipes) crossing (e) secondary segments (pictures in December 2014). Note that panel (d) additionally illustrates the occurrence of postearthquake aseismic slip (afterslip) with the shift of the paint marks. The color version of this figure is available only in the electronic edition.have been described in remote areas along faults clearly noncon-nected to the seismogenic source. At those large distances (typ-ically several kilometers to tens of kilometers), slip is suspected to occur on active faults that are close to failure, and then governed by different physics than slip structurally connected to the earth-quake source. Remote shallow and aseismic slip is possibly trig-gered by dynamic stress change due to seismic waves (e.g.,Victor et al., 2018), sometimes eventually leading to favor the nuclea-tion of significant earthquakes (e.g.,Inbalet al., 2017). Such trig-gered slip occurred, for instance, on historically active faults of southern California as a consequence of the 2010 Mw 7.2 El
Mayor–Cucapah earthquake in northern Mexico, at distances exceeding 100 km (Rymer et al., 2011;Wei, Fielding,et al., 2011).
The characteristics of the near-surface geol-ogy influences the pattern of surface rupture, as exemplified by the 2010 El Mayor–Cucapah, Mexico, strike-slip to normal-oblique faulting earthquake (Teranet al., 2015). This changing pattern with surface geology has long and largely been documented over the world, what-ever the focal mechanism of the earthquake and the kinematics of the surface fault (e.g.,Mw7.9 Wenchuan reverse-faulting earthquake; Yu et al., 2010, orMw 7.7 Balochistan strike-slip earthquake;Vallageet al., 2015). Sandbox mod-els confirm the importance of understanding the near-surface material properties to predict the pattern and distribution of surface deforma-tion at a study site. In those experimental results, the near-surface material stiffness and the tectonic history are crucial parameters that control the rupture pattern and fabric (Stanton, 2013; Moss et al., 2018). In the database, we propose to introduce the surface geology param-eter for implementation of future events. If enough data are gathered, specific regressions for each near-surface geology type might be developed. The structural arrangement of the principal fault is another factor that conditions deformation distribution. Whether the fault is represented by unique or simple traces, or presents irregularities, the off-fault deformation will vary in nature, distribution, and amount. The occurrence of bends, stepovers, jogs, fault sinuosity, and a position at a fault tip will enhance the distribution of deformation as evi-denced by historical cases (1979 Imperial Valley or 2010 El Mayor–Cucapah earthquakes). An iconic case is the 1954Mw7+ Dixie valley sur-face rupture that broke one of the Basin and Range normal faults: from south to north, the principal fault, with offsets of about a meter along the cumulative fault at the base of the slope, forms an∼12 km bend in which numer-ous, discontinunumer-ous, and small offset faults affect the hanging wall (Fig. 3, data from Caskey et al., 1996). In reverse-faulting earthquake cases, surface deformation can present peculiar secondary deformation features (bending-moment ruptures, flexural-slip ruptures) when associated with coseismic fault-related folding, as evidenced for instance after theMw 7 El Asnam (Algeria) earthquake in 1980 (Philip and
Meghraoui, 1983). To account for those particularities, we pro-pose to assign to the principal and secondary faulting evidences an attribute describing the corresponding pattern of principal rupture, either continuous and linear (regular) portion, com-plex (stepovers, gaps, relays, and fault tip), or revealing any
▴
Figure 2. Field illustration of primary and distributed faulting. (a,b) Primary fault-ing (open white arrows) occurred durfault-ing the 6 April 2010Mw7.2 El Mayor–Cucapah earthquake (Mexico) along a series of east-dipping fault segments (here the Borrego segment of the El Mayor–Cucapah fault zone, with ∼3 m of right lateral and ∼1:5 m of normal components) and (b) off-fault ruptures with ∼10 cm of throws were distributed over several hundred meters, sometimes along known active faults such as the (c) west-dipping Laguna Salada fault that already rup-tured in 1892 and 1934. (d) Flexural shape that can characterize some reverse-fault-ing scarp, with the example of the∼8 m high and ∼50–80 m wide scarp (north of Middle Hill station, between the two groups of Paleoseismicity Active Tectonics Archeoseismicity days attendees) caused by the rupture of the Papatea fault during the Mw 7.8 Kaikōura earthquake (14 November 2016). The color version of this figure is available only in the electronic edition.other relevant structural feature (fault-related fold, graben, and parallel bedrock faulting). In addition, because of the signifi-cant impact of the position relative to rupture plane at depth (mainly in dip-slip cases) and related hazard (e.g.,Youngset al., 2003;Boncioet al., 2018), the data description will account for the hanging wall or footwall location of distributed ruptures. When deriving empirical relationships, those parameters may be analyzed separately and/or be used to develop regressions that are specific to the type of fault section.
Earthquake surface rupture commonly occurs along long-living geological structures with a documented historical and/or prehistorical activity, both at plate boundaries (e.g., 1906 Mw 7.5+ San Francisco earthquake along the San Andreas fault;Schwartzet al., 2014) and along less active faults such as those in central Italy where severe damages can also occur: during the 2009Mw 6.3 L'Aquila (Cintiet al., 2011), although coseismic surface offsets were in the order of few cen-timeters, the rupture trace crossed and broke apart an urban lifeline infrastructure, the Gran Sasso water pipeline. In Figure4, we depict as an example the case of the 22 November 2014Mw6.2 earthquake in central Japan along the Kamishiro whereOkumura (2001) evidenced at the place of the 2014 rupture a series of paleoearthquakes. Because slip history of ruptured faults is potentially a relevant topic for inferring future surface rupturing events, the SURE database allows the implementation of paleoseismological information.
DATA COLLECTION
General Comments
The surface rupture database, as a first step to future prediction equations of surface-faulting occurrence and amount of slip,
would be developed by accounting for all the relevant param-eters such as location, geometry, slip amount, and kinematics. It is therefore containing geospatial information gathering field measurements captured during postseismic surveys, in the form of segment maps and slip measurement tables. The compila-tion of existing informacompila-tion herein consisted of aggregating surface rupture cases already merged in various datasets and gathering publications with sufficient and appropriate data measured in the field.
To produce a unified database, variable amounts of editing, drawing, and interpretation were required because information comes from a large variety of authors (and then diversity of uti-lized terminology) and of field conditions. Therefore, a careful reading of the referenced dataset was undergone to properly transfer the reported data into the unified SURE structure and following the nomenclature used for reporting the surface fault displacement and shown in Figure5. We tried to keep track of the initial identification index when possible. The reported surface rupture information has been compiled at Institut de Radioprotection et de Sûreté Nucléaire (IRSN) and Institut du Physique du Globe de Paris (IPGP), France.
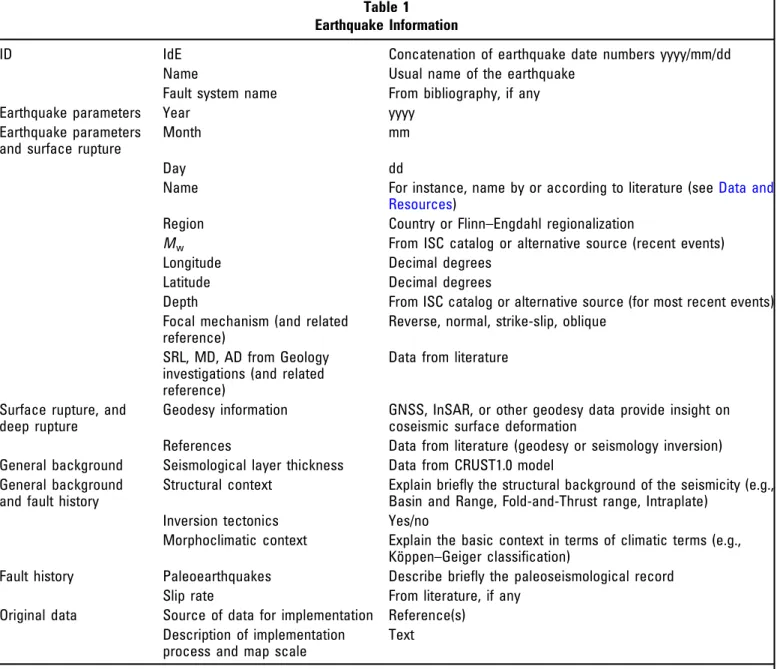
Database Structure
The SURE database is basically built on three-component files, describing the earthquakes, the rupture sections, and the slip observations. The information is contained in Tables 1, 2, and 3, in which numerical values are stored respectively for earthquakes and slip observations, associated with corresponding geospatial vector data (shapefiles), and in rupture sections’ shape-file. All these files are provided in theⒺ supplemental content to this article. In the slip observations shapefile, we report a net slip value computed from the horizontal and vertical
▴
Figure 3. Map of the primary and distributed ruptures during the Dixie Valley earthquake (1954). Data compiled by Pezzopane and Dawson (1996)from theCaskeyet al. (1996)publication. The color version of this figure is available only in the electronic edition.components of displacement; for vertical, we used the scarp heights or vertical throw, and the fault dip (when available).
Most of the seismological parameters for the earthquakes (identified by IdE) have been compiled from the International Seismological Centre-Global Earthquake Model (ISC-GEM) earthquake catalog (International Seismological Centre-Global Earthquake Model [ISC-GEM] Earthquake Catalogue, 2019), including moment magnitudes and depths. Overall estimation of surface rupture length, maximum and average displacement are grabbed in the source article or other reference; seismotec-tonic context corresponds to a short definition of the tecseismotec-tonics of the area inferred from the literature; geodetical or seismologi-cal information often refers to a link to the SRCMOD (Mai and Thingbaijam, 2014) database that aggregates and synthetizes published models. Relevant information about paleoearthquake and slip history is documented based on published articles.
Attributes in the rupture sections shapefile are the IdE of the causative earthquake and the ID of the segments (IdS).
The complete rupture map (on- and off-fault ruptures) is an important part of the database because this information is used to calculate the conditional probability of rupture in PFDHA (Youngs et al., 2003; Petersenet al., 2011).
The slip observations table includes, beside basic informa-tion, slip measurement and fault information (Table 3). Net slip is rarely reported in source articles or studies. Keeping track of the horizontal and vertical components can be important because engineers could necessitate this information to prop-erly design a building or a facility. For instance, a strategy to mitigate dip-slip rupture could be to build on top of ductile earth fills that could deviate or prevent the underlying fault to reach the earth surface (Oettle and Bray, 2013). In case of lateral motions, engineers decided to lay the Trans-Alaska
▴
Figure 4. Surface rupture of the 2014 Nagano Prefecture earthquake (data fromKatsube et al., 2017) crosscut a site where paleo-earthquakes were exposed in a trench. Inset shows the so-called Hakuba trench section modified fromOkumura (2001); ages are given in calibrated years before present (cal. yr B.P.).Okumura (2001)evidences four paleoearthquakes (H1 to H4) from the geometrical properties of layers, such as thickening of A7 (H1) and of A6 (H2), angular unconformity between A4 and A3 (H3), and the tilt of A1 to A3 (H4). The color version of this figure is available only in the electronic edition.pipeline on horizontal beam sliders parallel to the fault, so that the structure could accommodate the 2002 Denali rupture (see Data and Resources). In the shapefile related to the slip dataset, we report a net slip value for the complete set of points, which has been calculated from horizontal and vertical components in most cases. The table allows the implementation of large aperture offset, which sums up the discrete slip on the fault trace and the off-fault part of deformation that can occur at tens to hundreds of meters. The database is also suited for gath-ering information about structural complexity of primary fault near the identification number of the slip observation (IdO), and about local surface geology; this huge work has not been done yet. Any additional and relevant information can be indi-cated in the comment row.
Each individual slip data (IdO) and rupture segment (IdS) are linked to the causative earthquake (IdE). At the end, the tables can easily be joined and the database could be processed through Structured Query Language requests. In the database, IdO indexes are associated with the original Id defined by the data authors (when available).
DATA QUALITY AND COMPLETENESS
The data are made available in theⒺ supplemental content. To date, the effort focused on aggregating the existing datasets (pre-2010 events) and on enriching the database with very recent cases. Some of the 45 earthquake surface ruptures cor-respond to historical events (back to the nineteenth century) and were mapped either soon after or very recently; in any case, their information might be biased by large uncertainties, errors, and incompleteness. Other cases (e.g., 2014 West Napa,
United States, and 2016 Norcia, Italy, earth-quakes) were rapidly surveyed by many geolo-gists with the aim of capturing the complete information of ground deformation, combining classical field measurement (tape, compass, and Real Time Kinematic Global Positioning System) or modern high-resolution techniques (lidar, structure from motion) and could be considered to cover a substantial completeness. A big part of the dataset is not yet filled out in the tables, including the local geological infor-mation and structural complexity that are critical criteria influencing rupture arrangement and amplitude, and which potentially could be uti-lized to derive specific empirical relationships. Completing this work is a challenge for the com-ing years, as well as rankcom-ing (principal vs. distrib-uted faulting) each individual rupture.
Key long-term goals for having further reli-able and comprehensive empirical relationships also include incorporating data derived from the modern high-resolution techniques. The modern measurement techniques provide richer observa-tion datasets of surface deformaobserva-tion, with high-measurement density both along faults and perpendicular to faults, and these data will improve predictions of strain distribution and fault displacements. The U.S. commu-nity recently initiated a multiyear study that aims to develop a database combining field and geodetic measurements of earth-quake-related surface faulting, to be used in surface-faulting haz-ard analyses in the western United States (Sarmiento et al., 2019). The group of worldwide geologists who joined the SURE community should clearly take advantage of this momentum and interact through collaboration and coordination of efforts with the U.S. community.
Ensuring that the database includes earthquakes from all known seismotectonic environments is an important compo-nent for developing models that are able to predict fault dis-placement. For example, there is a paucity of displacement data in the SURE database for the Asian continent; however, a basic search in the U.S. Geological Survey (USGS) database of post-2000 Mw > 6 crustal earthquakes reveals most of these events are located in Asia, including China, Taiwan, Japan, the Philippines, Myanmar, Russia, Iran, Kyrgyzstan, Pakistan, Turkey, and very few have documented information on surface rupture in the literature. The search for new contributors will be one major task to improve the SURE database in the next years.
INITIAL CONTENT OF THE DATABASE
Numerous slip distributions along the primary faults are avail-able in the literature (e.g.,Lettis et al., 1997;Hemphill-Haley and Weldon, 1999; Wesnousky, 2008), but a limited number of earthquake cases yield information on distributed faulting off the primary rupture (e.g., Pezzopane and Dawson, 1996; Petersenet al., 2011; Takaoet al., 2013;Boncioet al., 2018).
▴
Figure 5. Convention used to describe the surface rupture metrics and param-eters. Reported terms are commonly admitted words that describe the fault kin-ematics both in structural or neotectonic studies. The color version of this figure is available only in the electronic edition.In all cases, the datasets include limited descriptions of the ruptures, together with georeferenced slip measurements.
The surface rupture dataset of Pezzopane and Dawson (1996)encompasses 13 normal-faulting events with distributed faulting occurrences. The strike-slip event dataset in Petersen et al. (2011)contains nine events with earthquake magnitude ranging from 6.5 to 7.6, whereas theTakaoet al. (2013)dataset contains 18 earthquakes from Japan (reverse and strike-slip mechanisms). The reverse surface rupture database compiled by Moss and Ross (2011) does not include any information on distributed ruptures, whereasBoncioet al. (2018)compiled distributed rupture information for nonsubduction reverse
earthquakes to derive criteria for fault zoning and avoidance; most of those last are still to be included.
To date, 45 earthquakes make up SURE in theMw 5–7.9 magnitude range, including 20 cases in Japan, 15 in the United States, two in Mexico, Italy, and New Zealand, one in Kyrgystan, Ecuador, Turkey, and Argentina. Twenty-four earthquakes are strike-slip faulting events, 11 are normal or one normal-oblique, and 10 are reverse faulting. The dataset includes more than 15,000 surface rupture observations (including slip measure-ments), and more than 56,000 rupture sections.
The 45 events (Table 4) arise from three major contri-butions:
Table 1 Earthquake Information
ID IdE Concatenation of earthquake date numbers yyyy/mm/dd
Name Usual name of the earthquake
Fault system name From bibliography, if any
Earthquake parameters Year yyyy
Earthquake parameters and surface rupture
Month mm
Day dd
Name For instance, name by or according to literature (seeData and Resources)
Region Country or Flinn–Engdahl regionalization
Mw From ISC catalog or alternative source (recent events)
Longitude Decimal degrees
Latitude Decimal degrees
Depth From ISC catalog or alternative source (for most recent events) Focal mechanism (and related
reference)
Reverse, normal, strike-slip, oblique SRL, MD, AD from Geology
investigations (and related reference)
Data from literature
Surface rupture, and deep rupture
Geodesy information GNSS, InSAR, or other geodesy data provide insight on coseismic surface deformation
References Data from literature (geodesy or seismology inversion) General background Seismological layer thickness Data from CRUST1.0 model
General background and fault history
Structural context Explain briefly the structural background of the seismicity (e.g., Basin and Range, Fold-and-Thrust range, Intraplate)
Inversion tectonics Yes/no
Morphoclimatic context Explain the basic context in terms of climatic terms (e.g., Köppen–Geiger classification)
Fault history Paleoearthquakes Describe briefly the paleoseismological record
Slip rate From literature, if any
Original data Source of data for implementation Reference(s) Description of implementation
process and map scale
Text
Earthquake information on selected events is given in theⒺ supplemental content. Each earthquake is known through an ID (IdE), which is built following the format yyyy/mm/dd. One exception in the current database is the Dixie Valley earthquake, which happened exactly the same day as the Fairviehw Peak event: the former has been assigned a yyyymm(dd+1) IdE. AD, average displacement; GNSS, Global Navigation Satellite Systems; InSAR, Interferometric Synthetic Aperture Radar; ISC, International Seismological Centre; MD, maximum displacement; SRL, surface rupture length.
• Petersenet al. (2011): seven earthquakes (out of nine) strike-slip faulting earthquakes, which occurred between 1968 and 1999, are in the 6.5–7.6 magnitude range and include prin-cipal and distributed slip information. Original data are from Clark (1972) for 1968 Borrego earthquake in the western United States,Sharpet al. (1982)for 1979Mw6.5 Imperial Valley, (Sharp et al., 1989) for 1987 Mw 6.7 Superstition Hills, Hart et al. (1993) for 1992 Mw 7.2 Landers,Treimanet al. (2002)for 1999 Hector Mine, and Barkaet al. (2002);Hartlebet al. (2002)andLangridgeet al. (2002)for 1999Mw7.2İzmit. The 1999 Kobe earthquake data were taken from theTakaoet al. (2013)database, not fromPetersen et al. (2011).
• Pezzopane and Dawson (1996): this report provides data about normal-faulting earthquakes in the western United States and nearby Mexico extensional Basin and Range prov-ince, with 1872 Owens Valley (Beanland and Clark, 1994), 1915 Pleasant Valley (Wallace, 1984), 1954 Dixie Valley and Fairview Peak (Caskey et al., 1996), 1959 Hebgen Lake (mainly in Myers and Hamilton, 1964), 1980 Mammoth Lake (Clarket al., 1982), and 1983 Borah Peak (Croneet al., 1987). We digitized the fault maps and reported the offset values produced by those authors for these earthquakes. • Takao et al. (2013): the 18 strike-slip and reverse
earth-quakes, which original data come from references in Japanese, are in the 6–7.4 magnitude range. Some histori-cal events date back to the nineteenth century and are poorly documented; others (e.g., 1995 Kobe) contain detailed information on primary and off-fault slip.
The database contains other cases from the literature as well such as the following earthquakes: 1887Mw7.5 Sonora, Mexico (Suter, 2015), 1911 Mw∼ 7:7 Chon-Kemin, Kyrghystan (Arrowsmith et al., 2017), 1971 Mw 6.7 San Fernando, United States (Bonilla et al., 1971;Kamb et al., 1971), 1987 Mw 6.7 Edgecumbe, New Zealand (Beanland et al., 1989), 2002 Mw 7.9 Denali (Haeussler et al., 2004), 2010 Mw 7 Darfield, New Zealand (Quigley et al., 2012; Villamor et al., 2012; Litchfield et al., 2014), 2010 Mw 5 Pisayambo, Ecuador (Champenois, Baize, et al., 2017), 2014 Mw 6.3 Nagano, Japan (Katsube et al., 2017), and Napa, California (Ponti et al., 2019), 2016 Mw 7 Kumamoto, Japan (Shirahamaet al., 2016), andMw6.5 Norcia, Italy (Civicoet al.,
2018;Villaniet al., 2018;Brozzettiet al., 2019) earthquakes. It is relevant to specify that the dataset of the latter probably cumu-lates the ruptures and displacements of the 24 AugustMw 6.0, 26 October Mw 5.9, and 30 October Mw 6.5 earthquake sequence, as the geologists could not separate systematically the contribution of theMw 6.5 mainshock from previous events. We also included datasets that are not reported in peer-review articles such as the 1944 La Laja, Argentina (Castellanos, 1944) and 2009 L'Aquila (Cinti et al., 2018) earthquakes.
The database will be rapidly enriched with the recently pub-lished datasets of the 2016 Mw 7.8 Kaikōura, New Zealand, earthquakes (Kearseet al., 2018;Langridgeet al., 2018;Litchfield et al., 2018;Nicolet al., 2018;Williamset al., 2018), and of other reverse-faulting earthquakes already prepared by Boncio et al. (2018)in the form of shapefiles and tables. The 1905 and 1957 Mw∼ 8 events in Mongolia, which have been documented in Table 2
Rupture Section Information
ID IdE Concatenation of earthquake date numbers yyyy/mm/dd
IdS Iterative number
Fault section name From literature, if any Fault section
parameters
Length In kilometers; provided by field observer or calculated under GIS Strike In degrees; provided by field observer
Dip In degrees; provided by field observer
Surface geology
Cover bed b/b rupture in bedrock, b/s rupture between bedrock and sediments, s/s rupture in sediments
Structural pattern
Fault pattern complexity (regular or complex)
Describe the observation site location with respect to pattern of the principal fault trace, for example, regular principal fault or complex pattern, such as fault tip, bend, gap, stepover or coseismic fold
Hanging wall vs. footwall Describe the relative location of observed distributed slip with respect to principal fault plane
Fault history Paleoearthquakes Describe briefly the paleoseismological record Slip rate From literature, if any
To date, the information on rupture section is only represented by a shapefile and its attribute file with IdS (Ⓔ supplemental content). In the future, several additional data could be added. During the construction of the database skeleton, the working group suggested incorporating information about the fault sections (name, length, strike, etc.) of the fault system (if any), to which observations could be related. When a fault section (IdS, fault section name) has been studied through paleoseismological investigations, it is relevant information to indicate its slip rate, the occurrence of paleoearthquakes displacements, and their recurrence. GIS, Geographic Information Systems.
Table 3
Slip Observation Information
Basic information IdE Concatenation of earthquake date numbers yyyy/mm/dd
IdS Segment ID
IdO Observation of rupture ID
Date Date of observation
Initial reference Source of data
Observer Name
Id observer ID provided by observer
Longitude In decimal degrees (WGS84)
Latitude In decimal degrees (WGS84)
Elevation In meters
Horizontal component of fault displacement
Strike slip (SS) Horizontal component of discrete slip along fault plane (in meters)
Sense of slip (SS) LL, left lateral; RL, right lateral Uncertainty horizontal (±) (SS) In meters
Maximum and minimum values (SS) In meters Large-aperture offset (SS) and
uncertainty
Corresponds to the total strike component of fault displacement, including that on the discrete fault plane and off-fault flexure, if any (in meters)
Aperture width (SS) Width of the band in which large-aperture offset is accommodated (in meters)
Fault-normal component (heave) (FNS) and sense of relative displacement
Shortening (S) or lengthening (L) (in meters)
Opening Aperture of the rupture measured perpendicular to the walls (in meters)
Vertical component of fault displacement
Vertical throw (VT) (m) Separation between hanging wall and footwall measured vertically (in meters)
Upside Gives the cardinal direction of the upthrown block surrounding the fault
Uncertainty vertical (±) (VT) In meters Maximum and minimum vertical (VT) In meters Large-aperture offset (VT) (m) and
uncertainty
Corresponds to the total vertical component of fault surface displacement (throw), including that on the discrete fault plane and off-fault flexure, if any (in meters)
Aperture width (VT) Width of the band where large-aperture offset is accommodated (in meters)
Vertical slip (VS) (m) and uncertainties Free-face fault slip and actual vertical component of slip, accounting for the fault dip (in meters)
In the shapefile attribute file, we report longitude and latitude in decimal degrees, referenced in the World Geodetic System of 1984 (WGS84) geographic coordinates system, net slip values in meters and the surface geology for few events. More complete data are provided in theⒺ supplemental content. In some cases, the net slip value has been directly reported by the authors; however, in most cases, value of slip along fault strike and vertical throw of coseismic slip are provided. Actual vertical component of slip (dip slip) has been obtained by fixing an arbitrary vertical dip when value is not specified. The dataset as well includes information about heave (i.e., horizontal component of relative displacement perpendicular to fault), with negative ones when lengthening and positive ones when shortening. The displacements are given in absolute values. Sense of displacement is given separately, in a specific column. Few cases have detailed information on fault azimuth and dip. The table allows the further implementation of large aperture offset, which sums up the discrete slip on the fault trace and the inelastic part of deformation that can occur at tens to hundreds of meters (see an illustration of that inKearseet al., 2018), and for structural complexity. Uncertainties can be reported in two ways: either with maximum and minimum values or with preferred (central) value and (±). When disposing of max and min, we calculate the mean to report the offset. FNS, fault normal slip.
terms of surface rupture with extensive description and slip mea-surements earthquakes, are available in detail in tables and Google Earth files (Choiet al., 2018;Kurtzet al., 2018).
FUTURE EVOLUTION OF THE SURE DATABASE
Contribution of High-Resolution Techniques
Modern field, Synthetic Aperture Radar (SAR), lidar, and pho-togrammetric datasets contain a dense array of measurements
that capture primary and secondary rupture locations and, with the appropriate approaches, those high-resolution techniques are useful to quantify distributed deformation. These tech-niques, in part or in whole, have been applied recently to sev-eral earthquakes and have significantly improved geologists’ abilities to map and measure surface rupture and deformation associated with moderate events (e.g., 2014Mw 6 West Napa earthquake), earthquakes in remote or highly vegetated areas (e.g., 2010 Mw 5 Pisayambo, Ecuador). Quantifying the
Table 3(continued) Slip Observation Information Total fault
displacement
Net slip (NS) (m) and uncertainties In the slip_obs shapefile, we provide an NS value, either from measurement or from calculation based on horizontal and vertical components (in meters)
Net slip (NS) direction Direction (0°–360°) of the net slip vector
Large aperture net slip (NS) (m) Corresponds to the total offset of surface displacement, including on the discrete fault plane and off-fault flexure, if any (in meters) Plunge Angle between the horizontal plane and the Net slip vector (°).
Also called slip vector inclination
Pitch Angle between strike and slip vector measured in the fault plane (°). Also called Rake
Fault parameters Strike Fault strike with uncertainties or maximum and minimum values (in degrees)
Dip Fault plane dip, with uncertainties or max. and min. values. In degrees. If not given, we assume 90° (to calculate the net slip) Surface geology Cover bed b/b when rupture in bedrock, b/s when rupture between bedrock and sediments, s/s when rupture in sediments, h when rupture observed across human-made features
Cover nature—lithology Alluvium, colluvium, lacustrine, etc., and clay, sands, gravels, soil, calcrete, etc.
Thickness Thickness of cover bed sediments (in meters)
Structural pattern Fault pattern complexity Describe the observation site location with respect to pattern of the principal fault trace, for example, regular principal fault or complex pattern, such as fault tip, bend, gap, stepover or coseismic fold Hanging wall vs. footwall Describe the relative location of observed distributed slip with
respect to principal fault plane Morphologic context Local slope (%) Value of slope at observation location
Location in topography Relative location with respect to local topography (i.e., top of slope, base level, etc.)
Water table depth In meters
Comment Any relevant information
In the shapefile attribute file, we report longitude and latitude in decimal degrees, referenced in the World Geodetic System of 1984 (WGS84) geographic coordinates system, net slip values in meters and the surface geology for few events. More complete data are provided in theⒺ supplemental content. In some cases, the net slip value has been directly reported by the authors; however, in most cases, value of slip along fault strike and vertical throw of coseismic slip are provided. Actual vertical component of slip (dip slip) has been obtained by fixing an arbitrary vertical dip when value is not specified. The dataset as well includes information about heave (i.e., horizontal component of relative displacement perpendicular to fault), with negative ones when lengthening and positive ones when shortening. The displacements are given in absolute values. Sense of displacement is given separately, in a specific column. Few cases have detailed information on fault azimuth and dip. The table allows the further implementation of large aperture offset, which sums up the discrete slip on the fault trace and the inelastic part of deformation that can occur at tens to hundreds of meters (see an illustration of that inKearseet al., 2018), and for structural complexity. Uncertainties can be reported in two ways: either with maximum and minimum values or with preferred (central) value and (±). When disposing of max and min, we calculate the mean to report the offset. FNS, fault normal slip.
Table 4
Main Characteristics of the 45 Earthquakes Included in the SURE Database
IdE* yyyy/mm/dd Name Region Mw Longitude (°) Latitude (°) Depth (km) FM†
18720326 1872/03/26 Owens lake U.S.A. 7.45 −118.1 36.65 SS
18870503 1887/05/03 Sonora Mexico 7.5 −109.25 30.8 N
18911028 1891/10/28 Nobi Japan 7.4 136.6 35.6 10 SS
18960831 1896/08/31 Rikuu Japan 6.7 140.7 39.5 10 R
19110103 1911/01/03 Chon-Kemin Kazakhstan/Kyrghystan 7.7 78.53 43.013 20 R
19151003 1915/10/03 Pleasant Valley U.S.A. 6.8 −117.654 40.258 10 N
19181111 1918/11/11 Omachi Japan 6.4 137.3 36.1 10 R
19270307 1927/03/07 North Tango Japan 7.1 135.0129 35.6317 10 SS
19301125 1930/11/25 North Izu Japan 6.9 139.1295 35.0497 15 SS
19380529 1938/05/29 Kussharo Japan 5.8 145.0109 42.9999 0 SS
19390501 1939/05/01 Oga Japan 7 139.771 39.979 10 SS
19430910 1943/09/10 Tottori Japan 7 133.9932 35.4481 15 SS
19440115 1944/01/15 La Laja Argentina 7.2 −68.491 −31.496 15 R
19450112 1945/01/12 Mikawa Japan 6.7 137.0638 34.6123 10 R
19541216 1954/12/16 Fairview Peak U.S.A. 7.1 −117.981 39.346 10 N
19541217 1954/12/16 Dixie Valley U.S.A. 6.6 −117.704 39.207 15 N
19590130 1959/01/30 Deshibori Japan 6 144.5088 43.3708 25 SS
19590818 1959/08/18 Hebgen Lake U.S.A. 7.2 −110.891 44.63 10 N
19680409 1968/04/09 Borrego Mountain U.S.A. 6.6 −116.234 33.058 10 SS
19710209 1971/02/06 San Fernando U.S.A. 6.7 −118.4126 34.2740 8.4 R
19740508 1974/05/08 Izu peninsula Bay Japan 6.4 138.753 34.5719 10.3 SS
19780114 1978/01/14 Izu Offshore Japan 6.6 139.2254 34.8023 24.4 SS
19791015 1979/10/15 Imperial Valley U.S.A. 6.5 −115.374 32.752 10 SS
19800525 1980/05/25 Mammoth lake U.S.A. 6.2 −118.908 37.53 10.2 N
19831028 1983/10/28 Borah Peak U.S.A. 6.9 −113.796 44.092 10 N
19840913 1984/09/13 Nagano Prefecture Japan 6.2 137.4871 35.7824 17.9 SS
19870302 1987/03/02 Edgecumbe New Zealand 6.5 176.80 −37.89 10 N
19871124 1987/11/24 Superstition Hills U.S.A. 6.5 −115.886 33.011 10 SS
19920628 1992/06/28 Landers U.S.A. 7.3 −116.557 34.188 10 SS
19950116 1995/01/16 Hyogo Prefecture Japan 6.9 135.0409 34.554 19 SS
19980903 1998/09/03 Iwate Prefecture Japan 5.8 140.7555 39.743 7.6 R
19990817 1999/08/17 İzmit Turkey 7.6 29.979 40.807 15 SS
19991016 1999/10/16 Hector Mine U.S.A. 7.1 −116.387 34.539 20 SS
20001006 2000/10/06 Tottori Prefecture Japan 6.7 133.157 35.38 0.6 SS
20021103 2002/11/03 Denali U.S.A. 7.9 −147.597 63.512 12.5 SS
20041023 2004/10/23 Niigata Prefecture Japan 6.6 138.7706 37.3032 8.5 R
20080613 2008/06/13 Iwate-Miyagi Japan 6.9 140.7365 39.1514 11.6 R
20090406 2009/04/06 L'Aquila Italy 6.3 13.353 42.368 10 N
20100326 2010/03/26 Pisayambo Ecuador 5 −78.32 −1.24 10 SS
20100404 2010/04/04 El Mayor Mexico 7.2 −115.266 32.348 10 O
20100903 2010/09/03 Darfield New Zealand 7.2 172.17 −43.53 11 SS
20140824 2014/08/24 Napa U.S.A. 6 −122.312 38.215 11.1 SS
20141122 2014/11/22 Nagano Prefecture Japan 6.2 137.888 36.641 9 R
20160415 2016/04/15 Kumamoto Japan 7 130.77 32.84 12.9 SS
20161030 2016/10/30 Norcia Italy 6.5 13.1107 42.8322 9.2 N
SURE, SUrface Ruptures due to Earthquakes. *Identifying number of the earthquake. †Focal mechanism of the earthquake.
magnitude and spatial distribution of off-fault deformation produced during earthquakes is now possible using subpixel correlation of pre- and postseismic optical images. This tech-nique has been successfully applied to strike-slip faulting earth-quakes such as the Landers and Hector Mine events in California (Millineret al., 2016), the 2013 Balochistan earth-quake in Pakistan (Vallageet al., 2015), or the 2016 Kaikōura earthquake ruptures (Klingeret al., 2018). Figure6provides an illustration of the results coming out from the same geodetic analysis (modified from Champenois, Klinger, et al., 2017), clearly showing the potential for estimating the total width and amount of slip accommodated on and off the main fault. However, the process is not fully automated and subject to some judgment. For example, the calculated total slips across a given profile in Figure6are based on projected linear fits of the deformation field out of the fault. Selection of the appro-priate linear fit can be challenging and subjective when the profiles reflect near-fault warping or tilting.
Although estimates of total deformation and fault zone width obtained from pixel-correlated stacked profiles fill a data gap that cannot be resolved with conventional field techniques, distinguishing between localized on-fault offset and distributed off-fault deformation is also of interest for engineering appli-cations. Proportioning the total slip onto localized or mapped ruptures can be difficult and unreliable without companion field mapping or lidar analysis. For example, the secondary fault identified in profile P1 in Figure6is not appreciably dif-ferent from other localized offsets southeast of the Kekerengu fault (e.g., at profile distance∼3:8 km); however, when these profiles are combined with some form of ground truthing, accurate measurements of on-fault slip, off-fault deformation, and fault zone width are obtainable.
Deriving Probabilities for FDHA
Youngset al. (2003, p. 196) were the first to define“principal faulting [as] slip along the main plane (or planes) of crustal weakness responsible for the release of seismic energy during the earthquake” and “distributed faulting (…) as displacement that occurs on other faults, shears, or fractures in the vicinity of the principal rupture in response to the principal faulting,, and used this ranking to derive independent probabilities.
Based on the statement that secondary faulting is con-nected or structurally related to the principal rupture, we pro-pose that the entire deformation field, including slip traces, enclosed in the coseismic crustal volume could be defined as secondary manifestation of principal slip. The volume of con-cern can be mapped according to InSAR, for shallow earth-quakes around the world. As an example, the surface deformation related to 2010 Mw 7.2 El Mayor–Cucapah earthquake (northern Mexico) is mainly at less than 2 km around the principal fault (Fletcher et al., 2014) within this strained volume imaged by the InSAR fringes (Fig. 7). However, small slip on U.S. active faults have been mapped in remote position (Rymeret al., 2011;Wei, Sandwell,et al., 2011;Donnellanet al., 2014), and they are assigned to trig-gered slip probably responding to seismic waves.
The 1992 Landers earthquake rupture produced a broad range of surface-slip amplitudes on multiple fault traces. Along the majority of the rupture, series of short ruptures with low oblique slip (maximum 30 cm) splits from a quite straight and simple trace of the South Johnson Valley or Homestead faults with dextral offsets up to 3.0 m; the former would be named distributed ruptures, the latter principal rupture. In other sec-tions, the Landers rupture is much more complex, with multi-ple and overlapping continuous traces, namely the Johnson fault and the Homestead fault, which were connected by the previously unknown Kickapoo fault—but eventually recog-nized as a cumulative fault by Rockwell et al. (2000) —sur-rounded by distributed ruptures (Fig. 8). Dealing with the ranking, this part of the Landers surface rupture poses the issue to determine which of those three rupture(s) is (are) to be con-sidered as primary in further statistical analyses. One solution could be to introduce an intermediary category of surface rup-ture, like a subsidiary principal rupture to cover the case of the large continuous rupture with significant offset mapped on a previously undescribed fault (Kickapoo segment).
Once the database historical cases are ranked in terms of principal versus distributed fault displacement, one needs to complete significant tasks before derivation of empirical rela-tionships for PFDHA. Choosing how to estimate probability of faulting and distances is rather straightforward along pri-mary faults. However, the same operation requires more engag-ing hypotheses for distributed ruptures. In the classical approach (Youngset al., 2003;Petersenet al., 2011), estima-tion of probability occurrence of distributed faulting is per-formed by counting ruptured cells in a grid; then distances of distributed slip evidences are measured to a simplified prin-cipal fault trace. Another approach is used by Boncio et al. (2018) who measure the actual distances between principal and distributed ruptures at each secondary trace, previously cretized in a chosen interval (200 m). In this method, the dis-tance between principal fault and distributed traces is measured perpendicular to the averaged principal fault direction. The data are used for building probability density functions, that is, the number of ruptures with respect to distance unit to the principal fault. The gridding method contains the assumption of the database completeness because counting the zero rup-ture pixels over the whole surface area surrounding the prin-cipal fault, whereas the method byBoncio et al. (2018) only considers sections of principal faults with reported distributed data to calculate the occurrence probability. The probability density functions obtained in this method can be considered as upper bounding the hazard.
An alternative to the primary versus secondary approach is to derive probabilistic displacement models based on the amplitude and spatial distribution of displacement relative to a nominal trace (Fig. 9a). Such an approach is at the very early stages of evaluation as part of the UC FDHI project (Sarmiento et al., 2019). A nominal trace approach addresses the need for a linearly continuous spatial reference when developing predictive probabilistic displacement models while avoiding potentially subjective or difficult tasks of ranking of
▴
Figure 6. Example of application of optical correlation technique to map and measure the on-fault and near-field surface deformation during surface-rupturing earthquakes (2016Mw 7.8 Kaikōura earthquake in New Zealand). (a,b) Horizontal displacement field from the correlation of optical images (pre-earthquake SPOT6 and postearthquake Pléiades; spatial resolution 1.8 m), using the MicMac software (seeData and Resources); coordinates are in Universal Transverse Mercator (×105 m for X, 106 m for Y). Black lines are the fault traces mapped on Pléiades images. (a) East–west component of displacement, (b) North–south component of displacement. (c–e) P1–P3 are to-fault profiles showing the relative displacement in parallel-to-fault (strike-slip component) direction or (f) perpendicular-to-fault (contraction or elongation) direction. Those profiles give insight on the distribution of deformation off the major fault. SeeKlinger et al. (2018)for more information on the methodology (modified from Champenoiset al., 2017b). The color version of this figure is available only in the electronic edition.mapped ruptures (e.g., primary vs. secondary) based on geologi-cal appreciation or choice. The nominal trace also provides a reference for length along rupture, a metric commonly used in displacement databases and models (e.g., Wesnousky, 2008; Petersenet al., 2011), as well as a reference point for considering the sensitivity of known versus inferred rupture locations at a site.
Defining a nominal trace at the database development stage (rather than a modeling stage) has the added benefit of providing a linearly continuous spatial reference for
quantifying data density variability. Most earthquakes have sections of mapped ruptures that lack offset measurements (due to lack of piercing points, inaccessibility, etc.) yet surely accommodated significant displacement. This is difficult to quantify without an areal metric but nonetheless necessary for developing pre-dictive models of fault displacements. Using a nominal trace, uniform areas or zones relative to the trace can be developed. For example, a nominal trace can be subdivided into 1 km increments, and a buffer extending 5 km on either side of the trace can define a rectangular zone (Fig.9b). Database metrics can be cata-loged by zone, such as the number of slip observations, the number of mapped ruptures, the width of mapped ruptures, and so on. Zones could also serve as the basis for fractal dimension analysis using box-counting tech-niques, as explored in Milliner et al. (2016). Collectively, these metrics can provide model-ers a quantitative and objective basis for evalu-ating structural complexity.
SUMMARY
The PFDHA, in its earthquake approach, involve empirical relationships that need to be updated and improved. Two workshops (Paris, 2015, and Menlo Park, 2016) were focused on the construction of the SURE database for FDHA. SURE, in this first release, counts data for 45 earthquakes, with more than 15,000 slip measurements and 50,000 rupture sections. After implementation of additional literature datasets in a near future, a big challenge for the SURE database will be the enrichment in well-documented earthquakes with both geo-logically and geodetically derived data and the inclusion of poorly represented regions of the world (especially continental Asia and Africa). Key long-term goals for the SURE database include incorporating the local geology infor-mation to the implemented data, adding the data derived from the aforementioned modern high-resolution techniques, and improving the global coverage of events in the database. The modern meas-urement techniques provide the most complete observations of surface deformation, with high-measurement density both along faults and perpendicular to faults, and these data will improve estimates of fault displacements in future earthquakes. This first release of SURE is the proof that the mobiliza-tion of the earthquake geologists’ community to fill the knowl-edge gaps has started. The earthquake geologists’ community is encouraged to pursue the collecting, compiling, and updating of fault rupture datasets, with the effort to make them available
▴
Figure 7. This map superimposes the surface ruptures observed after the 2010 Mw 7+ El Mayor–Cucapah earthquake (Mexico) and a couple of Advanced LandObservation Satellites (ALOSs) ascending interferograms (15 January 2010–17 April 2010 and 17 December 2009–04 May 2010) (Wei, Fielding,et al., 2011). Red arrows mark the approximate external fringe of ALOS interferograms that could match the boundary of the volume that has been strained during the 4 AprilMw 7.2 earth-quake. Yellow dots are the triggered-slip evidences described inRymeret al. (2011)
and black dots are the (primary and secondary) slip evidences byFletcheret al. (2014). Green stars are the epicenters of the main event (4 April 2010) and the major aftershock to the northern tip of the fault (15 June 2010). A large part of the prin-cipal fault rupture did not reach the surface, probably accommodated in the soft-sediment pack of the Colorado River delta. Thin black rectangles represent the surface projection of the idealized fault segments used in theWei, Fielding,et al. (2011)modeling to reproduce the observation datasets from seismology and geod-esy. Modified fromWei, Fielding,et al. (2011). EMC, El Mayor–Cucapah fault. The color version of this figure is available only in the electronic edition.
for the SURE database. The U.S. community recently initiated a multiyear study that aims to develop a database combining field and geodetic measurements of earthquake-related surface faulting to be used in surface-faulting hazard analyses in the western United States (Sarmientoet al., 2019).
Populating the SURE database will provide direct benefits to the entire community for specific researches and applied sciences advances. We are opening an online exchange space and repository of data (see Data and Resources), which is guaranteed for a couple of years (European Seismological Commission).
DATA AND RESOURCES
All the data reported in the database, together with its companion article, come from published articles, documents, or maps. In the Ⓔ supplemental content, we report data and
models from the U.S. Geological Survey (USGS) fault database (https://earthquake.usgs.gov/hazards/qfaults/), from the GNS active faults database (http://data.gns.cri.nz/af/), the International Seismological Centre-Global Earthquake Model (ISC-GEM) earthquake database (ISC-GEM Earthquake Catalogue, 2019, doi: 10.31905/D808B825), from the SRCMOD online database of slip distributions (http://equake -rc.info/SRCMOD/), and from the CRUST 1.0 model for crustal thickness (https://igppweb.ucsd.edu/~gabi/crust1.html). The information about Trans-Alaska oil pipeline is available at https://pubs.usgs.gov/fs/2003/fs014-03/pipeline.html. The Fault2SHA European Seismological Commission (ESC) working group is available at www.fault2sha.net. MicMac software is available at https://micmac.ensg.eu/index.php/ Accueil. The USGS earthquake hazards program website is available at https://earthquake.usgs.gov/earthquakes/. All websites were last accessed on June 2019.
▴
Figure 8. This map shows an 18 km long section of the Mw 7.3 Landers earthquake with a complex rupture pattern, according toPetersen et al. (2011)dataset (original data fromHartet al., 1993). Two major continuous ruptures (in red) with 1–3 m dextral offsets coincide known active faults (the Johnson and Homestead valleys faults) underlined by black arrows. In the stepover between those two strands, discontinuous and small-slip segments are considered secondary and distributed traces, whereas a rather continuous and large displacement evidences (1–3 m) connects them (the Kickapoo segment, in yellow). White labels represent the net slip values. (Inset) Location in southern California of the complete surface rupture associated with the 1992 Landers earthquake and location of the focused area. USGS, U.S. Geological Survey. The color version of this figure is available only in the electronic edition.
ACKNOWLEDGMENTS
Institut de Radioprotection et de Sûreté Nucléaire (IRSN) organized and funded the first meeting in October 2015 in Paris, France, with 20 attendees from New Zealand, South America, United States, Italy, United Kingdom, and France. The U.S. Geological Survey (USGS) and California Geological Survey (CGS) were in charge of funding and organ-izing the second workshop in Menlo Park (U.S.A.), in December 2016. More than 110 scientists, stakeholders, and engineers attended. The authors are grateful to those who contributed to the initial discussions, especially Yoshi Fukushima (International Atomic Energy Agency [IAEA], Vienna, Austria), Christophe Clément, Hervé Jomard, and Marc Cushing (IRSN, France), Yann Klinger (Institut du Physique du Globe de Paris [IPGP]), Thomas Chartier (Ecole Normale Supérieure Paris [ENS], France), Eugénie Pérouse (Centre Européen de Recherche et d’Enseignement des Géosciences de l’Environnement [CEREGE], France), Jochen Hürtgen (University of Aachen, Germany), Austin Elliott and Richard Walker (Centre for the Observation and Modelling of Earthquakes, Volcanoes and Tectonics [COMET], United Kingdom), and Alessandro Maria Michetti (University of Como, Italy). The authors also
give credit to Christopher Milliner (reviewer) and to Zhigang Peng (Editor-in-Chief ) who promptly and efficiently helped us improve our work. The SUrface Ruptures due to Earthquakes (SURE) initiative is part of the SURFACE project supported by the International Union for Quaternary Research (INQUA; www.earthquakegeology.com, last accessed July 2019) between 2016 and 2019. It is linked to the IAEA effort to formalize the Fault Displacement Hazard Analysis (FDHA) into a pending Technical Document (TECDOC) to which some of the authors are contributors.
All six first authors contributed equally to this work (writ-ing, data compilation); the other authors were classified by alphabetical order.
REFERENCES
Arrowsmith, J. R., C. J. Crosby, A. M. Korzhenkov, E. Mamyrov, I. Povolotskaya, B. Guralnik, and A. Landgraf (2017). Surface rupture of the 1911 Kebin (Chon–Kemin) earthquake, Northern Tien Shan, Kyrgyzstan, Geol. Soc. Lond. Spec. Publ. 432, 233–253, doi:10.1144/SP432.10.
Baize, S., and O. Scotti (2017). Fault Displacement Hazard Analysis Workshop in Menlo Park (USGS, California) 89/12/2016
-▴
Figure 9. Example definition of nominal trace and zones for 1992 Landers earthquake. (a,b) Red lines are field mapped ruptures from USGS Quaternary Fault and Fold Database. Blue line is nominal trace. (b) Light green rectangles are zones 1 km long and 10 km wide. The color version of this figure is available only in the electronic edition.Synthesis and Perspectives, Institut Radioprotection Sûreté Nucléaire, doi:10.5281/zenodo.1041821.
Baize, S., F. Cinti, C. Costa, T. Dawson, A. Elliott, L. Guerrieri, J. McCalpin, K. Okumura, O. Scotti, M. Takao, et al. (2016). Surface Rupture Database for Seismic Hazard Assessment - 2015 Report of the Kick-Off Meeting of the SURE Database Working Group, Institut Radioprotection Sûreté Nucléaire, doi: 10.5281/ zenodo.2314963.
Barka, A., H. S. Akyüz, E. Altunel, G. Sunal, Z. Çakir, A. Dikbas, B. Yerli, R. Armijo, B. Meyer, J. B. Chabalier,et al. (2002). The surface rup-ture and slip distribution of the 17 August 1999İzmit earthquake (M 7.4), North Anatolian Fault,Bull. Seismol. Soc. Am.92, 43–60, doi:10.1785/0120000841.
Beanland, S., and M. M. Clark (1994). The Owens Valley fault zone, eastern California, and surface faulting associated with the 1872 earthquake,U.S. Geol. Surv. Bull. No. 1982, doi:10.3133/b1982. Beanland, S., K. R. Berryman, and G. H. Blick (1989). Geological inves-tigations of the 1987 Edgecumbe earthquake, New Zealand, New Zeal. J. Geol. Geophys. 32, 73–91, doi: 10.1080/ 00288306.1989.10421390.
Boncio, P., F. Liberi, M. Caldarella, and F.-C. Nurminen (2018). Width of surface rupture zone for thrust earthquakes: Implications for earthquake fault zoning,Nat. Hazards Earth Syst. Sci.18, 241– 256, doi:10.5194/nhess-18-241-2018.
Bonilla, M. G., J. M. Buchanan, R. O. Castle, M. M. Clark, V. A. Frizzell, R. M. Gulliver, F. K. Miller, J. P. Pinkerton, D. C. Ross, R. V. Sharp, et al. (1971). The San Fernando, California, earthquake of February 9, 1971.U.S. Geol. Surv. Profess. Pap. 733, 55–76.
Brozzetti, F., P. Boncio, D. Cirillo, F. Ferrarini, R. Nardis, A. Testa, F. Liberi, and G. Lavecchia (2019). High-resolution field mapping and analysis of the August–October 2016 coseismic surface faulting (Central Italy earthquakes): Slip distribution, parameterization, and comparison with global earthquakes,Tectonics 38, 417–439, doi:
10.1029/2018TC005305.
Caskey, S. J., S. G. Wesnousky, P. Zhang, and D. B. Slemmons (1996). Surface faulting of the 1954 Fairview Peak (MS 7.2) and Dixie Valley (MS 6.8) earthquakes, central Nevada, Bull. Seismol. Soc. Am.86, 761–787.
Castellanos, A. (1944). Contribución a los estudios sísmicos en la República Argentina, in El caso de San Juan (1944) (No. I, II, III), Monografías, Universidad Nacional del Litoral, Rosario, Argentina.
Champenois, J., S. Baize, M. Vallee, H. Jomard, A. Alvarado, P. Espin, G. Ekstöm, and L. Audin (2017). Evidences of surface rupture associ-ated with a low-magnitude (Mw 5.0) shallow earthquake in the Ecuadorian Andes: Andean earthquake surface rupture, J. Geophys. Res.122, 8446–8458, doi:10.1002/2017JB013928. Champenois, J., Y. Klinger, R. Grandin, C. Satriano, S. Baize, A. Delorme,
and O. Scotti (2017). Surface rupture and slip distribution of the 2016 Mw7.8 Kaikoura earthquake (New Zealand) from optical sat-ellite image correlation using MicMac, presented at theSSA 2017 Annual Meeting, Denver, Colorado, 18–20 April 2017, 655 pp. Chen, R., and M. D. Petersen (2011). Probabilistic fault displacement
haz-ards for the southern San Andreas fault using scenarios and empirical slips,Earthq. Spectra27, 293–313, doi:10.1193/1.3574226. Choi, J.-H.,Y. Klinger, M. Ferry, J.-F. Ritz, R. Kurtz, M. Rizza, L. Bollinger,
B. Davaasambuu, N. Tsend-Ayush, and S. Demberel (2018). Geologic inheritance and earthquake rupture processes: The 1905M ≥ 8 Tsetserleg-Bulnay strike-slip earthquake sequence, Mongolia, J. Geophys. Res.123, 1925–1953, doi:10.1002/2017JB013962. Cinti, F. R., R. Civico, A. M. Blumetti, L. Guerrieri, and G. Leoni (2018).
INGV - ISPRA joint surface faulting database - Mw 6.1, 2009, April 6th L'Aquila earthquake (Central Italy),PANGAEA doi:10.1594/ PANGAEA.889132.
Cinti, F. R., D. Pantosti, P. M. De Martini, S. Pucci, R. Civico, S. Pierdominici, L. Cucci, C. A. Brunori, S. Pinzi, and A. Patera (2011). Evidence for surface faulting events along the Paganica fault
prior to the 6 April 2009 L'Aquila earthquake (central Italy), J. Geophys. Res.116, doi:10.1029/2010JB007988.
Civico, R., S. Pucci, F. Villani, L. Pizzimenti, P. M. De Martini, R. Nappi, and the Open EMERGEO Working Group (2018). Surface rup-tures following the 30 October 2016 Mw 6.5 Norcia earthquake, central Italy, J. Maps 14, 151–160, doi: 10.1080/ 17445647.2018.1441756.
Clark, M. M. (1972). Surface rupture along the Coyote Creek fault, in The Borrego Mountain Earthquake of April 9, 1968, Geol. Surv. Profess. Pap., U.S. Department of the Interior, Washington, D.C., 55–86.
Clark, M. M., J. C. Yount, P. R. Vaughn, and R. L. Zepeda, (1982). Map showing surface ruptures associated with the Mammoth Lakes, California, earthquakes of May 1980, Misc. Field Stud. Map 1396, doi:10.3133/mf1396.
Crone, A. J., M. N. Machette, M. G. Bonilla, J. J. Lienkaemper, K. L. Pierce, W. E. Scott, and R. C. Bucknam (1987). Surface faulting accompa-nying the Borah Peak earthquake and segmentation of the lost river fault, central Idaho,Bull. Seismol. Soc. Am.77, 739–770. DeLong, S. B., A. Donnellan, D. J. Ponti, R. S. Rubin, J. J. Lienkaemper,
C. S. Prentice, T. E. Dawson, G. Seitz, D. P. Schwartz, K. W. Hudnut,et al. (2016). Tearing the terroir: Details and implications of surface rupture and deformation from the 24 August 2014 M 6.0 South Napa earthquake, California,Earth Space Sci.3, 416–430, doi:10.1002/2016EA000176.
Donnellan, A., J. Parker, S. Hensley, M. Pierce, J. Wang, and J. Rundle (2014). UAVSAR observations of triggered slip on the Imperial, Superstition Hills, and East Elmore Ranch faults associated with the 2010 M 7.2 El Mayor-Cucapah earthquake, Geochem. Geophys. Geosys.15, 815–829, doi:10.1002/2013GC005120. Fletcher, J. M., O. J. Teran, T. K. Rockwell, M. E. Oskin, K. W. Hudnut,
K. J. Mueller, R. M. Spelz, S. O. Akciz, E. Masana, G. Faneros,et al. (2014). Assembly of a large earthquake from a complex fault system: Surface rupture kinematics of the 4 April 2010 El Mayor–Cucapah (Mexico) Mw 7.2 earthquake, Geosphere 10, 797–827, doi:
10.1130/GES00933.1.
Gold, P. O., M. E. Oskin, A. J. Elliott, A. Hinojosa-Corona, M. H. Taylor, O. Kreylos, and E. Cowgill (2013). Coseismic slip variation assessed from terrestrial lidar scans of the El Mayor–Cucapah surface rupture, Earth Planet. Sci. Lett.366, 151–162, doi:10.1016/j.epsl.2013.01.040. Haeussler, P. J., D. P. Schwartz, T. E. Dawson, H. D. Stenner, J. J. Lienkaemper, B. Sherrod, F. R. Cinti, P. Montone, P. A. Craw, A. J. Crone, and S. F. Personius (2004). Surface rupture and slip distribution of the Denali and Totschunda faults in the 3 November 2002 M 7.9 earthquake, Alaska, Bull. Seismol. Soc. Am.94, S23–S52, doi:10.1785/0120040626.
Hanks, T. C., and H. Kanamori (1979). A moment magnitude scale,J. Geophys. Res.84, 2348, doi:10.1029/JB084iB05p02348. Hart, E. W., W. A. Bryant, and J. A. Treiman (1993). Surface faulting
associated with the June 1992 Landers earthquake, California,Calif. Geol.46, 10–16.
Hartleb, R. D., J. F. Dolan, H. S. Akyüz, T. E. Dawson, A. Z. Tucker, B. Yerli, T. K. Rockwell, E. Toraman, Z. Çakir, A. Dikbaş, and E. Altunel (2002). Surface rupture and slip distribution along the Karadere segment of the 17 August 1999İzmit and the western section of the 12 November 1999 Düzce, Turkey, earthquakes, Bull. Seismol. Soc. Am.92, 67–78, doi:10.1785/0120000829. Hemphill-Haley, M. A., and R. J. Weldon (1999). Estimating prehistoric
earthquake magnitude from point measurements of surface rupture, Bull. Seismol. Soc. Am.89, 1264–1279.
Inbal, A., J.-P. Ampuero, and J.-P. Avouac (2017). Locally and remotely triggered aseismic slip on the central San Jacinto Fault near Anza, CA, from joint inversion of seismicity and strainmeter data, J. Geophys. Res.122, 3033–3061, doi:10.1002/2016JB013499. International Seismological Centre-Global Earthquake Model (ISC-GEM)
Earthquake Catalogue (2019). ISC-GEM Global Instrumental Earthquake Catalogue, Version 6.0, doi:10.31905/D808B825.