doi: 10.3389/fphys.2020.00422
Edited by: Ewald Moser, Medical University of Vienna, Austria Reviewed by: Andreas Hess, University of Erlangen-Nuremberg, Germany Xiaoyun Liang, Australian Catholic University, Australia *Correspondence: Federico Giove [email protected]
†These authors have contributed
equally to this work
Specialty section: This article was submitted to Medical Physics and Imaging, a section of the journal Frontiers in Physiology Received: 30 September 2019 Accepted: 07 April 2020 Published: 08 May 2020 Citation: Moraschi M, Mascali D, Tommasin S, Gili T, Hassan IE, Fratini M, DiNuzzo M, Wise RG, Mangia S, Macaluso E and Giove F (2020) Brain Network Modularity During a Sustained Working-Memory Task. Front. Physiol. 11:422. doi: 10.3389/fphys.2020.00422
Brain Network Modularity During a
Sustained Working-Memory Task
Marta Moraschi1,2†, Daniele Mascali1,2†, Silvia Tommasin3, Tommaso Gili1,2, Ibrahim Eid Hassan4,5, Michela Fratini2,6, Mauro DiNuzzo7, Richard G. Wise8,9, Silvia Mangia10, Emiliano Macaluso11and Federico Giove1,2*
1Centro Fermi–Museo Storico della Fisica e Centro di Studi e Ricerche Enrico Fermi, Rome, Italy,2Fondazione Santa Lucia IRCCS, Rome, Italy,3Dipartimento di Neuroscienze Umane, Sapienza Univeristà di Roma, Rome, Italy,4Dipartimento di Fisica, Sapienza Università di Roma, Rome, Italy,5Department of Physics, Helwan University, Cairo, Egypt,6Istituto di Nanotecnologia, Consiglio Nazionale delle Ricerche, Rome, Italy,7Independent Researcher, Rome, Italy,8Institute for Advanced Biomedical Technologies, University of Chieti, Chieti, Italy,9Cardiff University Brain Research Imaging Centre, School of Psychology, Cardiff University, Cardiff, United Kingdom,10Center for Magnetic Resonance Research, Department of Radiology, University of Minnesota, Minneapolis, MN, United States,11ImpAct Team, Lyon Neuroscience Research Center, Université de Lyon, Lyon, France
Spontaneous oscillations of the blood oxygenation level-dependent (BOLD) signal are spatially synchronized within specific brain networks and are thought to reflect synchronized brain activity. Networks are modulated by the performance of a task, even if the exact features and degree of such modulations are still elusive. The presence of networks showing anticorrelated fluctuations lend initially to suppose that a competitive relationship between the default mode network (DMN) and task positive networks (TPNs) supports the efficiency of brain processing. However, more recent results indicate that cooperative and competitive dynamics between networks coexist during task performance. In this study, we used graph analysis to assess the functional relevance of the topological reorganization of brain networks ensuing the execution of a steady state working-memory (WM) task. Our results indicate that the performance of an auditory WM task is associated with a switching between different topological configurations of several regions of specific networks, including frontoparietal, ventral attention, and dorsal attention areas, suggesting segregation of ventral attention regions in the presence of increased overall integration. However, the correct execution of the task requires integration between components belonging to all the involved networks.
Keywords: functional connectivity, modularity, topology, working memory, connectivity dynamics, brain segregation
INTRODUCTION
Brain activity is associated, both at rest and during cognitive engagement, with spatial patterns of synchronized, slow (<0.1 Hz) blood oxygenation level-dependent (BOLD) fluctuations which identify different brain networks, namely, neural systems which are coupled together (Rogers et al., 2007). Functional connectivity (FC) can be characterized exploiting various analytical methods and metrics, but it is commonly defined as the temporal correlation between signals from anatomically distinct regions (Friston, 1994;Horwitz, 2003). Consistency of resting-state functional magnetic resonance imaging (fMRI) networks in healthy human adults is well established (Damoiseaux et al., 2006;van den Heuvel and Hulshoff Pol, 2010) and the pathophysiological relevance of network
connectivity changes induced by several diseases and aging has been reported (Sala-Llonch et al., 2014;Zhao et al., 2014;Mascali et al., 2015;Brueggen et al., 2016).
However, the current knowledge of modulation properties of networks and function in response to experimental challenges is still incomplete. In particular, little is known about the changes of functional interaction between networks during the execution of a task.
Several studies (Fox et al., 2005; Fransson, 2006; Golland et al., 2008) roughly identified two distinct large-scale systems, based on their observed functional response to stimuli requiring external attention, including working-memory (WM) tasks. One large system is implicated in cognitive functions entailing attentional demand, in particular top-down or goal-directed attention (Corbetta and Shulman, 2002;Fox et al., 2005;Corbetta et al., 2008). This system, usually named task-positive network (TPN) (Fox et al., 2005), includes the dorsal attention network (DAN) and ventral attention network (VAN), the frontoparietal network (FPN), as well as somatosensory and visual areas. The second system, identified as the default mode network (DMN) (Buckner et al., 2008), responds to attention-demanding tasks with a decreased BOLD signal, thus indicating deactivation (Harrison et al., 2008), while being preferentially activated during unconstrained thoughts, introspection, memory retrieval, and self-evaluation of future perspective (Greicius and Menon, 2004;
Greicius et al., 2004; Fransson, 2006; Buckner et al., 2008;
Fornito et al., 2012).
Spontaneous BOLD fluctuations in TPN and DMN were found to be reciprocally anticorrelated (Fox et al., 2005), and the internal coherency fluctuations were found differently modulated during cognitive functions, often in opposite directions (Lowe et al., 2000; Hampson et al., 2002, 2006; Newton et al., 2007; Gordon et al., 2014; Liang et al., 2016). At first, this competitive nature was thought to foster the switching between internal thought and reaction to external stimuli, to support the efficiency of brain processing (Fox et al., 2005; Fransson, 2006;Golland et al., 2008). Indeed, the degree of anticorrelation between DMN and TPN regions has been associated with faster reaction times during cognitively demanding tasks (Kelly et al., 2008) and better performance in WM n-back tasks (Hampson et al., 2006).
However, other studies supported task-specific cooperation rather than competition between DMN and TPN areas (Newton et al., 2007;Spreng et al., 2010;Bluhm et al., 2011;Leech et al., 2011;Fornito et al., 2012;Bray et al., 2015;Piccoli et al., 2015;
Zuo et al., 2018). Cooperative dynamics was found to entail reallocation of flexible areas inside each network, implying a topological reorganization of networks themselves (Bullmore and Sporns, 2009; Braun et al., 2015; Liang et al., 2016). Flexible modules are thought to operate as functionally independent entities in response to specific environmental demands (Newton et al., 2007;Spreng et al., 2010;Leech et al., 2011;Fornito et al., 2012;Bray et al., 2015;Piccoli et al., 2015;Vatansever et al., 2015), and modular reorganization has been shown to be associated with behavior (Leech et al., 2011;Fornito et al., 2012;Braun et al., 2015;
Vatansever et al., 2015) and modified by pathology (Crossley et al., 2013;Lerman-Sinkoff and Barch, 2016;Bordier et al., 2018).
In a recent study investigating FC adaptations to a sustained n-back WM task, we have shown that connectivity changes associated with task execution include a widespread modulation of synchronization patterns both within and between brain networks (Tommasin et al., 2018). This widespread change preserved the gross topology of whole-brain connectivity, with the exception of specific areas within some networks, including DMN, FPN, DAN, and VAN. These findings raise the issue of identifying the topological relations between flexible areas that showed adaptation to the task. In the present work, we applied to the same data of our previous study the graph analysis developed byFornito et al. (2012)to identify the relevance and the behavioral role of the topological reorganization of a set of brain networks during a steady-state working-memory task.
MATERIALS AND METHODS
Subjects
Twenty right-handed Italian-speaking subjects (eight females, age 33 ± 6 years), with no history of neurological or psychiatric disease, participated in the study. All subjects gave written informed consent in accordance with the Declaration of Helsinki and European Union regulations and the Ethics Committee of Santa Lucia Foundation in Rome approved the study. Subjects and data included in this study are the same involved in our previous study (Tommasin et al., 2018).
Image Acquisition
Data were collected on a head-only 3 T MRI Scanner (Magnetom Allegra, Siemens Healthineers, Erlangen, Germany) equipped with a standard quadrature birdcage coil, used for both transmission and detection. Functional images were acquired via a gradient-echo planar imaging (GE-EPI) sequence (TR = 2100 ms, TE = 30 ms, FA = 70◦
, voxel size 3 × 3 × 2.5 mm3) lasting 24 min and 38 s for a total of 704 volumes (four dummy scans included). The slices were positioned starting from the vertex and covered the whole cerebrum. High resolution T1-weighted images were acquired for anatomic reference and tissue segmentation purpose using a Magnetization Prepared Rapid Acquisition Gradient Echo (MPRAGE, TE = 4.38 ms, TR = 2000 ms, FA = 8◦
, voxel size 1.33 × 1.33 × 1 mm3).
Stimulation Paradigm and Task
Performance
The experimental setup and stimulation paradigm are fully described inTommasin et al. (2018). Briefly, BOLD data were acquired within a block-design paradigm, composed of alternated epochs of open-eyes resting state and sustained auditory WM task (4 min and 54 s each, starting with a resting-state epoch). The auditory WM task involved continuous n-back trials at “high” load (two-back) or “low” load (one-back). Each trial was composed of a 500-ms window, in which subjects were aurally presented with a pseudorandom vowel, and a subsequent 1600-ms response window, during which subjects had to report whether the current vowel was the same as the one presented
one stimulus prior (one-back) or two stimuli prior (two-back). Subjects responded via an MRI compatible two-button keyboard, with one button reserved for positive responses (matching trial) and one button reserved for negative responses (not matching trial). During the entire functional run, subjects were asked to maintain the gaze on the center, marked by a 1◦
circle over a uniform black background.
Each subject underwent two functional runs during the same experimental session, with epoch ordering: rest/one-back/rest/two-back/rest or rest/two-back/rest/one-back/rest.
Subjects responses to the WM task were monitored at runtime and recorded for subsequent correlation analyses with modularity metrics (see below). For each subject, performance during each task epoch was evaluated in terms of accuracy computed as the percentage of valid responses on the number of trials (response was considered as valid, if it was both correct and given during the 1600-ms response window).
Image Preprocessing and Processing
Functional and structural MRI data were pre-processed using FC toolbox (CONN 17.c) (Whitfield-Gabrieli and Nieto-Castanon, 2012) and analyzed with dedicated in-house routines based on Matlab R2013a (The Mathworks Inc., Natick, MA, United States) and AFNI (Cox, 1996). Detailed descriptions of preprocessing steps are reported inTommasin et al. (2018). Briefly, functional images underwent motion and slice-timing correction, and were normalized to the Montreal Neurological Institute (MNI) space (voxel size 2 × 2 × 2 mm3). Spurious variance was further
removed by regressing out motion-derived parameters and aCompCor signals (Behzadi et al., 2007), by applying a bandpass filter (0.008–0.09 Hz) and by censoring motion-contaminated volumes (Jo et al., 2013). Finally, spatial smoothing was applied with an 8 × 8 × 8 mm3FWHM Gaussian kernel. An unsmoothed
version of the data was retained for FC computation.
Each functional run was split in five epochs. The first resting-state epoch was discarded from analyses and was used only for cortical parcelation. Specifically, using the smoothed data of the first epochs (resting epochs), the cortex was parcelated in 350 regions of interest (ROIs) by means of group level ROIs based on the similarity among voxel time courses (Craddock et al., 2012). ROIs were then classified into seven large-scale networks using the atlas fromYeo et al. (2011). We retained ROIs belonging to four networks of interest (205 ROIs) which included the DAN, DMN, the FPN, and the VAN networks. These four networks showed the most conspicuous traces of reorganization in spite of the overall preserved topology that we had reported on the same dataset (Tommasin et al., 2018), and are thought to respond during the execution of a WM task, as described in Section “Introduction.”
The remaining four epochs, i.e., one-back, two-back, and two resting states, were used to extract epoch-related FC. For each ROI and epoch, an average time-course was extracted from unsmoothed data and correlated to each other ROI time-course, leading to an ROI-to-ROI (205 × 205 sized) correlation matrix. Fisher’s Z transformation was applied to the correlation matrix to improve normality. Then, correlation matrices computed from homologous epochs, as well as from task epochs with
different load levels, were averaged for each subject in order to obtain two single resting-state and task-related matrices for each subject. These connectivity matrices were fed into the graph analysis procedure described below. The common treatment of both task levels conforms to choices adopted in our previous study, justified by the observation that the network behavior was indistinguishable between the levels; in particular we did not observe reproducible FC effects of task load (for details, see
Tommasin et al., 2018).
Graph Analysis
We used the modularity analysis proposed byFornito et al. (2012)
to characterize networks reconfiguration during rest and task conditions. Modules are defined as clusters of nodes showing greater FC within the clusters than with the rest of the brain.
For each subject and condition (i.e., rest and task), we modeled interactions between networks as a graph of 205 nodes, representing regions of parcelation constituting each network. We identified the optimal modular decomposition, maximizing a quality function (Q) (Rubinov and Sporns, 2011) reflecting the goodness of partition, using the Louvain method (Blondel et al., 2008), implemented in Brain connectivity Toolbox1, with
resolution parameter set to unity. We defined the optimal modular decomposition as the partition with the maximum Q over 10,000 iterations of the algorithm.
The modularity, as expressed by Q, gives an index of degree of modular segregation in the graph (Lebedev et al., 2018). Q is close to one when there are few edges between modules and high density inside modules, while Q is close to zero when the number of connections between modules is comparable to those of a random graph. We compared Q between conditions by means of a two-sample pairedt-test.
For each subject and each node in the graph, from the optimal modular decomposition, we computed the within-module strength, z, and the diversity coefficient, h, for rest (named zR and hR) and task (named zT and hT) condition,
respectively. The within-module strength quantifies the node’s intramodular connectivity and it was calculated as the z-score-transformed degree of centrality within the module. Formally, for each nodei, ziis defined as
zi=
si(mi) − ¯s(mi)
σ¯s(mi)
wheremiis the module containing nodei, si(mi) is the
within-module node strength (i.e., the sum of the within-within-module weights of node i), and ¯s(mi) and σ¯s(mi) are the mean and standard
deviation of the within-module strength of all nodes in module mi, respectively (Fornito et al., 2012). The diversity coefficient
describes the node’s distribution of intermodular connectivity and it was calculated with the normalized Shannon entropy, specifically hi= 1 logm X uM
pi(u) log pi(u)
wherepi(u) = si(u)si ,si(u) is the strength of node i in module
u, and m is the number of modules in the partition M (Shannon, 1948;Rubinov and Sporns, 2011;Fornito et al., 2012). Thus, nodes with high z values are suggested to represent local intramodular hubs, while nodes with high h values, presenting an even distribution of connectivity across modules, are suggested to support functional integration between modules (Fornito et al., 2012).
We further characterized modularity at group level using the following procedure (Fornito et al., 2012). For each subject and condition, from the optimal modular decomposition, we constructed a 205 × 205 co-classification matrix (cC) in which the element cCij = 1 if nodes i and j belong to the same
module and cCij= 0 otherwise. For each condition, we derived
a group consistency matrix as the summation over all subjects of the co-classification matrices. Thus, the group consistency matrix represents the node co-classification frequency across subjects. The group consistency matrix was then subjected to a further modular decomposition in order to obtain an optimal group modularity matrix, for rest and task condition, respectively (also in this case the algorithm was iterated 10,000 times for testing degeneracies in the data and the resolution parameter was set to its default value). From the two optimal group modularity matrices, we determined the nodes that changed module membership from rest to task condition and we mapped them onto brain volume.
Similar to the subject-level analysis, for both conditions, we characterized the role of each node in the network at the group level by means of z and h computed on the optimal group modularity (Guimera and Amaral, 2005). At group level, nodes with highz values have highly conserved modular membership across subjects, while nodes with highh values have a variable membership identity across participants (Fornito et al., 2012).
Statistical Inference
To investigate the behavioral role of the degree of integration between modules, the diversity coefficienth of each node during task was correlated with subjects’ accuracy in task execution via Pearson’s correlation coefficient. Results were corrected for multiple comparisons across nodes via false discovery rate (FDR;
Benjamini and Hochberg, 1995).
In order to assess the statistical significance of the topological configuration changes between rest and task conditions, we used a permutation test, using an approach similar to what proposed by Alexander-Bloch et al. (2012)and applied by Bordier et al. (2018). Specifically, we used the normalized mutual information (NMI,Kuncheva and Hadjitodorov, 2004) to assess the similarity between rest and task optimal group modularity matrices and compared it to a null distribution. If the change in topological configuration was driven by the experimental condition, then the experimental data should have yield a lower NMI value than those generated from the null distribution. To build the null distribution we repeated 10,000 times the process to generate the optimal group modularity matrices, each time randomly relabeling the rest and task conditions (permutations constrained via within-subject exchangeability blocks). The p-value was
calculated as the number of times in which the NMI was lower than the NMI of the experimental data, divided by the number of permutations.
Unless otherwise stated, numerical results are given as mean ± standard deviation.
RESULTS
Behavioral Data
Behavioral data from three subjects could not be recorded for technical problems, leaving a total of 17 subjects for the behavioral analyses. For each subject, performances were evaluated in terms of accuracy, computed as the percentage of valid responses on the number of trials. Performances did not show significant change between the first and the second run of each session (pairedt-test, p> 0.57) and was higher for the lower WM load, as expected (97% one-back, 84% two-back;p< 10−5,
pairedt-test). For complete details, seeTommasin et al. (2018).
Modularity
The permutation test revealed a significant change in the topological configuration between rest and task (p = 0.0017). The optimal modular decomposition resulted in modularity across subjects ofQ = 0.36 ± 0.06 at rest and Q = 0.31 ± 0.09 at task. The degree of segregation was significantly different across conditions (pairedt-test, N = 20, t = 3.9, p = 0.001).
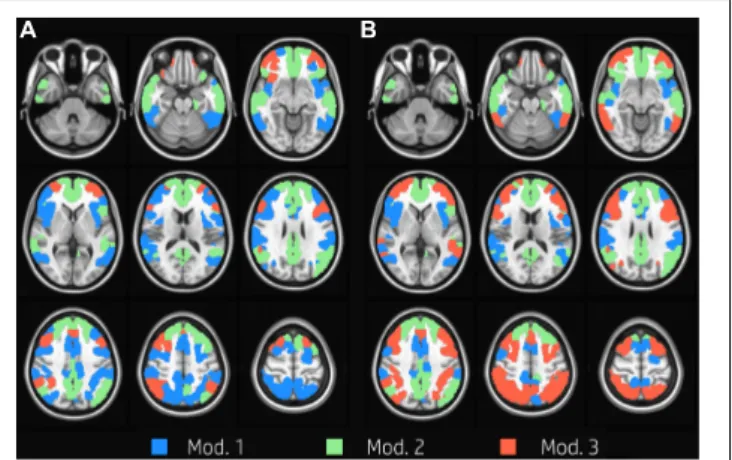
We identified three group-level modules both at task and at rest (Figure 1). The overall network structure showed a reorganization of nodes’ module membership during the execution of the task, resulting in a Jaccard index of 0.71 between the two functional conditions. While module 2, which was mainly composed of nodes of the DMN (Table 1), was clearly preserved between task and rest, the other two modules showed large
FIGURE 1 | Group modularity. Evenly spaced axial slices covering the whole brain for group modular membership at rest (A) and task (B). Nodes are color-coded according to the module membership. Three group-level modules were identified for both task and at rest condition; module 2 was clearly preserved between task and rest, and it is mainly composed of nodes in the DMN, while the other two modules showed large reorganizations between rest and task.
TABLE 1 | Number of nodes and network membership of each module in both functional conditions.
Condition Module Number of nodes Network membership
DAN DMN FPN VAN Rest 1 96 36 4 21 35 2 82 1 77 2 2 3 27 1 6 20 0 Task 1 52 11 6 2 33 2 77 2 69 3 3 3 76 25 12 38 1
reorganizations between rest and task. In particular, the resting condition was characterized by the presence of a large module (module 1, 96 nodes) mainly composed of VAN, DAN, and FPN nodes, and of a substantially smaller module (module 3, 27 nodes), whose nodes laid mainly in FPN. At task, the size of the two modules was more uniform (52 and 76 nodes, respectively). Module 1 was mainly composed of VAN nodes and to a lesser extent of DAN nodes. Module 3 grouped almost all FPN nodes and the majority of DAN nodes. In other words, FPN was equally shared between modules 1 and 3 at rest, and was mainly included in module 3 during the execution of the WM task, while DAN was mainly included in module 1 at rest and was shared between module 1 and 3 at task.
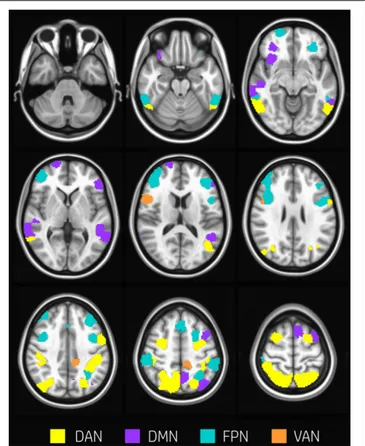
About 29% of nodes (60 nodes) changed modular membership between rest and task. These nodes represent a substantial amount of flexibility in modular composition. Nodes changing their membership were mainly located in the occipital cortex, temporal gyrus, postcentral and precentral gyrus, frontal gyrus, frontal pole, and cingulate gyrus (Figure 2).
Nodes Functional Role
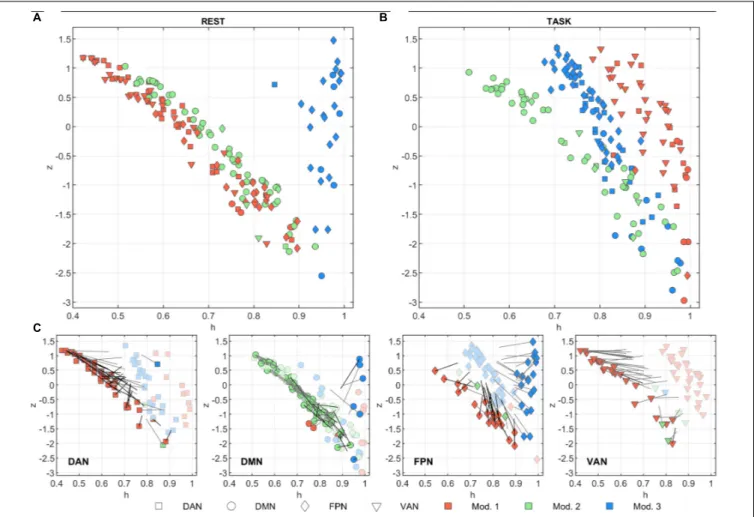
Figures 3A,Bsummarize the functional role of the nodes at rest and task in theh/z plane (diversity coefficient and within-module strength, respectively). The trajectories of each node between task and rest are shown in Figure 3C.
At rest,z showed a strong inverse correlation to h in modules 1 and 2 (Figure 3A,r = –0.98, p< 10−10for both). In module
3, the correlation was not significant but tended to be positive (r = 0.18, p = 0.37). Module 3 was indeed characterized by consistently high values ofh. These nodes mainly belong to FPN and were located in the occipital and frontal cortex. At task, z and h were still inversely correlated both in module 1 and 2 (respectivelyr = –0.59 and r = –0.95, p< 10−10for both). During
task,z and h of nodes belonging to module 3 become inversely correlated as well (r = –0.89, p< 10−10). The correlation changed
significantly from rest to task for modules 1 and 3 (z = –10.8, p< 10−10 and z = 5.6,p< 10−5, respectively, test on Fisher’s
Z transformed correlations). In other words, functional role of nodes in module 2 did not change between conditions, while module 1 and module 3 moved toward each other in planeh/z, going both toward higherz values, while h on average increased in module 1 (from 0.62 ± 0.15 to 0.905 ± 0.066) and decreased in module 3 (from 0.958 ± 0.032 to 0.797 ± 0.070). Taking into
FIGURE 2 | Nodes changing modularity. Evenly spaced axial slices covering the whole brain for nodes changing modular membership between rest and task conditions. Nodes are color-coded according to network membership. About 29% of nodes (60 nodes) changed membership between rest and task. Nodes changing their membership were mainly located in occipital cortex, temporal gyrus, postcentral and precentral gyrus, frontal gyrus, frontal pole, and cingulate gyrus.
account the network composition of each module (see above), this behavior was determined by DAN, FPN, and VAN nodes in module 1, and by FPN and (to lesser extent) DMN in module 3 (see Figure 3, bottom plots).
Behavioral Scores
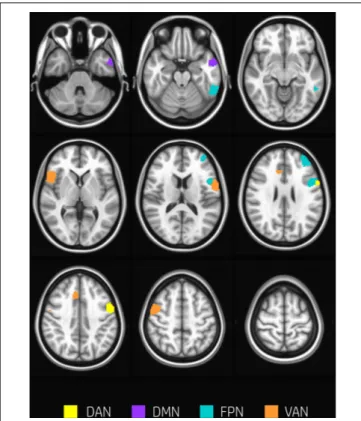
The overall degree of brain segregation, as quantified by Q, correlated inversely with subject accuracy, both at rest and task (r = –0.61 and r = –0.54, respectively. p < 0.05 for both). The change of segregation between rest and task, while significant in itself (see above), was not correlated with the behavioral performances. Significant positive correlations were found betweenhtand subject accuracy (p< 0.05, FDR corrected)
in temporal and frontal areas. These are summarized in Table 2 and shown in Figure 4. These areas included regions of the left inferior and middle temporal gyrus, and regions across the precentral sulcus, including the anterior part of the precentral gyrus, and the posterior part of the middle and inferior frontal gyrus (bilaterally). A more rostral section of the left middle frontal gyrus and a section of the anterior cingulate gyrus were involved as well.
FIGURE 3 | Node functional role in the h/z plane. The within-module strength (z) is plotted as a function of the diversity coefficient (h) for each of the 205 nodes, separately for (A) rest and (B) task conditions. Nodes are color-coded according to module membership and shape-coded according to network membership. The change in module memberships and in the h/z positions can be appreciated in (C) where the h/z plots are shown separately for each network and separately for rest (darker color) and task (lighter color) conditions. Gray lines starting from rest nodes describe the trajectory vector of the node between task and rest. Note, however, that the length of the vector is halved for clarity purposes. Thus, each node position at task can be identified by doubling the length of the trajectory. Nodes that change module memberships between rest and task conditions are marked with darker trajectories.
TABLE 2 | Nodes showing significant correlation between hTand subject accuracy (p< 0.05, FDR corrected).
Node Network Module Label hT
Rest Task r p
36 DAN 1 3 L Precentral Gyrus 0.7573 0.0004
188 VAN 1 1 L Precentral Gyrus (inf fro gy) 0.8199 0.0001
137 FPN 1 3 L Precentral Gyrus 0.7041 0.001
79 DMN 2 2 L Middle Temporal Gyrus 0.7020 0.001
130 FPN 1 3 L Inferior Temporal Gyrus 0.6902 0.002
161 FPN 1 1 L Middle Frontal Gyrus 0.7716 0.0003
For each node, the table reports network, module membership at rest and task, anatomical label, and r and p of correlation.
DISCUSSION
In our previous study, based on the same dataset, we found that the continuous performance of a sustained WM task is associated with large and widespread FC changes (Tommasin et al., 2018). The overall brain topology did not change between
rest and task, but we found some evidence of task-driven dissociation between regions within VAN and modest network reorganization involving nodes within FPN, DAN, and DMN as well. In the present study, we investigated the exact features of these topological changes and the corresponding functional and behavioral correlates.
FIGURE 4 | Nodes correlating with performance. Nodes showing a significant positive correlation between htand subjects accuracy (p< 0.05, FDR
corrected) are found in temporal and frontal areas including regions of the left inferior and middle temporal gyrus, and regions across the precentral sulcus, the anterior part of the precentral gyrus, and the posterior part of the middle and inferior frontal gyrus (bilaterally). A more rostral section of the left middle frontal gyrus and a section of the anterior cingulate gyrus were involved as well. Nodes are color-coded according to network membership.
During rest, DAN, VAN, and part of FPN coexisted in a common module, suggesting intrinsic dynamic collaboration of these networks (Damoiseaux et al., 2006;Fox et al., 2006;He et al., 2009). Modularity analysis showed that cognitive engagement entails a dynamic reorganization of several brain areas belonging to the investigated networks. The degree of brain segregation was significantly different between rest and task conditions, and task-performance was associated with a significant increase of brain global integration. Notably, the Q parameter, related to network segregation, was inversely correlated to subjects’ accuracy in both conditions. This result is consistent with previous studies, using different techniques (Kitzbichler et al., 2011;Wen et al., 2015;Liang et al., 2016;Shine et al., 2016; Hearne et al., 2017;
Zuo et al., 2018), and confirms that a brain topology suitable for integration of information is a prerequisite for the correct performance of a WM task.
Several previous works reported that task-driven (Braun et al., 2015;Hearne et al., 2017;Zuo et al., 2018) or dynamic (Shine et al., 2016; Fransson et al., 2018) reconfiguration of brain modular structure during task is driven by the flexibility of areas within FPN, DMN, DAN, and VAN. In our modular analysis, we found a high level of reorganization for nodes belonging
to the TPNs, in particular for regions in frontal and temporal cortices (Figure 2). The only module overall unaffected by the task-performance was module 2, that included most of the DMN. Module 1 included virtually the whole VAN (at least 89% of nodes), both at rest and at task, while participation of DAN and FPN nodes to this module changed between conditions. Specifically, at rest module 1 included all DAN and half of FPN nodes, at task it lost its FPN coverage and around 2/3 of the DAN nodes. On the other hand, FPN nodes converged to a single module, suggesting that the task is associated with a consolidation of FPN function.
This interpretation is corroborated by the analysis of changes in the h and z parameters. Indeed, nodes in DAN, VAN, and DMN changed their functional role rather uniformly, in agreement with the overall behavior of the pertaining modules. However, the split modularity of FPN at rest was mirrored by opposite changes inh, with nodes of modules 1 and 3 converging to a common module characterized by intermediate h values (Figure 3, bottom). These changes, taken together, indicate a task-dependent segregation of the functions carried out by the DAN and FPN nodes versus activities relying on VAN nodes. Considering the overall increase of integration during task, this effect indicates a tighter integration between areas belonging to DAN and FPN networks.
Our results show a clear task-driven dissociation between DAN and VAN: almost all the nodes within these networks were in the same module at rest, while during task 2/3 of DAN nodes transitioned to a third module that also included the FPN nodes. Indeed, albeit both structural (Umarova et al., 2009) and rsfMRI (Fox et al., 2006; He et al., 2007) studies have shown that DAN and VAN were plainly discernible, it has been repeatedly suggested that the attention control requires flexible and continuous collaboration between these networks (Fox et al., 2006;He et al., 2007; Macaluso, 2010; Chica et al., 2011; Vossel et al., 2014). The dissociation that we observed here could reflect the switching between reflexive (bottom up) and voluntary (top-down) attention during the task. Accordingly, many studies suggested that DAN and VAN have opposite pattern of activity during the execution of a WM task (Corbetta et al., 2000;Shulman et al., 2009;Asplund et al., 2010).
While the main topological reorganization associated with task-execution concerned the segregation of VAN modules from FPN and 2/3 of the DAN nodes, the inter-modular integration at task was found to be crucial for accurate performance. It is worth noting that eight of nine of the nodes wherehTcorrelated with
behavior belong to either module 1 or 3, including three nodes that changed module during task (from 1 to 3).
This result confirms that the performance during WM was related to the capability of preserving intramodular integration in spite of modular reorganization.
The fact that no node had z (i.e., within-network hub properties) correlated to performance may indicate that integration between-modules is more crucial than within-network connections in the current WM task. From a within-network perspective, the execution of the WM task requires integration between DAN and FPN, but the performance was boosted by further integration with VAN.
Indeed, one of the key components of WM processing is the capacity of actively maintaining information no longer available and to manipulate this information for usage over short delays (Moser et al., 2018). This requires the integration of neuronal circuits on large scale, including regions in dorsolateral prefrontal cortex, parietal cortex, and dorsal anterior cingulate cortex (Liang et al., 2016). All of these regions are represented in the nodes characterized by correlation betweenhTand performances
(Table 2 and Figure 4).
CONCLUSION
In conclusion, we have shown that the execution of an auditory WM task is associated with a switching between different topological configurations of FPN, VAN, and DAN nodes, involving a segregation of VAN nodes in the presence of increased overall integration. The correct execution of the task requires integration between components belonging to all the involved networks.
DATA AVAILABILITY STATEMENT
The datasets of this article are not publicly available because the authors lack the ethical consent to do that. Requests to access the datasets should be directed to the corresponding author.
ETHICS STATEMENT
The protocol of the study was approved by the Ethics Committee of Santa Lucia Foundation. All subjects gave written informed consent in accordance with the Declaration of Helsinki and with the European Union regulations.
AUTHOR CONTRIBUTIONS
MM acquired and processed the data prepared the figures and wrote the manuscript. DM acquired and processed the data and prepared the figures. ST acquired and processed the data. TG designed the study and programmed the stimulation. IH and MF performed the experiment. MD, RW, SM, and EM discussed the results and the manuscript and helped in the interpretation of the results. FG designed the study, interpreted the results, and coordinated the research. All authors edited the text and approved the final version.
FUNDING
This work was partially supported by the Italian Ministry of Health, with the Young Researcher Grant 2013 (GR-2013-02358177, to MF) and with Ricerca Corrente (MM, DM, TG, and FG).
REFERENCES
Alexander-Bloch, A., Lambiotte, R., Roberts, B., Giedd, J., Gogtay, N., and Bullmore, E. (2012). The discovery of population differences in network community structure: new methods and applications to brain functional
networks in schizophrenia. Neuroimage 59, 3889–3900. doi: 10.1016/j.
neuroimage.2011.11.035
Asplund, C. L., Todd, J. J., Snyder, A. P., and Marois, R. (2010). A central role for the lateral prefrontal cortex in goal-directed and stimulus-driven attention.Nat. Neurosci. 13, 507–512. doi: 10.1038/nn.2509
Behzadi, Y., Restom, K., Liau, J., and Liu, T. T. (2007). A component based noise correction method (CompCor) for BOLD and perfusion based fMRI. Neuroimage 37, 90–101. doi: 10.1016/j.neuroimage.2007.04.042
Benjamini, Y., and Hochberg, Y. (1995). Controlling the false discovery rate: a practical and powerful approach to multiple testing journal of the royal statistical society.Series B 57, 289–300. doi: 10.1111/j.2517-6161.1995.tb02 031.x
Blondel, V. D., Guillaume, J.-L., Lambiotte, R., and Lefebvre, E. (2008). Fast
unfolding of communities in large networks. J. Stat. Mech. Theory E
2008:10008.
Bluhm, R. L., Clark, C. R., McFarlane, A. C., Moores, K. A., Shaw, M. E., and Lanius, R. A. (2011). Default network connectivity during a
working memory task.Hum. Brain Mapp. 32, 1029–1035. doi: 10.1002/hbm.
21090
Bordier, C., Nicolini, C., Forcellini, G., and Bifone, A. (2018). Disrupted modular organization of primary sensory brain areas in schizophrenia.Neuroimage Clin. 18, 682–693. doi: 10.1016/j.nicl.2018.02.035
Braun, U., Schafer, A., Walter, H., Erk, S., Romanczuk-Seiferth, N., Haddad, L., et al. (2015). Dynamic reconfiguration of frontal brain networks during executive cognition in humans.Proc. Natl. Acad. Sci. U.S.A. 112, 11678–11683. doi: 10. 1073/pnas.1422487112
Bray, S., Arnold, A. E. G. F., Levy, R. M., and Iaria, G. (2015). Spatial and temporal functional connectivity changes between resting and attentive states.Hum. Brain Mapp. 36, 549–565. doi: 10.1002/hbm.22646
Brueggen, K., Kasper, E., Dyrba, M., Bruno, D., Pomara, N., Ewers, M., et al. (2016). The primacy effect in amnestic mild cognitive impairment: associations with hippocampal functional connectivity.Front. Aging Neurosci. 8:244. doi: 10.3389/fnagi.2016.00244
Buckner, R. L., Andrews-Hanna, J. R., and Schacter, D. L. (2008). The brain’s default network.Ann. N. Y. Acad. Sci. 1124, 1–38. doi: 10.1196/annals.1440.011 Bullmore, E. T., and Sporns, O. (2009). Complex brain networks: graph theoretical
analysis of structural and functional systems.Nat. Rev. Neurosci. 10, 186–198. doi: 10.1038/nrn2575
Chica, A. B., Bartolomeo, P., and Valero-Cabre, A. (2011). Dorsal and ventral parietal contributions to spatial orienting in the human brain.J. Neurosci. 31, 8143–8149. doi: 10.1523/jneurosci.5463-10.2010
Corbetta, M., Kincade, J. M., Ollinger, J. M., Mcavoy, M. P., and Shulman, G. L. (2000). Voluntary orienting is dissociated from target detection in
human posterior parietal cortex.Nat. Neurosci. 3, 292–297. doi: 10.1038/
73009
Corbetta, M., Patel, G., and Shulman, G. L. (2008). The reorienting system of
the human brain: from environment to theory of mind.Neuron 58, 306–324.
doi: 10.1016/j.neuron.2008.04.017
Corbetta, M., and Shulman, G. L. (2002). Control of goal-directed and stimulus-driven attention in the brain.Nat. Rev. Neurosci. 3, 201–215. doi: 10.1038/ nrn755
Cox, R. W. (1996). AFNI: software for analysis and visualization of functional
magnetic resonance neuroimages.Comput. Biomed. Res. 29, 162–173. doi:
10.1006/cbmr.1996.0014
Craddock, R. C., James, G. A., Holtzheimer, P. E., Hu, X. P. P., and Mayberg, H. S. (2012). A whole brain fMRI atlas generated via spatially constrained spectral clustering.Hum. Brain Mapp. 33, 1914–1928. doi: 10.1002/hbm.21333 Crossley, N. A., Mechelli, A., Vertes, P. E., Winton-Brown, T. T., Patel, A. X.,
Ginestet, C. E., et al. (2013). Cognitive relevance of the community structure of the human brain functional coactivation network.Proc. Natl. Acad. Sci. U.S.A. 110, 11583–11588. doi: 10.1073/pnas.1220826110
Damoiseaux, J. S., Rombouts, S. A., Barkhof, F., Scheltens, P., Stam, C. J., Smith, S. M., et al. (2006). Consistent resting-state networks across healthy subjects.
Proc. Natl. Acad. Sci. U.S.A. 103, 13848–13853. doi: 10.1073/pnas.060141 7103
Fornito, A., Harrison, B. J., Zalesky, A., and Simons, J. S. (2012). Competitive and cooperative dynamics of large-scale brain functional networks supporting recollection.Proc. Natl. Acad. Sci. U.S.A. 109, 12788–12793. doi: 10.1073/pnas. 1204185109
Fox, M. D., Corbetta, M., Snyder, A. Z., Vincent, J. L., Raichle, M. E. (2006). Spontaneous neuronal activity distinguishes human dorsal and ventral attention systems.PNAS 103, 10046–10051. doi: 10.1073/pnas.0604187103 Fox, M. D., Snyder, A. Z., Vincent, J. L., Corbetta, M., Van Essen, D. C., and
Raichle, M. E. (2005). The human brain is intrinsically organized into dynamic, anticorrelated functional networks.Proc. Natl. Acad. Sci. U.S.A. 102, 9673–9678. doi: 10.1073/pnas.0504136102
Fransson, P. (2006). How default is the default mode of brain function? Further evidence from intrinsic BOLD signal fluctuations.Neuropsychologia 44, 2836– 2846.
Fransson, P., Schiffler, B. C., and Thompson, W. H. (2018). Brain network segregation and integration during an epoch-related working memory fMRI experiment.Neuroimage 178, 147–161. doi: 10.1016/j.neuroimage.2018.05.040 Friston, K. J. (1994). Functional and effective connectivity in neuroimaging: a
synthesis.Hum. Brain Mapp. 2, 56–78. doi: 10.1002/hbm.460020107 Golland, Y., Golland, P., Bentin, S., and Malach, R. (2008). Data-driven clustering
reveals a fundamental subdivision of the human cortex into two global systems. Neuropsychologia 46, 540–553. doi: 10.1016/j.neuropsychologia.2007.10.003 Gordon, E. M., Breeden, A. L., Bean, S. E., and Vaidya, C. J. (2014). Working
memory–related changes in functional connectivity persist beyond task
disengagement.Hum. Brain Mapp. 35, 1004–1017. doi: 10.1002/hbm.22230
Greicius, M. D., and Menon, V. (2004). Default-mode activity during a passive sensory task: uncoupled from deactivation but impacting activation.J. Cogn. Neurosci. 16, 1484–1492. doi: 10.1162/0898929042568532
Greicius, M. D., Srivastava, G., Reiss, A. L., and Menon, V. (2004). Default-mode network activity distinguishes Alzheimer’s disease from healthy aging: evidence from functional MRI.Proc. Natl. Acad. Sci. U.S.A. 101, 4637–4642. doi: 10.1073/pnas.0308627101
Guimera, R., and Amaral, L. A. N. (2005). Functional cartography of complex metabolic networks.Nature 433, 895–900. doi: 10.1038/nature03288 Hampson, M., Driesen, N. R., Skudlarski, P., Gore, J. C., and Constable, R. T.
(2006). Brain connectivity related to working memory performance.J. Neurosci. 26, 13338–13343. doi: 10.1523/jneurosci.3408-06.2006
Hampson, M., Peterson, B. S., Skudlarski, P., Gatenby, J. C., and Gore, J. C. (2002). Detection of functional connectivity using temporal correlations in MR images. Hum. Brain Mapp. 15, 247–262. doi: 10.1002/hbm.10022
Harrison, B. J., Pujol, J., Lopez-Sola, M., Hernandez-Ribas, R., Deus, J., Ortiz, H., et al. (2008). Consistency and functional specialization in the default mode brain network.Proc. Natl. Acad. Sci. U.S.A. 105, 9781–9786. doi: 10.1073/pnas. 0711791105
He, B. J., Snyder, A. Z., Vincent, J. L., Epstein, A., Shulman, G. L., and Corbetta, M. (2007). Breakdown of functional connectivity in frontoparietal networks underlies behavioral deficits in spatial neglect.Neuron 53, 905–918. doi: 10. 1016/j.neuron.2007.02.013
He, Y., Wang, J., Wang, L., Chen, Z. J., Yan, C., Yang, H., et al. (2009). Uncovering intrinsic modular organization of spontaneous brain activity in humans.PLoS One 4:e5226. doi: 10.1371/journal.pone.0005226
Hearne, L. J., Cocchi, L., Zalesky, A., and Mattingley, J. B. (2017). Reconfiguration of brain network architectures between resting-state and complexity-dependent
cognitive reasoning.J. Neurosci. 37, 8399–8411. doi: 10.1523/JNEUROSCI.
0485-17.2017
Horwitz, B. (2003). The elusive concept of brain connectivity.Neuroimage 19, 466–470. doi: 10.1016/s1053-8119(03)00112-5
Jo, H. J., Gotts, S. J., Reynolds, R. C., Bandettini, P. A., Martin, A., Cox, R. W., et al. (2013). Effective preprocessing procedures virtually eliminate distance-dependent motion artifacts in resting state FMRI.J. Appl. Math. 2013:935154. doi: 10.1155/2013/935154
Kelly, A. M. C., Uddin, L. Q., Biswal, B. B., Castellanos, F. X., and Milham, M. P. (2008). Competition between functional brain networks mediates behavioral variability.Neuroimage 39, 527–537. doi: 10.1016/j.neuroimage.2007.08.008 Kitzbichler, M. G., Henson, R. N., Smith, M. L., Nathan, P. J., and Bullmore,
E. T. (2011). Cognitive effort drives workspace configuration of human brain
functional networks.J. Neurosci. 31, 8259–8270. doi: 10.1523/JNEUROSCI.
0440-11.2011
Kuncheva, L. I., and Hadjitodorov, S. T. (2004). “Using diversity in cluster
ensembles,” in Proceedings of the 2004 IEEE International Conference on
Systems, Man and Cybernetics (IEEE Cat. No. 04CH37583), (Piscataway, NJ: IEEE), 1214–1219.
Lebedev, A. V., Nilsson, J., and Lövdén, M. (2018). Working memory and reasoning benefit from different modes of large-scale brain dynamics in healthy older adults.J. Cogn. Neurosci. 30, 1033–1046. doi: 10.1162/jocn_a_01260
Leech, R., Kamourieh, S., Beckmann, C. F., and Sharp, D. J. (2011). Fractionating the default mode network: distinct contributions of the ventral and dorsal posterior cingulate cortex to cognitive control.J. Neurosci. 31, 3217–3224. doi: 10.1523/JNEUROSCI.5626-10.2011
Lerman-Sinkoff, D. B., and Barch, D. M. (2016). Network community structure alterations in adult schizophrenia: identification and localization of alterations. Neuroimage Clin. 10, 96–106. doi: 10.1016/j.nicl.2015.11.011
Liang, X., Zou, Q. H., He, Y., and Yang, Y. H. (2016). Topologically reorganized connectivity architecture of default-mode, executive-control, and salience
networks across working memory task loads.Cereb. Cortex 26, 1501–1511.
doi: 10.1093/cercor/bhu316
Lowe, M. J., Dzemidzic, M., Lurito, J. T., Mathews, V. P., and Phillips, M. D. (2000). Correlations in low-frequency BOLD fluctuations reflect cortico-cortical connections.Neuroimage 12, 582–587. doi: 10.1006/nimg.2000.0654 Macaluso, E. (2010). Orienting of spatial attention and the interplay between the
senses.Cortex 46, 282–297. doi: 10.1016/j.cortex.2009.05.010
Mascali, D., Dinuzzo, M., Gili, T., Moraschi, M., Fratini, M., Maraviglia, B., et al. (2015). Intrinsic patterns of coupling between correlation and amplitude of low-frequency fMRI fluctuations are disrupted in degenerative dementia mainly due to functional disconnection.PLoS One 10:e0120988. doi: 10.1371/journal.pone. 0120988
Moser, D. A., Doucet, G. E., Ing, A., Dima, D., Schumann, G., Bilder, R. M., et al. (2018). An integrated brain-behavior model for working memory.Mol. Psychiatry 23, 1974–1980. doi: 10.1038/mp.2017.247
Newton, A. T., Morgan, V. L., and Gore, J. C. (2007). Task demand modulation of steady-state functional connectivity to primary motor cortex.Hum. Brain Mapp. 28, 663–672. doi: 10.1002/hbm.20294
Piccoli, T., Valente, G., Linden, D. E. J., Re, M., Esposito, F., Sack, A. T., et al. (2015). The default mode network and the working memory network are not anti-correlated during all phases of a working memory task.PLoS One 10:e0123354. doi: 10.1371/journal.pone.0123354
Rogers, B. P., Morgan, V. L., Newton, A. T., and Gore, J. C. (2007). Assessing functional connectivity in the human brain by fMRI.Magn. Reson. Imaging 25, 1347–1357. doi: 10.1016/j.mri.2007.03.007
Rubinov, M., and Sporns, O. (2011). Weight-conserving characterization of complex functional brain networks.Neuroimage 56, 2068–2079. doi: 10.1016/ j.neuroimage.2011.03.069
Sala-Llonch, R., Junque, C., Arenaza-Urquijo, E. M., Vidal-Pineiro, D., Valls-Pedret, C., Palacios, E. M., et al. (2014). Changes in whole-brain functional
networks and memory performance in aging.Neurobiol. Aging 35, 2193–2202.
doi: 10.1016/j.neurobiolaging.2014.04.007
Shannon, C. E. (1948). A mathematical theory of communication.Bell Syst. Tech. J. 27, 623–656.
Shine, J. M., Bissett, P. G., Bell, P. T., Koyejo, O., Balsters, J. H., Gorgolewski, K. J., et al. (2016). The dynamics of functional brain networks: integrated network states during cognitive task performance.Neuron 92, 544–554. doi: 10.1016/j. neuron.2016.09.018
Shulman, G. L., Astafiev, S. V., Franke, D., Pope, D. L., Snyder, A. Z., Mcavoy, M. P., et al. (2009). Interaction of stimulus-driven reorienting and expectation in ventral and dorsal frontoparietal and basal ganglia-cortical networks. J. Neurosci. 29, 4392–4407. doi: 10.1523/JNEUROSCI.5609-08.2009
Spreng, R. N., Stevens, W. D., Chamberlain, J. P., Gilmore, A. W., and Schacter, D. L. (2010). Default network activity, coupled with the frontoparietal control network, supports goal-directed cognition.Neuroimage 53, 303–317. doi: 10. 1016/j.neuroimage.2010.06.016
Tommasin, S., Mascali, D., Moraschi, M., Gili, T., Hassan, I. E., Fratini, M., et al. (2018). Scale-invariant rearrangement of resting state networks in the human brain under sustained stimulation.Neuroimage 179, 570–581. doi: 10.1016/j. neuroimage.2018.06.006
Umarova, R. M., Saur, D., Schnell, S., Kaller, C. P., Vry, M. S., and Glauche, V. (2009). Structural connectivity for visuospatial attention: significance of ventral pathways.Cereb. Cortex 20, 121–129. doi: 10.1093/cercor/bhp086
van den Heuvel, M. P., and Hulshoff Pol, H. E. (2010). Exploring the brain network: a review on resting-state fMRI functional connectivity.Eur. Neuropsychopharmacol. 20, 519–534. doi: 10.1016/j.euroneuro.2010.03.008 Vatansever, D., Menon, D. K., Manktelow, A. E., Sahakian, B. J., and Stamatakis,
E. A. (2015). Default mode network connectivity during task execution. Neuroimage 122, 96–104. doi: 10.1016/j.neuroimage.2015.07.053
Vossel, S., Geng, J. J., and Fink, G. R. (2014). Dorsal and ventral attention systems: distinct neural circuits but collaborative roles.Neuroscientist 20, 150–159. doi: 10.1177/1073858413494269
Wen, X., Zhang, D., Liang, B., Zhang, R., Wang, Z., Wang, J., et al. (2015). Reconfiguration of the brain functional network associated with visual task demands.PLoS One 10:e0132518. doi: 10.1371/journal.pone.0132518 Whitfield-Gabrieli, S., and Nieto-Castanon, A. (2012). Conn: a functional
connectivity toolbox for correlated and anticorrelated brain networks.Brain Connect. 2, 125–141. doi: 10.1089/brain.2012.0073
Yeo, B. T., Krienen, F. M., Sepulcre, J., Sabuncu, M. R., Lashkari, D., Hollinshead, M., et al. (2011). The organization of the human cerebral cortex estimated by
intrinsic functional connectivity.J. Neurophysiol. 106, 1125–1165. doi: 10.1152/ jn.00338.2011
Zhao, Z., Jie, L., Jia, X., Chao, W., Han, Y., and Jia, J. (2014). Selective changes of resting-state brain oscillations in aMCI: an fMRI study using ALFF.Biomed. Res. Int. 2014:920902. doi: 10.1155/2014/920902
Zuo, N. M., Yang, Z. Y., Liu, Y., Li, J., and Jiang, T. Z. (2018). Both activated and less-activated regions identified by functional MRI reconfigure to support task executions.Brain Behav. 8:e00893. doi: 10.1002/brb3.893
Conflict of Interest:The authors declare that the research was conducted in the
absence of any commercial or financial relationships that could be construed as a potential conflict of interest.
Copyright © 2020 Moraschi, Mascali, Tommasin, Gili, Hassan, Fratini, DiNuzzo, Wise, Mangia, Macaluso and Giove. This is an open-access article distributed under the terms of the Creative Commons Attribution License (CC BY). The use, distribution or reproduction in other forums is permitted, provided the original author(s) and the copyright owner(s) are credited and that the original publication in this journal is cited, in accordance with accepted academic practice. No use, distribution or reproduction is permitted which does not comply with these terms.