techniques in quantitative proteomics using
MALDI and ESI mass spectrometry
By
Petros Moschidis
Supervisor:
Prof. Giovanni Sindona
Co-Supervisor:
Dr. Constantinos Athanassopoulos
Submitted in the partial fulfilment of the requirements of the Degree of Doctor of Philosophy
(PhD) in
Methodologies for the development of molecules of pharmacological interest XXI cycle (CHIM06)
Synthesis and application of new solid phase techniques in quantitative proteomics using MALDI and ESI mass spectrometry
(PhD) Thesis Department of Chemistry
University of Calabria Italy
I hereby declare that the thesis that follows is my own composition, that it is a record of the work done by myself, and that it has not been presented in any previous application for a higher degree.
I would therefore like to thank my supervisors Prof. Giovanni Sindona, Prof. Anna Napoli and Dr. Constantinos Athanassopoulos, whose unwavering support and enthusiasm were fundamental to my own enjoyment of the research, and whose near limitless knowledge of their own fields meant that the training I received on this project was unique.
I would like to thank the entire staff of the Mass Spectrometry lab of Unical which has contributed in no small measure both to the work presented in this thesis as well to the pleasant and vibrant atmosphere in the lab. In particular, Dr. Donatella Aiello for her valuable advices during all this 3 years that made me more precise while working in the “invisible” microscale of Proteomics (do not shake unknown vials!). The “swimming pool boys” Raf and Fabio for their lessons of Italian language, Art and Culture. I would also like to thank Prof. Leonardo, Domenico, Barbara, Naim and the very enthusiastic and capable graduate students Alessandra and Elvira.
An important part of my work has been made in the lab of Organic Synthesis of Unical. I would therefore like to thank my friends Amedeo and Bea for their illimitable help in Science and in the real life. I must not forget Marianna, Garofalo, Attilio, Monica, Francesca, Elvira and Prof Tagarelli. A special thank to Maurizio for the advanced Italian language course (Panti, Pasquale, etc).
For my stay as a visiting PhD student in Patras (where I have completed my undergraduate studies in 2005) under the supervising of Dr Costantinos Athanassopoulos, I have to thank Prof Dionissios Papaioanou for the hospitality in his laboratory. I would also like to thank the people of this lab: Giorgos, Stavros, Thomas, Katia, Mitsos and Antonis.
A PhD is not only Science but a life-experience. Thus I may acknowledge the friends in blocco 3 (dirty house): Attya, Ashif, Hisham, Cappo (Habib), Jose’, Butaflica and all the other persons that came and left. Sure I have to refer to my good Egyptian friend Mohammed Youssry Ali (…) and remember all the “rainy days” as well as the joyful moments we passed together in bankina this 3 year in Arcavacata di Rende.
I big thank to Mrs Sofia for her unique artistic touch on the cover layout of this thesis.
Finally, I owe all of my accomplishments to my parents. My father and mother, they sacrificed much to provide me with the quality of life from which I could choose what I want to be and to do.
Abbreviations i
Abstract iii
Chapter 1. Proteomics
11.1 Proteomic Analysis Techniques 2
1.1.1 Protein Separation 3
1.1.2 Protein identification 4
1.2 Mass spectrometry 5
1.2.1 Sample introduction 6
1.2.2 Methods of sample ionisation 7
1.2.3 Analysis and separation of sample ions 7
1.2.4 Detection and recording of sample ions 7
1.3 Electrospray 8
1.3.1 Electrospray ionisation 8
1.4 Nanospray ionisation 9
1.5 Matrix assisted laser desorption ionisation (MALDI) 10
1.6 Positive or negative ionisation? 13
1.7 Tandem mass spectrometry (MS-MS) 14
1.7.1 Tandem mass spectrometry 14
1.7.2 Product or daughter ion scanning 14
1.7.3 Precursor or parent ion scanning 15
1.7.4 Constant neutral loss scanning. 15
1.7.5 Selected/multiple reaction monitoring 15
1.8 Peptide Sequencing by Tandem Mass Spectrometry 16
1.8.1 Peptide sequencing: H2N-CH(R')-CO-NH-CH(R")-CO2H 16
1.8.2 Immonium ions 17
1.8.3 Protein identification common procedure 17
1.8.4 Peptide sequencing in summary 19
2.2 Quantitation without stable isotope tags 26
2.3 Stable Isotope Labelling 27
2.3.1 O18 Labelling 29
2.3.2 Stable Isotope Labelling with Amino Acids in Cell Culture (SILAC) 30
2.4 Solid-Phase Chemical tools for proteomics 32
2.4.1 Solid Phase Synthesis 32
2.4.2 Solid phase support (resin) 33
2.4.3 TentaGel resins 35
2.5 Quantitative proteome analysis by solid-phase isotope tagging and MS 36
Chapter 3.
Results and discussion
413.1 Mass spectrometry equipment 43
3.2 Dansyl Solid Phase Tag 44
3.2.1 Synthesis of d6-Dansyl Chloride 44
3.2.2 Development of Dansyl containing resins 49
3.2.3 Reactivity test of Dansyl –OSu Tags 50
3.2.4 Reactivity test of Dansyl –Iodo Tags 53
3.3 Cysteine-Cysteine Isobaric Solid Phase Tag 57
3.3.1 Development of Cys-Cys Isobaric resins 57
3.3.2 Reactivity test of Cys-Cys Isobaric Tags 58
3.4 Glycine-Alanine Isobaric Isotopic Label-Free Solid Phase Tag 63 3.4.1 Development of Glycine-Alanine Isobaric Isotopic Label-Free resins 63 3.4.2 Reactivity test of Glycine-Alanine Isobaric Isotopic Label-Free resins 64
Chapter 4.
Experimental part
75Chapter 5.
References
892D-PAGE Two -di mensio nal pol yacr yl amid e gel electrop ho resis AA Amino aci d
ACN Acetonit ril e
BSA Bo vin e S erum Alb umin
CID Collisio n-ind uced di sso cat ion
CHCA Alph a-c yano -4 -h yd rox ycinnami c acid C-terminal Carbox y t ermin al
DCC N,N'-di c ycloh ex yl carbodiimide DCM Dichlo rom ethane
DIC N,N'-diis oprop yl carb odiimide DI PE A N,N-Diisoprop yl et h ylamine DMF Dim eth yl Fo rm amide
DNA Deox y-Ribonucl ei c Aci d
DNS 5-di met h yl amino-1- nap hthal enesu lfoni c acid Dansy l 5-di met h yl amino-1- nap hthal enesu lfoni c acid ESI Elect ros pra y io nis ati on
FA Fo rmi c Acid
FAB Fast Ato m Bom bard ment
Fmo c 9H-fl uo ren-9- yl m eth ox ycarb on yl
HBTU OBenzot ri azol eN, N,N’,N’t etram eth yl u roni um hex afl uo ro -phos ph at e
H PLC Hi gh Perfo rman ce Li quid Chrom ato graphy ICAT Is ot op e coded affini t y t ag
iTRAQ Is ot op e Tagging for Rel ativ e an d Abso lut e Qu antit ati on IE F Is o el ectri c fo cu sin g
i-PrOH Is o prop anol
LC Li qui d ch rom ato graph y m/z Mass -t o-ch arge ratio
MAL DI Mat rix -Assist ed Las er Des orption and Ionisation MS Mass Sp ectrometr y
MS/ MS Tand em MS Mtt Meth yl t rit yl N-terminal Amino t erm in al
NHS N-H yd rox ysu ccinimi de
NMR Nu clear m agnetic res onance PCR Pol ym eras e chai n reaction PE G Pol yeth yl ene gl ycol
pI Is o el ectri c poi nt RAM Rin g Amid e Lin ker RNA Ribon ucl ei c Acid
RP Rev erse-phase
SILAC Stabl e Is otop e Lab el lin g b y Amin o Aci ds in C ell Cultu re SDS Sodium do dec yl su lphat e
SPSS Solid Ph as e Peptid e S yn thesis TCE P Tris (2-carb ox yet h yl )phos phine TFA Tri -fluo ro acet ate
TFMS A Tri flu oromethanesul foni c aci d TIC Tot al Ion Chrom atogram TO F Time-Of-Fli ght
Proteomics, the analysis of the protein complement of a cell or an organism has grown rapidly as a category of the life sciences. Mass spectrometry (MS) is one of the central detection techniques in proteome analysis, yet it has to rely on prior sample preparation steps that reduce the enormous complexity of the protein mixtures obtained from biological systems. For that reason, a number of tagging (or labeling) strategies have been developed that target specific amino acid residues or post-translational modifications, enabling the enrichment of subfractions via affinity clean up, resulting in the identification of an ever-increasing number of proteins. In addition, the attachment of stable isotope-labeled tags now allow the relative quantitation of protein levels of two samples, e.g. those representing different cell states, which is of great significance for drug discovery and molecular biology.
This work presents the research for new stable isotope-labeled (as well as stable-isotope free) solid phase strategies for the identification and relative quantitation of complex protein mixtures using MALDI and ESI-MS, MS/MS technology.
1
1
P
1. Proteomics
Proteomics is the large-scale study of all expressed proteins. Proteins are vital parts of living organisms, as they are the main components of the physiological metabolic pathways of cells. The term "proteomics" was coined to make an analogy with genomics, the study of the genes. The word proteome is a combination of protein (from the Greek word πρώτα ("prota"), meaning "of primary importance") and genome. The proteome is the entire complement of proteins, including all the proteins in the cell, all protein isoforms and their post-translational modifications. Proteomics is often considered the next step in the study of biological systems, after genomics. It is much more complicated than genomics, mostly because while an organism's genome is constant - with exceptions such as the addition of genetic material caused by a virus, or the rapid mutations, transpositions, and expansions that can occur in a tumor - the proteome differs from cell to cell. This is because proteome is changing through its biochemical interactions with the genome and the environment. One organism has different protein expression in different parts of its body, in different stages of its life cycle and in different environmental conditions.
The study of the proteome presents us with several technical challenges: the complexity and heterogeneity of the proteome, the instability of individual proteins, and the difficulty of performing quantitative analyses. The template for the proteome, the genome, contains a vast number of protein coding sequences. The human genome, for example contains approximately 30,000 genes, most of which will be translated to protein. Complexity is increased at the transcript level by splice variants. Additionally, once translated from mRNA, proteins are commonly post-translationally modified by factors such as acetylation1, methylation2, glycosylation3, phosphorylation4, truncation events5 and sulphation6, vastly increasing the complexity of the array of proteins expressed even in a single cellular state.
Proteins perform thousands of different tasks, such as structural maintenance, molecular trafficking and transcriptional regulation, required to maintain a functioning cell, and are required to be heterogeneous in structure and physiochemical properties. This provides many difficulties for researchers. Not all proteins will remain soluble
under the same conditions, remain stable and intact under the same conditions, or be effectively analyzed by the same instrumentation. Data derived from proteomic analyses can be enhanced by direct comparison of multiple phenotypes. For this reason, comparative quantitation7 is an important aspect of proteomics. Obtaining abundance data from a heterogeneous, extremely complex mixture is not trivial, and several methods have been employed with variable success.
Despite this, proteomics has developed into a highly successful area of research, which provides the unique ability to identify and quantify hundreds or thousands of proteins simultaneously. Indeed, proteomic studies have provided invaluable insight into many important areas of molecular biology, for example the functionality of the centrosome8, flagellar motility in bloodstream trypanosomes9 and protein degradation using the ubiquitin ligase assembly10.
1.1 Proteomic Analysis Techniques
Attempts to overcome the challenges of heterogeneity, instability and dynamic range of proteins lead to the two main requirements of any technique that approaches a ‘proteomic’analysis (Scheme 1) technique: the ability to reduce sample complexity to manageable levels, and the ability to identify proteins once they are separated. The most popular methods for separating proteins are gels and chromatography columns, and in both cases, the principle of their action is to split a complex mixture of proteins into multiple lower complexity fractions. The most effective tool for protein identification has become the mass spectrometer. In simple terms, a mass spectrometer is a device for detecting the number of ions present with a particular mass. In essence, mass spectrometers separate or filter ions by mass.
Scheme 1. Proteomics workflow
1.1.1 Protein Separation
Various approaches are possible for protein separation including 1-D SDS-PAGE. However, for quantitative and comparative proteomic analysis, there is still no widely available technology that surpasses 2-D gel electrophoresis (2-DE), which has been the method of choice for separation of complex protein mixtures for several decades11. In the 2-D-PAGE the protein mixtures resolved first in one dimension isoelectrofocusing (IEF),that separates proteins on the basis of isoelectric point (pI). These proteins are then resolved on a second dimension SDS- PAGE, which separate according to molecular weight. The proteins, that run on the gel, that have been separated during electrophoresis, can be visualized using different staining techniques, most common are Coomassie Brilliant Blue staining is relatively easy, cost-effective and compatible with subsequent protein identification by mass spectrometry (MS), but it is only moderately sensitive, with a limit of approximately 10 ng protein. The other alternative has been silver-staining, which is more sensitive, detecting as little as 0.5 ng protein12 but not particularly quantitative and less suitable for MS13.
Moreover the availability of improved stationary-phase materials and hardware has greatly improved the performance of LC systems for protein purification. Although HPLC of intact proteins has not become a widely used technique for analytical proteomics, it is nevertheless highly applicable as an initial step to fractionate protein mixtures. Diverse chromatographic separations are available, including RP, anion and cation exchange, size exclusion, and affinity chromatography.The latter is particularly attractive as a means of pulling a subset of proteins from a complex mixture.
1.1.2 Protein identification
The mass spectrometry is widely used and is the method of choice for both protein identification and characterization. The first step toward protein identification is typically excision of 1-D or 2-D gel containing the protein bands or spots of interest, in-gel digestion with a site-specific protease (commonly trypsin), and finally MS analysis of the resultant eluted peptides (Figure 1). Two MS platforms in particular represent powerful tools for proteomic studies. The first, matrix-assisted laser desorption/ionization time-of-flight (MALDI-TOF) MS is typically used to measure the masses of the peptides derived from the trypsinized parent protein spot, generating a ‘peptide mass fingerprint’ (PMF). A common alternative to the PMF approach is de novo sequencing by electrospray ionisation tandem mass spectrometry (ESI) MS/MS, which yields amino acid sequences of selected tryptic peptides (Figure 1). The first step of tandem MS involves ionisation of a sample and separation based upon the mass-to-charge ratio (m/z) of the primary ions. An ion with a specific m/z value is then selected, fragmented, and the fragment ions detected after passing through the second mass spectrometer. This process produces a series of fragment ions that can differ by single amino acids allowing a portion of the peptide sequence, termed an ‘amino acid sequence tag’, to be determined and used for database searching11.
Figure 1. Peptide identification
1.2 Mass spectrometry
Mass spectrometry is an analytical tool used for measuring the molecular mass of a sample. For large samples such as biomolecules, molecular masses can be measured to within an accuracy of 0.01% of the total molecular mass of the sample i.e. within a 4 Daltons (Da) or atomic mass units (amu) error for a sample of 40,000 Da. This is sufficient to allow minor mass changes to be detected, e.g. the substitution of one amino acid for another, or a post-translational modification. For small organic molecules the molecular mass can be measured to within an accuracy of 5 ppm or less, which is often sufficient to confirm the molecular formula of a compound, and is also a standard requirement for publication in a chemical journal. Structural information can be generated using certain types of mass spectrometers, usually those with multiple analysers which are known as tandem mass spectrometers. This is achieved by fragmenting the sample inside the instrument and analysing the products generated. This procedure is useful for the structural elucidation of organic compounds and for peptide or oligonucleotide sequencing.
Mass spectrometers can be divided into three fundamental parts, namely the ionisation source, the analyser , and the detector.
Ionisation source : MALDI , ESI , Chemical Ionisation , Electron Ionisation, FAB Mass Analyzer : Quadrupole , TOF , Magnetic Sector , Ion Trap , MS/MS
Detector : Electron multiplier , Photomultiplier
Figure 2. Simplified scheme of a mass spectrometer
The sample has to be introduced into the ionisation source of the instrument. Once inside the ionisation source, the sample molecules are ionised, because ions are easier to manipulate than neutral molecules. These ions are extracted into the analyser region of the mass spectrometer where they are separated according to their mass (m) -to-charge (z) ratios (m/z) . The separated ions are detected and this signal sent to a data system where the m/z ratios are stored together with their relative abundance for presentation in the format of a m/z spectrum.
The analyser and detector of the mass spectrometer, and often the ionisation source too, are maintained under high vacuum to give the ions a reasonable chance of travelling from one end of the instrument to the other without any hindrance from air molecules. The entire operation of the mass spectrometer, and often the sample introduction process also, is under complete data system control on modern mass spectrometers.
1.2.1 Sample introduction
The method of sample introduction to the ionisation source often depends on the ionisation method being used, as well as the type and complexity of the sample.
The sample can be inserted directly into the ionisation source, or can undergo some type of chromatography en route to the ionisation source. This latter method of sample introduction usually involves the mass spectrometer being coupled directly to a high pressure liquid chromatography (HPLC), gas chromatography (GC) or capillary electrophoresis (CE) separation column, and hence the sample is separated into a series
of components which then enter the mass spectrometer sequentially for individual analysis.
1.2.2 Methods of sample ionisation
Many ionisation methods are available and each has its own advantages and disadvantages. The ionisation method to be used depends on the type of sample under investigation and the mass spectrometer available. The ionisation methods used for the majority of biochemical analyses are Electrospray Ionisation (ESI) and Matrix Assisted Laser Desorption Ionisation (MALDI).
1.2.3 Analysis and separation of sample ions
The main function of the mass analyser is to separate, or resolve, the ions formed in the ionisation source of the mass spectrometer according to their mass-to-charge (m/z) ratios. There are a number of mass analysers currently available, the better known of which include quadrupoles, time-of-flight (TOF) analysers, magnetic sectors , and both Fourier transform and quadrupole ion traps .
These mass analysers have different features, including the m/z range that can be covered, the mass accuracy, and the achievable resolution. The compatibility of different analysers with different ionisation methods varies. For example, all of the analysers listed above can be used in conjunction with electrospray ionisation, whereas MALDI is not usually coupled to a quadrupole analyser.
Tandem (MS-MS) mass spectrometers are instruments that have more than one analyser and so can be used for structural and sequencing studies. Two, three and four analysers have all been incorporated into commercially available tandem instruments, and the analysers do not necessarily have to be of the same type, in which case the instrument is a hybrid one. More popular tandem mass spectrometers include those of the quadrupole-quadrupole, magnetic sector-quadrupole, and more recently, the quadrupole-time-of-flight geometries.
1.2.4 Detection and recording of sample ions
The detector monitors the ion current, amplifies it and the signal is then transmitted to the data system where it is recorded in the form of mass spectra. The m/z values of the
ions are plotted against their intensities to show the number of components in the sample, the molecular mass of each component, and the relative abundance of the various components in the sample. The type of detector is supplied to suit the type of analyser; the more common ones are the photomultiplier, the electron multiplier and the micro-channel plate detectors.
1.3 Electrospray
Electrospray mass spectrometry (ESMS) has been developed for use in biological mass spectrometry by Fenn et al14.
1.3.1 Electrospray ionisation
Electrospray Ionisation (ESI) is one of the Atmospheric Pressure Ionisation (API) techniques and is well-suited to the analysis of polar molecules ranging from less than 100 Da to more than 1,000,000 Da in molecular mass (Figure 3).
Figure 3. Standard electrospray ionisation source
During standard electrospray ionisation15, the sample is dissolved in a polar, volatile solvent and pumped through a narrow, stainless steel capillary (75 - 150 micrometers i.d.) at a flow rate of between 1 µL/min and 1 mL/min. A high voltage of 3 or 4 kV is applied to the tip of the capillary, which is situated within the ionisation source of the mass spectrometer, and as a consequence of this strong electric field, the sample
emerging from the tip is dispersed into an aerosol of highly charged droplets, a process that is aided by a co-axially introduced nebulising gas flowing around the outside of the capillary (Figure 4). This gas, usually nitrogen, helps to direct the spray emerging from the capillary tip towards the mass spectrometer. The charged droplets diminish in size by solvent evaporation, assisted by a warm flow of nitrogen known as the drying gas which passes across the front of the ionisation source. Eventually charged sample ions, free from solvent, are released from the droplets, some of which pass through a sampling cone or orifice into an intermediate vacuum region, and from there through a small aperture into the analyser of the mass spectrometer, which is held under high vacuum. The lens voltages are optimised individually for each sample.
Figure 4. The electrospray ionisation process
1.4 Nanospray ionisation
Nanospray ionisation16 is a low flow rate version of electrospray ionisation. A small volume (1-4 microL) of the sample dissolved in a suitable volatile solvent, at a concentration of ca. 1 - 10 pmol/microL, is transferred into a miniature sample vial. A reasonably high voltage (ca. 700 - 2000 V) is applied to the specially manufactured gold-plated vial resulting in sample ionisation and spraying. The flow rate of solute and solvent using this procedure is very low, 30 - 1000 nL/min, and so not only is far less sample consumed than with the standard electrospray ionisation technique, but also a small volume of sample lasts for several minutes, thus enabling multiple experiments to
be performed. A common application of this technique is for a protein digest mixture to be analysed to generate a list of molecular masses for the components present, and then each component to be analysed further by tandem mass spectrometric (MS-MS) amino acid sequencing techniques.
ESI and nanospray ionisation are very sensitive analytical techniques but the sensitivity deteriorates with the presence of non-volatile buffers and other additives, which should be avoided as far as possible.
In positive ionisation mode, a trace of formic acid is often added to aid protonation of the sample molecules; in negative ionisation mode a trace of ammonia solution or a volatile amine is added to aid deprotonation of the sample molecules. Proteins and peptides are usually analysed under positive ionisation conditions and saccharides and oligonucleotides under negative ionisation conditions. In all cases, the m/z scale must be calibrated by analysing a standard sample of a similar type to the sample being analysed (e.g. a protein calibrant for a protein sample), and then applying a mass correction.
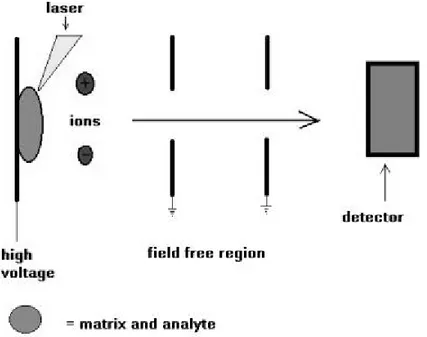
1.5 Matrix assisted laser desorption ionisation (MALDI)
Matrix Assisted Laser Desorption Ionisation (MALDI)17 (Figures 5 and 6) deals well with thermo labile, non-volatile organic compounds especially those of high molecular mass and is used successfully in biochemical areas for the analysis of proteins, peptides, glycoproteins, oligosaccharides, and oligonucleotides. It is relatively straightforward to use and reasonably tolerant to buffers and other additives. The mass accuracy depends on the type and performance of the analyser of the mass spectrometer, but most modern instruments should be capable of measuring masses to within 0.01% of the molecular mass of the sample, at least up to ca. 40,000 Da.
MALDI is based on the bombardment of sample molecules with a laser light to bring about sample ionisation. The sample is pre-mixed with a highly absorbing matrix compound for the most consistent and reliable results and a low concentration of sample to matrix work best. The matrix transforms the laser energy into excitation energy for the sample, which leads to sputtering of analyte and matrix ions from the surface of the mixture. In this way energy transfer is efficient and also the analyte molecules are spared excessive direct energy that may otherwise cause decomposition. Most commercially
available MALDI mass spectrometers now have a pulsed nitrogen laser of wavelength 337 nm.
Figure 5. Matrix assisted laser desorption ionisation (MALDI)
Figure 6. Simplified schematic of MALDI-TOF mass spectrometry (linear mode)
The sample to be analysed is dissolved in an appropriate volatile solvent, usually with a trace of trifluoroacetic acid if positive ionisation is being used, at a concentration of ca. 10 pmol/µL and an aliquot (1-2 µL) of this removed and mixed with an equal volume of a solution containing a vast excess of a matrix. A range of compounds is suitable for use as matrices: sinapinic acid is a common one for protein analysis while
alpha-cyano-4-hydroxycinnamic acid is often used for peptide analysis (Figure 7). An aliquot (1-2 µL) of the final solution is applied to the sample target which is allowed to dry prior to insertion into the high vacuum of the mass spectrometer. The laser is fired, the energy arriving at the sample/matrix surface optimised, and data accumulated until a m/z spectrum of reasonable intensity has been amassed. The time-of-flight analyser separates ions according to their mass(m)-to-charge(z) (m/z) ratios by measuring the time it takes for ions to travel through a field free region known as the flight, or drift, tube. The heavier ions are slower than the lighter ones.
The m/z scale of the mass spectrometer is calibrated with a known sample that can either be analysed independently (external calibration) or pre-mixed with the sample and matrix (internal calibration).
MALDI is also a "soft" ionisation method and so results predominantly in the generation of singly charged molecular-related ions regardless of the molecular mass, hence the spectra are relatively easy to interpret. Fragmentation of the sample ions does not usually occur.
Figure 7. Common MALDI matrices
In positive ionisation mode the protonated molecular ions (M+H+) are usually the dominant species, although they can be accompanied by salt adducts, a trace of the doubly charged molecular ion at approximately half the m/z value, and/or a trace of a
N OH O OH 3-hydroxy-picolinic acid (3-HPA) 2,5-dihydroxy-benzoic acid (DHB) HO C O OH N OH HO O OH Alpha-cyano-4-hydroxy-cinnamic acid (α-CHCA)
Sinapinic acid (SA)
O HO
O
O OH
dimeric species at approximately twice the m/z value. Positive ionisation is used in general for protein and peptide analyses (Figure 8).
In negative ionisation mode the deprotonated molecular ions (M-H-) are usually the most abundant species, accompanied by some salt adducts and possibly traces of dimeric or doubly charged materials. Negative ionisation can be used for the analysis of oligonucleotides and oligosaccharides.
Figure 8. Positive ionisation MALDI m/z spectrum of a peptide mixture using
alpha-cyano-4-hydroxy-cinnamic acid as matrix
1.6 Positive or negative ionisation?
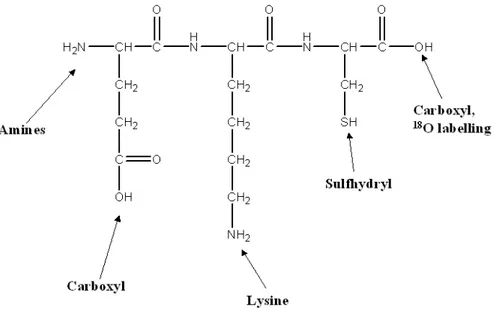
If the sample has functional groups that readily accept a proton (H+) then positive ion detection is used e.g. amines R-NH2 + H+ = R-NH3+ as in proteins or peptides. If the sample has functional groups that readily lose a proton then negative ion detection is used e.g. carboxylic acids R-CO2H = R-CO2- and alcohols R-OH = R-O- as in saccharides or oligonucleotides.
Structural and sequence information from mass spectrometry.
1.7.1 Tandem mass spectrometry
Tandem mass spectrometry (MS-MS) is used to produce structural information about a compound by fragmenting specific sample ions inside the mass spectrometer and identifying the resulting fragment ions. This information can then be pieced together to generate structural information regarding the intact molecule. Tandem mass spectrometry also enables specific compounds to be detected in complex mixtures on account of their specific and characteristic fragmentation patterns.
A tandem mass spectrometer is a mass spectrometer that has more than one analyser, in practice usually two. The two analysers are separated by a collision cell into which an inert gas (e.g. argon, xenon) is admitted to collide with the selected sample ions and bring about their fragmentation. The analysers can be of the same or of different types, the most common combinations being:
quadrupole - quadrupole
magnetic sector - quadrupole
magnetic sector - magnetic sector
quadrupole - time-of-flight.
Fragmentation experiments can also be performed on certain single analyser mass spectrometers such as ion trap and time-of-flight instruments, the latter type using a post-source decay experiment to effect the fragmentation of sample ions.
Tandem mass spectrometry analyses.
The basic modes of data acquisition for tandem mass spectrometry experiments are as follows:
1.7.2 Product or daughter ion scanning
The first analyser is used to select user-specified sample ions arising from a particular component; usually the molecular-related (i.e. (M+H)+ or (M-H)-) ions. These chosen ions pass into the collision cell, are bombarded by the gas molecules which cause fragment ions to be formed, and these fragment ions are analysed i.e. separated
according to their mass to charge ratios, by the second analyser. All the fragment ions arise directly from the precursor ions specified in the experiment, and thus produce a fingerprint pattern specific to the compound under investigation.
This type of experiment is particularly useful for providing structural information concerning small organic molecules and for generating peptide sequence information.
1.7.3 Precursor or parent ion scanning
The first analyser allows the transmission of all sample ions, whilst the second analyser is set to monitor specific fragment ions, which are generated by bombardment of the sample ions with the collision gas in the collision cell. This type of experiment is particularly useful for monitoring groups of compounds contained within a mixture which fragment to produce common fragment ions, e.g. glycosylated peptides in a tryptic digest mixture, aliphatic hydrocarbons in an oil sample, or glucuronide conjugates in urine.
1.7.4 Constant neutral loss scanning.
This involves both analysers scanning, or collecting data, across the whole m/z range, but the two are off-set so that the second analyser allows only those ions which differ by a certain number of mass units (equivalent to a neutral fragment) from the ions transmitted through the first analyser. e.g. This type of experiment could be used to monitor all of the carboxylic acids in a mixture. Carboxylic acids tend to fragment by losing a (neutral) molecule of carbon dioxide, CO2, which is equivalent to a loss of 44 Da or atomic mass units. All ions pass through the first analyser into the collision cell. The ions detected from the collision cell are those from which 44 Da have been lost.
1.7.5 Selected/multiple reaction monitoring
Both of the analysers are static in this case as user-selected specific ions are transmitted through the first analyser and user-selected specific fragments arising from these ions are measured by the second analyser. The compound under scrutiny must be known and have been well-characterised previously before this type of experiment is undertaken. This methodology is used to confirm unambiguously the presence of a
compound in a matrix e.g. drug testing with blood or urine samples. It is not only a highly specific method but also has very high sensitivity.
1.8 Peptide Sequencing by Tandem Mass Spectrometry
The most common usage of MS-MS in biochemical areas is the product or daughter ion scanning experiment which is particularly successful for peptide and nucleotide sequencing.
1.8.1 Peptide sequencing: H2N-CH(R')-CO-NH-CH(R")-CO2H
Peptides fragment in a reasonably well-documented manner18,19. The protonated molecules fragment along the peptide backbone and also show some side-chain fragmentation with certain instruments
There are three different types of bonds that can fragment along the amino acid backbone: the NH-CH, CH-CO, and CO-NH bonds. Each bond breakage gives rise to two species, one neutral and the other one charged, and only the charged species is monitored by the mass spectrometer. The charge can stay on either of the two fragments depending on the chemistry and relative proton affinity of the two species. Hence there are six possible fragment ions for each amino acid residue and these are labelled as in the diagram, with the a, b, and c" ions having the charge retained on the N-terminal fragment, and the x, y", and z ions having the charge retained on the C-terminal fragment. The most common cleavage sites are at the CO-NH bonds which give rise to the b and/or the y" ions. The mass difference between two adjacent b ions, or y"; ions, is indicative of a particular amino acid residue (Figure 9).
The extent of side-chain fragmentation detected depends on the type of analysers used in the mass spectrometer. A magnetic sector - magnetic sector instrument will give rise to high energy collisions resulting in many different types of side-chain cleavages. Quadrupole - quadrupole and quadrupole - time-of-flight mass spectrometers generate low energy fragmentations with fewer types of side-chain fragmentations.
1.8.2 Immonium ions (labelled "i") appear in the very low m/z range of the MS-MS spectrum. Each amino acid residue leads to a diagnostic immonium ion, with the exception of the two pairs leucine (L) and iso-leucine (I), and lysine (K) and glutamine (Q), which produce immonium ions with the same m/z ratio, i.e. m/z 86 for I and L, m/z 101 for K and Q. The immonium ions are useful for detecting and confirming many of the amino acid residues in a peptide, although no information regarding the position of these amino acid residues in the peptide sequence can be ascertained from the immonium ions.
1.8.3 Protein identification common procedure
A protein identification study would proceed as follows:
a. The protein under investigation would be analysed by mass spectrometry to generate a molecular mass to within accuracy of 0.01%.
b. The protein would then be digested with a suitable enzyme. Trypsin is useful for mass spectrometric studies because each proteolytic fragment contains a basic arginine (R) or lysine (K) amino acid residue, and thus is eminently suitable for positive ionisation mass spectrometric analysis. The digest mixture is analysed - without prior separation or clean-up - by mass spectrometry to produce a rather complex spectrum from which the molecular weights of all of the proteolytic fragments can be read. This spectrum, with its molecular weight information, is called a peptide map. (If the protein already exists on a database, then the peptide map is often sufficient to confirm the protein.) For these experiments the mass spectrometer would be operated in the "MS" mode, whereby the sample is sprayed and ionised from the nanospray needle and the ions pass through the
sampling cone, skimmer lenses, Rf hexapole focusing system, and the first (quadrupole) analyser. The quadrupole in this instance is not used as an analyser, merely as a lens to focus the ion beam into the second (time-of-flight) analyser which separates the ions according to their mass-to-charge ratio.
Figure 10. Q-TOF mass spectrometer operating in MS (upper) and MS/MS mode (lower) modes
c. With the digest mixture still spraying into the mass spectrometer, the Q-TOF mass spectrometer is switched into "MS/MS" mode (Figure 10). The protonated molecular ions of each of the digest fragments can be independently selected and transmitted through the quadrupole analyser, which is now used as an analyser to transmit solely the ions of interest into the collision cell which lies inbetween the first and second analysers. An inert gas such as argon is introduced into the collision cell and the sample ions are bombarded by the collision gas molecules which cause them to fragment. The optimum collision cell conditions vary from peptide to peptide and must be optimised for each one. The fragment (or daughter or product) ions are then analysed by the second (time-of-flight) analyser. In this way an MS/MS spectrum is produced showing all the fragment ions that arise directly from the chosen parent or precursor ions for a given peptide component.
An MS/MS daughter (or fragment, or product) ion spectrum is produced for each of the components identified in the proteolytic digest. Varying amounts of sequence information can be gleaned from each fragmentation spectrum, and the spectra need to be interpreted carefully. Some of the processing can be
automated, but in general the processing and interpretation of spectra will take longer than the data acquisition if accurate and reliable data are to be generated.
The amount of sequence information generated will vary from one peptide to another, Some peptide sequences will be confirmed totally, other may produce a partial sequence of, say, 4 or 5 amino acid residues. Often sequence "tag" of 4 or 5 residues is sufficient to search a protein database and confirm the identity of the protein.
1.8.4 Peptide sequencing in summary
Peptides fragment along the amino acid backbone to give sequence information. Peptides ca. 2500 Da or less produces the most useful data. The amount of sequence information varies from one peptide to another. Some peptides can generate sufficient information for a full sequence to be determined; others may generate a partial sequence of 4 or 5 amino acids.
A protein digest can be analysed as an entire reaction mix, without any separation of the products, from which individual peptides are selected and analysed by the mass spectrometer to generate sequence information. About 4 µL of solution is required for the analysis of the digest mixture, with a concentration based on the original protein of ca. 1-10 pmol/µL. MS/MS sequencing is a sensitive technique consuming little sample.
Sometimes the full protein sequence can be verified; some proteins generate sufficient information to cover only part of the sequence. 70 - 80% coverage is reasonable. Often a sequence "tag" of 4/5 amino acids from a single proteolytic peptide is sufficient to identify the protein from a database. The final point in this summary means that mass spectrometers have been found to be extremely useful for proteomic studies, as illustrated below.
The proteomics procedure usually involves excising individual spots from a 2-D gel and independently enzymatically digesting the protein(s) contained within each spot and/or band, before analysing the digest mixture by mass spectrometer in the manner outlined above. Electrospray ionisation or MALDI could be used at this step.The initial MS spectrum determining the molecular masses of all of the components in the digest mixture can often provide sufficient information to search a database using just several of the molecular weights from this peptide map.
If the database search is not fruitful, either because the protein has not been catalogued, is previously uncharacterised, or the data are not accurate or comprehensive enough to distinguish between several entries in the database, then further information is required.This can be achieved by sample clean-up and then MS/MS studies to determine the amino acid sequences of the individual proteolytic peptides contained in the digest mixture, with which further database searching can be carried out.
1.8.5 Peptide Mass Fingerprinting (PMF)
PMF is an analytical technique for protein identification that was developed by John Yates and colleagues20. In this method, a “mass fingerprint” is obtained of a protein enzymatically degraded with a sequence-specific protease such as trypsin. This set of masses, typically obtained by MALDI-TOF, is then compared to the theoretically expected tryptic peptide masses for each entry in the database. The proteins can be ranked according to the number of peptide matches (Figure 11).
More sophisticated scoring algorithms take the mass accuracy and the percentage of the protein sequence covered into account and attempt to calculate a level of confidence for the match21, 22, 23. Other factors can also be included, such as the fact that larger peptides are less frequent in the database and should therefore count more when matched. The accuracy obtained in the measurement of peptide mass strongly influences the specificity of the search24, 25. When high mass accuracy (10 to 50 ppm) is achieved, as a rule at least five peptide masses need to be matched to the protein and 15% of the protein sequence needs to be covered for an unambiguous identification. After a match has been found, a second-pass search is performed to correlate remaining peptides with the database sequence of the match, taking into account possible modifications. Mass fingerprinting can also resolve simple protein mixtures, consisting of several proteins within a roughly comparable amount. For example, databases can be searched iteratively by removing the peptides associated with an unambiguous match26. Generally, peptide mass fingerprinting is used for the rapid identification of a single protein component. Protein sequences need to be in the database in substantially full length. Isoforms can be differentiated from each other, if peptides covering the sequence differences appear in the peptide map. If proteins from organisms with fully sequenced genomes can be identified with a 50–90% success rate when at least a few hundred femtomoles of gel-separated protein are present26.
2
2
Q
2. Quantitative Proteomics
One of the primary goals of proteomics is the description of the composition, dynamics and connections of the multiprotein modules that catalyze a wide range of biological functions in cells. Mass spectrometry (MS) has proven to be an extremely powerful tool for characterizing the composition of purified complexes. However, because MS is not a quantitative technique, the usefulness of the data is limited. For overcoming this limitation various quantitative methods for proteomic studies have been reported27.
Scheme 2. General scheme of the strategies for quantitative proteomic profiling. a) In vivo: 2DE
(two-dimensional electrophoresis), SILAC. b) In vitro: Chemical derivatization, Proteolytic labeling. c) Intensity-based quantitation (quantitation without stable isotopes)
2.1 Quantitation via 2DE and MS
An older and still commonly used approach to proteomic quantitation is the combination of 2DE and MS. In this procedure, proteins are separated by 2DE and quantified based on the intensity of the protein spots of individual gels. Following proteolysis, the derived peptides are extracted from the gel spots and subjected to MS analysis for identification28. A potential problem with 2DE-based quantitation is that the gel spots corresponding between different experiments can be difficult to measure reproducibly. This has been significantly improved by the recent development of a two-colour fluorescence labeling system that allows parallel comparison of two protein samples within the same gel29. Nevertheless, global proteomics analysis by 2DE/MS is still limited for complex protein mixtures.
2.2 Quantitation without stable isotope tags
Isotopic labelling of proteins is not always practical and has several disadvantages. For example, labelling with stable isotopes is expensive, and sometimes the isotopic labels exhibit chromatography shifts that can make quantitation of differentially labelled peptides computationally difficult. Moreover, there may not be enough different isotopes to allow for simultaneous quantitation of proteins from multiple samples. As an alternative, several groups have presented methods of peptide and protein quantitation without isotopic tags by comparing peptide signal intensities measured in sequential MS analyses.
For example, signal intensity-based quantitation has been applied to quantify differentially expressed proteins from samples analysed by LC-MS. Pasa-Tolic
et al.30 have presented a system that uses the mass of a peptide coupled with its corresponding chromatographic elution time as peptide properties that uniquely define a peptide sequence, a method termed ‘the accurate mass and time (AMT) tag approach’30. Using LC coupled with Fourier transform ion cyclotron resonance (LC-FTICR) MS to obtain the chromatographic and high mass accuracy information, they identified peptide
sequences by matching the AMT tags to previously acquired LC-MS/MS sequence information stored in a database.
By taking advantage of the observed linear correlation between peak area of measured peptides and their abundance31, 32 these peptides were relatively quantified by the signal intensity ratio of their corresponding peaks compared between MS runs. The primary advantage of this method is that by not selecting masses for CID, as is carried out with traditional LC-MS/MS, one can obtain higher run to run identification reproducibility, consequently allowing for accurate quantitation of more peptides.
A major disadvantage of peptide quantitation by the signal intensity is that it often includes experimental variation and signal noise, which can affect the quantitative value and accuracy. To circumvent this problem, Wiener and colleagues at Merck Research Laboratories applied statistics tools such as the Student’s t-test to analyze data from multiple LC-MS runs (i.e. ten times in their experiment) for each sample45. At each point of acquisition time and m/z, the amplitudes of signal intensities from multiple LC-MS runs were compared between two samples to detect peptides with statistically significant differences in abundance between samples. This statistically validated approach of signal intensity comparison, focusing on signal variability between samples, appears to be more sensitive and robust than the traditional approach focusing on absolute signal intensity acquired from background/noise subtraction. The major benefit of this approach is its ability to detect low-abundance peptides that are significantly different between samples but are of such low abundance that they would be ignored by traditional intensity-dependent acquisition. As a consequence, more peptides can be identified and quantified by this approach.
The use of signal intensities for quantitation is of particular interest for cases in which isotopic labelling is impractical or not feasible.
2.3 Stable Isotope Labelling
Recently, stable-isotope labelling was introduced into the field of proteomics as a means to measure global differences in protein expression between proteins from different cellular conditions. This exciting the use of stable-isotope labelling provided internal standards for the relative quantitation of multiple proteins simultaneously and
thus allowed a global-type experiment to be performed for measuring protein expression in parallel. Gygi et al.34 introduced the new term isotope-coded affinity tag (ICAT) and incorporated heavy isotopes in vitro. In the ICAT approach the Cys-containing peptides from two samples (e.g. proteins expressed by a cell under two different physiological conditions) are differentially labelled with light (isotopic normal regent containing hydrogen atoms on the carbon backbone) and heavy (where the hydrogen atoms have replaced with deuterium atoms) using a cleavable, biotinylated reagent, and these peptides then affinity purified using immobilized avidin as a result the selectively isolation from non-Cys-containing peptides. The identification was made my LC-ESI-MS.
Scheme 3.General workflow of quantitative proteomic strategies using stable isotopes
Since then several strategies have been reported (Figure 12, Table 1) that target also the N-terminal group of peptides and the side chain amino group of Lysines and Arginines. The most important is the isobaric tag for relative and absolute quantification (iTRAQ)35. iTRAQ used NHS (N-hydroxy-succinimide) active esters as a regent and adds an innovative concept, namely a tag that generates a specific reporter ion for
quantification in MS/MS spectra (mass 114,115,116,117) but with isobaric mass at MS level. Therefore, mass spectra are relatively simple and differential behavior is only reported after fragmentation. Moreover, multiplexing (currently 8-plex) is an interesting feature as it allows comparing more than two conditions.
Figure 12. Generic summary of coding strategies currently employed to exploit various reactive
centers in peptides
2.3.1 O18 Labelling
The tryptic digestion of peptides is a hydrolysis reaction, requiring the incorporation of water molecules. The use of O18 labelled water in the digestion buffer will result in the incorporation of a single O18 labelled carboxyl group at the carboxyl end of each tryptic peptide70, 71. Thus a control sample may be digested with normal water and a test sample may be digested in the presence of O18 labelled water, resulting in peptides differing in mass by 2 Da. These may be quantified in the same manner as ICAT peptides. The main drawback to this type of quantitation is that the labelled peptides will occur at the same point as +2 and subsequent isotopic peaks of the unlabelled peptide. This significantly limits the dynamic range of the technique, although attempts have been made to improve quantitation through the use of isotope matching software56.
2.3.2 Stable Isotope Labelling with Amino Acids in Cell Culture (SILAC)
The technique of SILAC is based on the addition of isotopically labelled amino acids to culture medium. Cells are grown in medium containing 13C and/or 15N labelled amino acids (commonly lysine or arginine). Carbon starvation is sometimes employed to assist uptake of labelled amino acids. These labelled amino acids are taken up and incorporated into cellular proteins. Once cells are lysed, the lysates mixed together, and analysed by MS, it is possible to observe the relative abundances of a given labelled and unlabelled peptide or protein pair in terms of the spectral abundance of their individual mass peaks. The principle drawback of SILAC is that the technique works only with cells that can be grown on medium containing the labelled amino acid and that are auxotrophic for the relevant amino acid. The most commonly used amino acids for SILAC labelling are lysine and arginine, based on the principle that after a tryptic digestion every peptide (excepting the C terminal peptide) can be used for quantitation. Other amino acids suitable for SILAC labelling include leucine (which was used in the original report of the technique), and labelled methionine60 and tyrosine are commercially available. Lysine is commonly used in 12C6 and 13C6 versions for a mass shift of 6, but can be supplemented by 14N2 and 15N2 labels for a total mass shift of 8. Triplet labels can be implemented with the use of labelled arginine, as the 6 and 10Da mass shifts between 12C6 14N4 arginine, 13C6 14N4 arginine and 13C6 15N4 arginine can be clearly visualised on most MS instruments.
Target Name of method or reagent Isotopes References
Amines Tandem mass tag (TMT) D 36
Succinic anhydride D 37
N-acetoxysuccinamide D 38
Acetic anhydride D 39
Propionic anhydride D 40
Nicotinoyloxy succinimide (Nic-NHS) D 41
Phenyl isocyanate D or 13C 42
Suldo-NHS biotin and 13C,CD3I D and 13C 43
Formaldehyde D 44
Isobaric tag for relative and absolyte quantification (iTRAQ) 13 C, 15N, 18 O 35
Benzoic acid lebeling (BA of ANIBAL) 13C 45
Lysines Guanidination (O-methyo-isourea) 13C, 15N 46,47,48 Quantitation using enhanced sequence
tags (QUEST)
No isotope 49
2-Methoxy-4,5-1H-imidazole D 50
Sulfhydryl Isotope-coded affinity tagging (ICAT) D 34
Cleavable ICAT 13C 51,52,53
Catch and release (CAR) 13C 54
Acrylamide D 55
Isotope-coded reduction off of a chromatographic support (ICROC)
D 56
2-vinyl-pyridine D 57
N-t-butyliodoacetamide D 58
Iodoacetanilide D 58
HysTag D 59,60
Visible isotope-coded affinity tags (VICAT)
13
C, 14C, 15N 61
Carboxyl Methyl esterification D 67
Ethyl esterification D 68
C-terminal isotope-coded tagging using sulfanilic acid (SA)
13
C 69
Aniline labeling (ANI of ANIBAL) 13C 67
Proteolytic 18O labeling (H218O) 18O 70,71,72,73 Quantitative cysteinyl-peptide enrichment
technology (QCET)
18
O 74
Solid Phase Acid-labile isotope-coded extractants (ALICE)
D 62
Solid phase mass tagging 13C 63
Solid-phase ICAT D 64
A novel class of iodo containing resins D 65
Design and synthesis of a solid-phase fluorescent mass tag
13
C, 15N 66
2.4 Solid-Phase Chemical tools for proteomics
Techniques involving solid supports have played crucial roles in the development of synthetic peptides & proteins, genomics, proteomics and the molecular biology in general. Similarly, methods for immobilization or attachment to surfaces and resins have become ubiquitous in sequencing, synthesis, analysis and screening of oligonucleotides, peptides and proteins.
2.4.1 Solid Phase Synthesis
Solid-phase synthesis is a method in which molecules are bound on a bead (a resin) and synthesized step-by-step in a reactant solution. Compared with traditional liquid phase synthetic techniques, it is easier to remove excess reactant or byproduct from the product. In this method, building blocks are protected at all reactive functional groups. The two functional groups that are able to participate in the desired reaction between building blocks in the solution and on the bead can be controlled by the order of deprotection. This method is used for the synthesis of peptides, deoxyribonucleic acid (DNA), and other molecules that need to be synthesized in a certain alignment. Recently, this method has also been used in combinatorial chemistry.
Solid-phase synthesis is the most common method for peptide synthesis. Usually, peptides are synthesized from the carbonyl group side to amino group side of the amino acid chain in this method, although peptides are synthesized in the opposite direction in cells. In peptide synthesis, an amino-protected amino acid is bound to a bead (a resin), forming a covalent bond between the carbonyl group and the resin. Then the amino group is deprotected and reacted with the carbonyl group of the next amino-protected amino acid. The bead now bears two amino acids. This cycle is repeated to form the desired peptide chain. After all reactions are complete, the synthesised peptide is cleaved from the bead.
The protecting groups for the amino groups mostly used in this peptide synthesis are 9-fluorenylmethyloxycarbonyl group (Fmoc) and t-butyloxycarbonyl (Boc). The Fmoc group is removed from the amino terminus with basic conditions while the Boc group is removed with acid conditions.
Scheme 4. General scheme of Fmoc strategy for peptide synthesis using solid phase supports
2.4.2 Solid phase support (resin)
Small solid beads, insoluble yet porous, are treated with functional units ('linkers') on which peptide chains can be built. The peptide will remain covalently attached to the bead until cleaved from it by a reagent such as trifluoroacetic acid. The peptide is thus 'immobilized' on the solid-phase and can be retained during a filtration process, whereas liquid-phase reagents and by-products of synthesis are flushed away. The physical properties of the solid support, and the applications to which it can be utilized, vary with the material from which the support is constructed, the amount of crosslinking, as well as the linker and handle being used.
Figure 13. Polystyrene synthesis
Merrifield75 firstly introduced solid phase strategies. His resin (Figure 14, 1) is a polystyrene resin based on a copolymer of styrene and chloromethylstyrene. In addition this polymer is also cross-linked with divinylbenzene present in the monomer composition up to 5%. Merrifield resin is named after its inventor. The cleavage of the products from the resin can be done by treatment of the resins with strong acid, such as HF or TFMSA, or by hydrogenolysis. Cl C Cl Cl 1 2
The handling of these acids is the main disadvantage of Merrifield’s resin. Barlos introduced76, 77 an easy-cleavable resin (Figure 14, 2), which is a copolymer of styrene and 2-Chlorotrityl. The cleavage can be done using mild conditions (0.5% TFA). These types of resins are used for automated peptide synthesizers.
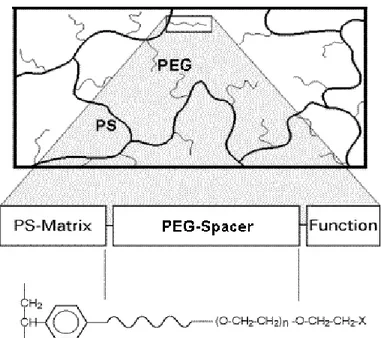
2.4.3 TentaGel resins
Tentagel resins are grafted copolymers consisting of a low crosslinked polystyrene matrix on which polyethylene glycol (PEG or POE) is grafted. As PEG is a "cameleon type" polymer with hydrophobic and hydrophilic properties, the graft copolymer shows modified physico chemical properties. There are in principle two ways to introduce PEG onto the modified polystyrene matrix. The simplest immobilization procedure is to couple PEG via one of its terminal hydroxyl groups to chloromethylated polystyrene according to the classical ether synthesis or to use other bifunctional PEG's for coupling onto the solid support. The hydrophilic properties of TentaGel resins make them suitable for Proteomics applications because of the aqueous solutions that are used in the proteins and peptides sample preparation.
2.5 Quantitative proteome analysis by solid-phase isotope tagging and mass spectrometry
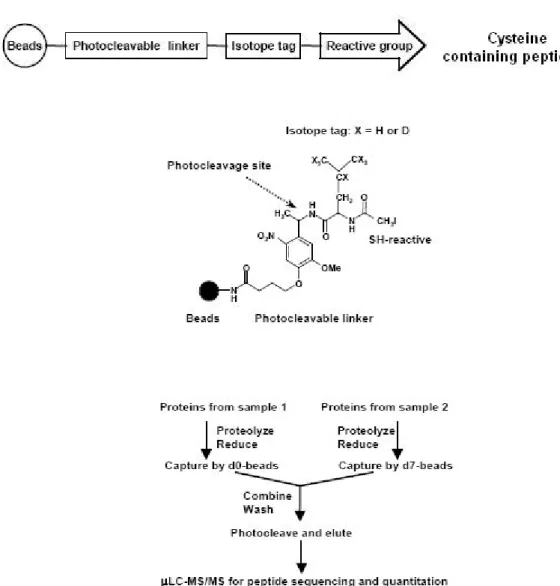
Recently, solid-phase stable-isotope labelling methods emerged. Zhou et al.64 (Figure 16) reported the photo cleavable iodo-containing glass beads method. Briefly, Cysteinyl peptides from two samples were covalently captured on the solid phase containing isotopically heavy or normal (in the leucine residue, d0/d7) tag. The beads were combined, washed and exposed to UV light (360nm). This resulted the photocleavage of the linker and the transfer of isotope tags from the solid phase onto the side chain of cysteine residues. Finally, recovered tagged peptides were analyzed by LC-MS/MS to determine the sequence and relative abundance of each peptide.
Two years later, Li Zhang et al.65 (Figure 17) reported an iodo-containing resin with a thiol-reactive group that is used to capture the Cys-containg peptides from peptide mixtures using an aminomethyl polystyrene resin with Ring Amide Linker. The “tag” amino acid was designed to be leucine (d0/d10). The Cys-containing parts were cleaved from the resin with trifluoroacetic acid (TFA)-ethanedithiol(EDT)-thioanisole-phenol-water (81,5:2,5:5:5:6) followed by ì LC-MS analysis.
Figure 17. Structure of the iodo-containing resins H/D of Li Zhang et al.65
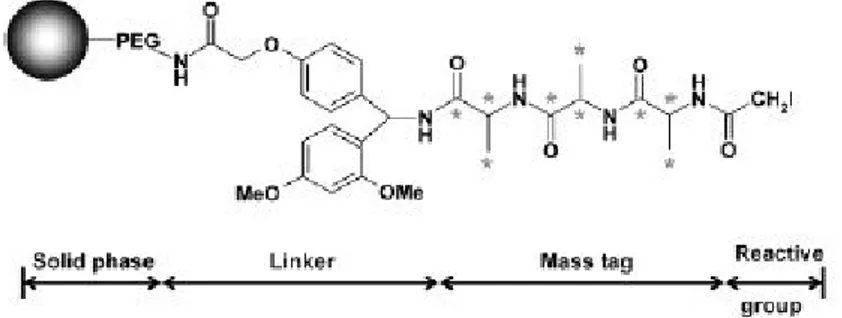
The same period Yang Shi et al.63 (Figure 18) reported another iodo-containing resin using a polymethacrylate/PEG resin with a Ring Amide Linker. The mass tag was a trialanine peptide containing 12C or 13C producing a 9 mass unit difference. The Cys-containing peptides were cleaved with a 50% TFA in DCM solution. The analysis was made using MALDI-TOF and LC/NamoESI-MS mass spectrometry.
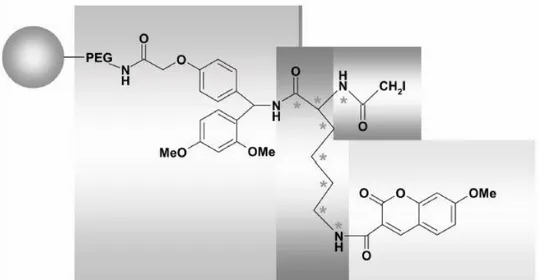
The same group reported66 (Figure 19) a solid phase fluorescent iodo-containing mass tag. The fluorescent molecule (7-methoxycoumarin-3-carboxylic acid) was attached to the ε amino group of a lysine (12C,14N / 13C,15N) and the product was attached to a polymethacrylate/PEG resin with a Ring Amide Linker. The thiol-reactive group was coupled in the α amino group using succinimidyl iodoacetate. The Cys-containing peptides were cleaved with TFA-ACN-H20 (95:2,5:2,5) and analyzed MALDI-TOF and RP HPLC (LIF detector).
Figure 19. Schematic diagram of the solid phase fluorescent lysine (12C,14N / 13C,15N) mass tag by Yang Shi et al.66
3
3
R
3. Results and discussion
Proteomics, the analysis of the protein complement of a cell or an organism has grown rapidly as a sub discipline of the life sciences. The quantitative information is a necessity for understanding the protein world. Quantitative proteomics involves the identification and quantitation of protein components in various biological systems. Stable isotope labelling technology, by chemical derivatization, has been the most commonly used approach for global proteome profiling. The ion intensity-based quantitative approach has progressively gained more popularity as mass spectrometry performance has improved significantly.
Our approach to the quantitative proteomics field was to develop various types of solid phase-based reagents that could be easily synthesized using commonly available techniques and reagents at reasonable cost. The reagents are trifunctional molecules composed of a “reporter”, a “spacer” group and a specific reactive group capable of reacting easily with the N-terminal group of the peptides or the Thiol side chain group of Cysteins.
Scheme 5. General structure of reagents needed for quantitative proteomics
The area of solid phase peptide synthesis provides a rich source of options for creation of such reagents. In this study, I describe the synthesis of mass tags based on the d0, d6 Dansyl group (Scheme 6) compounds as well as the synthesis of Isobaric mass tags based on the d0, d3 S-Methylated thiol group of Cysteine (Scheme 6). Two different peptide/protein reactive groups have been tried on their N-terminal. Thiol-reactive group can catch the cysteine containing peptides while the succinimidyl tag catches the amine groups. The C-terminal is linked with an amide bond through an acid-labile handle to a TentaGel resin. After cleavage, these reagents provides a 6 (Dansyl) or 3 (Cys-Cys Isobaric) mass unit difference between heavy and light labelled peptides