Sapienza University of Rome
Department of Biochemical Sciences “A. Rossi Fanelli”
Beyond intermediary metabolism: characterization of the
moonlighting nucleic acid binding function of human
serine hydroxymethyltransferase
Giulia Guiducci
XXXII cycle
PhD Programme in Biochemistry
Tutor
Coordinator
Summary of the work
The present thesis aims to dissect the moonlighting nucleic acid binding activity of human cytosolic serine hydroxymethyltransferase (SHMT1), a double-faced metabolic enzyme.
Indeed, the work characterizes the interaction between SHMT1 and RNA molecules in vitro as well as in cell models, thus unraveling an unexpected complex mechanism in which the synergy among SHMT1, RNA and metabolites fine tunes the compartmentalization of serine metabolism in lung cancer cells.
On the other hand, the study of the SHMT1-DNA complexes, presented herein, set the basis to hypothesize a nuclear function of the enzyme mediated by its binding with the DNA.
Overall this manuscript is pioneer in characterizing the moonlighting nucleic acid binding activity of SHMT1 and, most of all, in determining the functional relevance of such phenomenon, thus placing SHMT1 in the network which interconnects intermediary metabolism with gene replication and gene expression.
1
TABLE OF CONTENTS
1. Introduction
1.1 Moonlighting proteins: a fascinating mode of multitasking 1.2 A weird couple: metabolic enzymes and nucleic acids 1.3 Serine hydroxymethyltransferase (SHMT)
1.4 The crosstalk between cytosolic and mitochondrial SHMT
1.5 The hypothesis: SHMT1 as a putative nucleic acid binding protein 1.6 Aim of the thesis
2. Materials and Methods
2.1 Analysis of SHMT1-nucleic acid interaction 2.1.1 Protein expression and purification 2.1.2 Site-directed mutagenesis
2.1.3 In vitro transcription and RNA biotinylation 2.1.4 Electrophoretic mobility shift assay (EMSA) 2.1.5 RNA immunoprecipitation (RIP)
2.1.6 Libraries preparation for next generation sequencing (NGS) 2.2 Analysis of SHMT1 enzymatic activity
2.2.1 In vitro enzymatic assays 2.2.2 Enzymatic assays in living cells
2.3 Analysis of the cellular effects of SHMT1-RNA interaction 2.3.1 Cell lines
2.3.2 Cell transfection
2.3.3 RNA extraction and real-time qRT-PCR analysis 2.3.4 Ex vivo and in vitro luciferase assays
2 2.3.5 Serine consumption assay
2.4 Statistical analysis
3. Results
3.1 Expression of SHMT transcripts in lung cancer 3.2 SHMT1 binds to the 5’UTR of shmt2 transcripts
3.3 SHMT1-UTR2 interaction: post-transcriptional and translational effects 3.4 Modulation of the RNA binding through SHMT substrates
3.5 Identification of the residues involved in the RNA binding 3.6 Effects of the RNA binding on SHMT1 activity
3.6.1 Mechanism of inhibition 3.7 Metabolic effects of UTR2 3.8 Discovering other target RNAs
3.9 Not only RNA: insights into the DNA binding ability of SHMT1 3.10 The nuclear function of SHMT1
4. Discussion
4.1 The discovery of a nucleic acid binding protein 4.2 RNA-protein interaction: who affects whom?
4.3 Understanding the biological meaning of SHMT1 moonlighting activity
5. Conclusions and Perspectives
3
1. Introduction
1.1 Moonlighting proteins: a fascinating mode of multitasking
The term moonlighting was coined by Costance J. Jeffery in 1999 (1), in his pioneer paper he refers this noun to proteins having two or more different functions, in analogy to moonlighting people who have multiple jobs (Fig. 1).
Figure 1. Picture extracted from the pioneer paper of C.J. Jeffery (1999) in which the author makes an analogy between moonlighting proteins and moonlighting people.
Indeed, moonlighting proteins perform multiple autonomous activities, often unrelated to each other; the definition excludes proteins resulting from gene fusions, translation of splice variants generated from the same gene and homologous counterparts.
Examples of moonlighting proteins have been described in many species including plants, animals, yeast and prokaryotes, spanning a wide range of
4
proteins including receptors, enzymes, transcription factors and structural proteins (2).
How a secondary function evolved, as well as how such moonlighting activity switches with the canonical one are interesting questions, which still do not have a clear answer. In some cases, proteins were adapted to a secondary function without many changes in the structural features, while in others the evolution of new binding sites, alternative conformational changes or other new features has been required (3).
The most accredited hypotheses explaining the evolution of moonlighting proteins are briefly summarized below.
The first hypothesis suggests that the rise of mutations results in a biological advantage. Mutations can occur in the coding and/or in the regulatory regions of genes encoding the moonlighting proteins. Although this scenario may be seemingly in contrast with the fact that mutations in the coding regions tend to be deleterious, some structural properties may prevent such negative effects (4). For instance, proteins having flexible and modular regions display higher probability to accumulate mutations without detrimental consequences on the ancestral structure and function, thus favoring the establishment of a moonlighting activity.
Alternatively, moonlighting functions can develop as a consequence of mutations in genes encoding for transcriptional regulators, which in this way acquire the capacity of controlling the expression of multiple proteins, enhancing the possibility that moonlighting interactions, previously nonexistent, may develop (5).
A second model involves gene duplication, such biological event could have enabled the origin of moonlighting functions. Indeed it has been observed, mainly in yeast, the existence of multifunctional proteins originated from
5
paralogue genes derived from whole genome duplications or from small scale duplication events (4).
Although many moonlighting activities reside in highly conserved proteins (e.g. metabolic enzymes), the presence of such functions cannot be predicted based on homology. For example, the yeast Saccharomyces cerevisiae synthetizes two pyruvate carboxylases sharing the 80% of sequence identity with the pyruvate carboxylase from Hansenula polymorpha. Despite the high similarity between these proteins, neither one of the pyruvate carboxylases from Saccharomyces cerevisiae display moonlighting functions, whereas
Harsenula polymorpha pyruvate carboxylase is involved in the assembly and
translocation of the peroxisomal alcohol oxidase. On the other hand, the same enzyme in Pichia pastoris, equally sharing 80% of sequence identity with the pyruvate carboxylase from Harsenula polymorpha, it’s capable of fulfilling such moonlighting function (2).
Given their complex nature and the lack of common physical features, there is no straightforward method to identify moonlighting proteins, mainly because their second function is often hidden by the more evident one (that it is commonly called “primary function”), and thus hard to unveil.
The increase of newly discovered moonlighting functions prompted researchers to create a tool able to organize and store all the information. The MoonProt database was created in 2015, providing the first centralized, web-based database of moonlighting proteins (6, 7). The database contains information about the sequences, structures and functions of over 200 moonlighting proteins, thus integrating the information scattered across the literature with several links to other databases.
Most moonlighting proteins serve as connection or switch among multiple biochemical pathways, helping the cell to fine tune the response to changes in
6
the environment as well as to regulate the basal metabolism (3); in other cases their second function is purely structural, as described for the duck protein ε-crystallin which has structural functions in the lens, but it acts as a lactate dehydrogenase in other tissues (8). The repertoire of proteins performing additional functions will surely greatly expand in the future years.
The universe of moonlighting functions is huge and the major part of it is still currently unknown; the present thesis is focused on metabolic enzymes that moonlight as nucleic acids binding proteins.
1.2 A weird couple: metabolic enzymes and nucleic acids.
For years metabolic enzymes had been studied for their role in the catalysis of enzymatic reactions essential for cell metabolism. Strikingly, in the last decades it has emerged that the most part of them displays moonlighting functions; among the discovered non-canonical activities of metabolic enzymes the nucleic acid binding property is of great importance.
The evidences that cytosolic and mitochondrial enzymes are able to translocate into the nucleus (Fig. 2) (9) raised the hypothesis of the existence of moonlighting functions carried out through the interaction with the DNA. Indeed, recent papers report evidences of metabolic enzymes that, although lacking canonical DNA binding domains, are involved in the regulation of gene transcription either by interacting with specific DNA sequences or by binding to transcriptional factors (10). The existence of a metabolism-gene transcription axis is thus emerging, allowing the cell to sense metabolic changes and to rapidly respond modulating gene expression through the non canonical activity of metabolic enzymes.
7
Figure 2. Metabolic enzymes moonlighting in the nucleus. Cytoplasmic glycolytic and non-glycolytic enzymes are shown respectively in green and blue, mitochondrial enzymes are represented in orange or white. While all the essential glycolytic enzymes are found also in the nucleus, only some of the Krebs cycle enzymes have been described in the nucleus (orange) whereas others have not (white filling). In the nucleus, the translocated enzymes have been grouped together according to their proposed nuclear function, whether canonical or non-canonical. Abbreviations: ACLY, ATP citrate lyase; ACO2, aconitase 2; ACPEs, acetyl-CoA-producing enzymes; ACSS2, acetyl-CoA synthetase short-chain family member 2; ALDO, fructose bisphosphate aldolase; CRAT, carnitine acetyltransferase; CS, citrate synthase; ENO, enolase; FBP1, fructose-1,6-bisphosphatase; FH, fumarate hydratase; GAPDH, glyceraldehyde 3-phosphate dehydrogenase; HK, hexokinase; IDH2, isocitrate dehydrogenase 2; LDH, lactate dehydrogenase; MDH2, malate dehydrogenase 2; OGDC, /-ketoglutarate dehydrogenase; PDC, pyruvate dehydrogenase complex; PFK, phosphofructokinase; PGI, phosphoglycerate isomerase; PGK, phosphoglycerate kinase; PGM, phosphoglycerate mutase; PKM2, pyruvate kinase M2; SCS, succinyl-CoA synthetase; SDH, succinate dehydrogenase. The picture is taken from (9).
An interesting example of this axis is provided by lactate dehydrogenase (LDH), which converts pyruvate into lactate under anaerobic conditions. Following the phosphorylation of Tyrosine 238, LDH translocates into the nucleus, where it binds to single stranded DNA (11) and interacts with the
8
DNA polymerases α, δ and ε, stimulating DNA synthesis in the post-UV radiation DNA repair (12). However, the mechanism that fine tunes this process is still not completely understood, and further investigations are required.
In parallel to the metabolism-gene transcription axis, strong evidences supporting the existence of an RNA-Enzymes-Metabolites network (recently named “REM theory”) have also raised (13), thus connecting cell metabolism to RNA biology and gene expression.
The combination of in vitro studies and high throughput analysis has allowed to identify hundreds of novel RNA binding proteins (RBPs) (14). Among them, different enzymes involved in the tricarboxylic acid cycle, glycolysis, pentose phosphate cycle, fatty acid metabolism, pyrimidine synthesis and other metabolic processes have been found (reviewed and listed in (15)), showing RNA binding activity often with significant specificity for defined sequences and/or structural motifs. It is intriguing to notice that most of the identified proteins were not previously related to RNA biology, since they completely lack the classical well characterized RNA binding domains (RBDs) such as RNA recognition motif (RRM), hnRNP KH homology (KH) and DEAD box helicase domains (16).
A striking example is given by glyceraldehyde-3-phosphate dehydrogenase (GAPDH), a key enzyme in glycolysis that has been found to moonlight as a regulator of gene expression through its RNA binding activity. GAPDH oxidizes glyceraldehyde-3-phosphate to reduce nicotinamide adenine dinucleotide (NAD+). In resting T cells, which rely on oxidative phosphorylation for energy generation, GAPDH binds to AU-rich elements in the 3' untraslated region (3'UTR) of the cytokine mRNAs, including interferon γ, inhibiting their translation. Upon activation, the metabolism of T
9
lymphocytes shifts from oxidative phosphorylation to aerobic glycolysis and GAPDH disengages from RNA, de-repressing the cytokine production (17). The switch between GAPDH regulatory and enzymatic activity is due to the competition between the RNA and the NAD+ for the binding to the same site. Indeed, the globular Rossman-fold domain, specialized to bind nucleotide enzymatic cofactors, has been recognized as a common unconventional RBD (18). Therefore the cell metabolic state (i.e. the levels of NAD+ and ATP) fine tunes the usage of the GAPDH Rossman fold between its RNA binding (inactive in glycolysis) and NAD+ binding (active in glycolysis) activity in vivo (19).
Even if the above examples of metabolism-gene expression axis and REM regulation are intriguing, many key questions remain unanswered. Indeed, with a few exceptions, it’s not clear why metabolic enzymes bind to nucleic acids as well as what are the biological consequences of these interactions and how metabolites can mediate such processes (20).
Given their biological and evolutionary differences, each single metabolic enzyme deserves a dedicated analysis of its nucleic acids binding feature. Not surprisingly, proteins belonging to the same metabolic pathway, such as LDH and GAPDH, display significant differences in their nucleic acids binding properties, highlighting the existence of various levels of regulation that need to be carefully investigated.
With the technical advances of the ‘omics’ age many of these questions can now be addressed far more easily and comprehensively than when most of these bifunctional proteins were firstly described.
10
1.3 Serine hydroxymethyltransferase (SHMT)
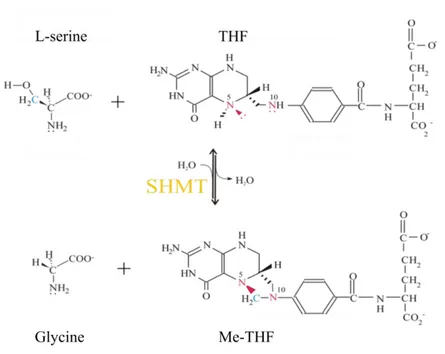
Serine hydroxymethyltransferase (SHMT) is a ubiquitous pyridoxal-5’- phosphate(PLP)-dependent enzyme, highly conserved in eukaryotes and prokaryotes. It is known to catalyze the reversible retroaldolic cleavage of L-serine into glycine, transferring the one carbon unit derived from the hydroxymethyl group of serine to (poly/mono)glutamylated tetrahydrofolate (THF), thus producing (poly/mono)glutamylated 5,10-methylenetetrahydrofolate (Me-THF) (Fig. 3).
Figure 3. Reaction catalyzed by SHMT with L-serine or glycine and monoglutamylated folates as substrates.
Based on its fold, SHMT has been classified in the fold type I family (or aspartate aminotransferase family), indeed, as for the other members of this
11
group, each enzyme subunit binds a molecule of PLP and is folded into two domains. The larger domain is located at the N-terminal and is composed by seven-stranded β-sheets, while the small C-terminal domain is made by three-stranded β-sheets, covered with helixes on one side (21). These subunits associate into dimers in prokaryotes and tetramers in eukaryotes.
The human enzyme is a homotetramer and its architecture is described as “dimer of obligate dimers’’ (22), where the so-called obligate or tight dimer represents the minimal catalytically active unit existing in solution (Fig. 4). Indeed, in the obligate dimer the active site is located at the monomers interface, being surrounded by residues belonging to both subunits of the dimer (23).
12
Figure 4. Three-dimensional (left picture) and schematic (right picture) representation of the tetrameric structure of human serine hydroxymethytransferase (PDB: 1BJ4). Each monomer is colored with a different nuance of blue, one obligate dimer is composed by the darker subunits (upper part of the figures), while the other one is formed by the monomers colored in light blue (lower part of the figures). In the 3D structure PLP is colored in green and highlighted with a red circle. In the schematic representation the tetrameric interface is highlighted (green dashes), joining together the two obligate dimers.
The human genome contains two shmt genes, shmt1 and shmt2, encoding three main SHMT isoforms that differ in sequence and/or localization: one mitochondrial isoform, named SHMT2, and two cytosolic isoforms, SHMT1 and SHMT2α, the latter lacking the mitochondrial import signal present in SHMT2 and thus localizing in the cytosol. The isozymes are similar but not identical: they share the 66% of amino acid sequence identity, however, despite the high sequence similarity, SHMT1 and SHMT2 in the apo-form (without PLP) have different quaternary structures. Indeed, apo-SHMT1 has a
13
stable conformation that allows the assembly of the tetramer, whereas apo-SHMT2 is less stable, displaying a dimeric structure which only upon PLP binding converts into the holo-tetramer (23). The catalytic properties of SHMT1 and SHMT2 are similar, although their optimal reaction rate occurs at different pH; such difference may represent an adaptation of the two isoforms to their respective cellular environments (i.e. cytosol and mitochondrion) (24). SHMT has been widely studied given its central role in the one-carbon (1C) metabolism, a metabolic pathway needed to activate and transfer 1C units thus supporting nucleotide synthesis, methionine synthesis, folate homeostasis and amino acids metabolism. The 1C metabolism is compartmentalized within cytosol and mitochondrion with dedicated enzymes (Fig. 5); the reason for such compartmentalization is still puzzling, although some clues are rising thanks to the study of metabolic fluxes (25).
14
Figure 5. Compartmentalization and products of one-carbon metabolism. All abbreviations are standard gene names. Certain descriptions utilize the common protein name for clarity. SHMT1/2, serine hydroxymethyl transferase, cytosolic(1) and mitochondrial (2); MTHFD1, methylenetetrahydrofolate dehydrogenase, cyclohydrolase, and formyltetrahydrofolate synthetase 1; MTHFD2/L, methylenetetrahydrofolate dehydrogenase 2/2-like; MTHFD1L, monofunctional tetrahydrofolate synthase, mitochondrial; MTFMT, mitochondrial methionyl-tRNA formyltransferase; TYMS, thymidylate synthetase; MTHFR, methylenetetrahydrofolate reductase; MTR, methionine synthase; DHFR, dihydrofolate reductase; GART, phosphoribosylglycinamide formyltransferase; ATIC, 5-aminoimidazole-4-carboxamide ribonucleotide formyltransferase/IMP cyclohydrolase; ALDH1L1/2, cytosolic (1) and mitochondrial (2) 10-formyltetrahydrofolate dehydrogenase. The picture is taken from (26).
In the mitochondrion, the SHMT2 isozyme is mainly involved in the serine-derived production of both glycine and 1C units necessary to fuel the local synthesis of thymidine monophosphate (dTMP) and antioxidant molecules (NADPH and glutathione) as well as the nucleotides synthesis in the cytosol (25, 27). Indeed, 1C units are released from the mitochondrion as formate, which then fuels the cytosolic synthesis of purines and pyrimidines (28). Recent reports demonstrated that the reaction catalyzed by SHMT2 is also
15
required for the maintenance of specific mitochondrial transfer RNA (tRNA) pools, since it affects the levels of formylmethionyl-tRNA and other methylated tRNAs, thereby controlling the translation of mitochondrial respiratory complexes (29, 30).
By contrast, in the cytosol SHMT1 is likely to have a more versatile role, since it can switch the directionality of the reaction depending on cell types and metabolic needs. Indeed, metabolic studies on proliferating cells showed that the most frequent trend of the SHMT1 reaction is directed toward the production of serine and THF rather than glycine and Me-THF. However, it has been demonstrated that not all the cell lines follow such trend and, given the plasticity of the 1C metabolism, the reaction can be reverted in case of defects in the mitochondrial 1C metabolic flux (25, 31).
SHMT1, like many others metabolic enzymes (see section 1.2), has been found to localize also in the nucleus. Interestingly, reports by Anderson D.D. et al. (32, 33) pointed out that such localization occurs only during the S-phase of the cell cycle, allowing SHMT1 to participate to DNA replication and/or repair through nuclear thymidylate biosynthesis. However, the molecular mechanism through which this happens is still not completely clear and will be further investigated in the present thesis.
SHMT2α is the least characterized isozyme among the three, its metabolic function is believed to be redundant with the one of SHMT1, since it undergoes the same nuclear localization (33). Interestingly, recent works report a role of this isoform in the control of inflammatory cytokine signalling, as it takes part to the deubiquitylating BRCC36 isopeptidase complex (BRISC) (34). Of note, BRISC crystal structure revealed that SHMT2α participates to the complex as apo-dimer (23, 35). Overall the function of SHMT2α, either metabolic or moonlighting, needs to be further clarified.
16
The reaction catalyzed by SHMT isoforms is pivotal not only in cell physiology but also in cell pathology: indeed, it is at the basis of cancer metabolic reprogramming since it is essential for the rapid proliferation of neoplastic cells. Serine metabolism is often dysregulated in tumors (36) and, not surprisingly, cancer cells often overexpress one or more SHMT isoforms, indeed both isozymes are considered chemotherapic targets (37, 38). A lot of efforts have been done to develop small molecules able to selectively inhibit the cytosolic or the mitochondrial SHMT isoform; to date, a couple of effective small molecules having a nanomolar affinity for the enzymes have been found, although they are still far from the clinical application (39, 40).
SHMT1 and SHMT2 are subjected to multiple layers of regulatory events inside the cell. At the transcriptional level both isozymes are regulated by the c-Myc transcriptional factor, which binds to their promotors in normal and transformed cells (41); moreover, given the involvement of SHMT2 in the redox cell balance, the expression of this isoform is induced by hypoxic stress through the hypoxia-inducible factor 1 (HIF-1) to counteract the production of reactive oxygen species (42).
Different post-translational modifications (PTMs) have been characterized for both proteins as well. SHMT1 is subjected to an interplay between ubiquitination and SUMOylation: the basal homeostasis of the cytosolic protein is regulated by an ubiquitination on Lys48, which leads to a proteasome-mediated degradation of the enzyme. During the S phase and in response to UV damage, the enzyme is sumoylated (SUMO-1) and imported in the nucleus where, following the removal of such modification, SHMT1 can be either stabilized by ubiquitination and exported again into the cytoplasm or, if the export is impaired, the protein undergoes a nuclear sumoylation (SUMO-2/3) which is thought to lead to nuclear degradation (Fig.6 and (43)).
17
A peculiar PTM has been recently described for mitochondrial SHMT2: the succinylation. When succinylated, the dimeric form of the enzyme is mostly populated, resulting in a very low enzymatic activity; when cells are in proliferation or under metabolic stress, the enzyme is desuccinylated by SIRT5 thus allowing the tetramer formation which is required for the activation of the catalysis (44).
Overall human serine hydroxymethytransferase is a good example of how metabolic enzymes involved in the intermediary metabolism are subjected to a multi-layered regulation, needed to fine tune their multiple functions in the crowded cellular environment.
Figure 6. Proposed model for the interplay between ubiquitination (Ub) and SUMOylation (SUMO) of SHMT1. When known, the name of the enzymes that perform the modifications are reported. The picture is taken from (43).
18
1.4 The crosstalk between cytosolic and mitochondrial SHMT
A peculiar link between SHMT1 and SHMT2 expression has been observed in some normal and tumor cells.
Literature reports a general trend in which, among different cancer types, SHMT2 is usually the most overexpressed isozyme with respect to SHMT1 (42). However there are some exceptions: in lung cancer tissues and in lung cancer tumor initiating cells it has been observed also a significant upregulation of the SHMT1 expression (37, 45), suggesting a major role of this isoform in such models.
In this background, Paone et al. reported for the first time a crosstalk between SHMT1 and SHMT2 in lung cancer cells (37). Indeed, it was observed that the knockdown of SHMT1 in H1299 triggered apoptosis and induced a compensatory increase in the SHMT2 protein expression (Fig. 7), whereas the knockdown of the mitochondrial isoform did not have any effects on the cytosolic counterpart (37). It was clear that the expression of SHMT1 and SHMT2 was somehow interconnected, but the molecular mechanism at the basis was completely unknown.
Two years later a cross regulation between SHMT isozymes was observed also in a normal cell model (i.e. HEK293T), although with a completely different trend (Fig. 8). In fact, in this case, the deletion of SHMT1 decreased SHMT2 protein levels, whereas the deletion of SHMT2 increased SHMT1 expression (25).
19
Figure 7. Western blot analysis of SHMT2 protein expression in H1299 cell line. iscr and iSHMT1 indicate, respectively, the samples treated with scrambled RNA interference (RNAi) or with SHMT1 RNAi. The picture is taken from (37).
Figure 8. Western blot analysis of SHMT2 and SHMT1 protein expression in HEK293T WT or knockout (KO) for SHMT1 or SHMT2. The picture is taken from (25).
How the cell is able to sense the variation of each isozyme and how it modulates in response the expression of the other counterpart still remains an open question.
20
1.5 The hypothesis: SHMT1 as a putative nucleic acid binding protein
Two decades ago an interesting report showed the first evidences that SHMT1 was able to bind RNA, and that it could potentially behave as an RNA binding protein inside the cell. In their paper Liu et al. performed an in vitro analysis, showing that the cytosolic isozyme binds to the 5'UTR of its own mRNA, inhibiting its translation (46).
In line with these observations, a similar phenomenon was observed for other two enzymes that, together with SHMT1, participate to the thymidylate cycle. Indeed, it was demonstrated that human thymidylate synthase (TYMS) and dihydrofolate reductase (DHFR) can bind to the coding region of their mRNA
in vitro, repressing their translation (47, 48). Therefore for all the three enzyme
it has been proposed a mechanism of post-transcriptional autoregulation; however, since all the mentioned studies were performed in vitro, a physiological characterization of such interactions ex vivo or in vivo is still missing.
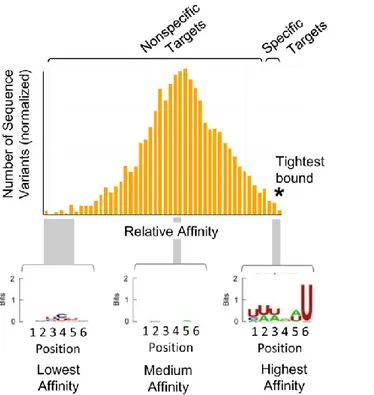
It may seem weird to notice that in the paper mentioned above SHMT1 was shown to have non-specific RNA binding properties, since it was able to bind also to luciferase mRNA (46). Although the terms “specific” and “non-specific” are widely used, the specificity, or the lack thereof, is a considerably more nuanced problem than suggested by this binary classification (49). In fact it’s common to see in vitro RBPs bound to random RNA sequences, and the same phenomenon has been observed also for DNA binding proteins (DBPs) (50). To better describe the entire spectrum of the existing affinities for a given DNA or RNA binding protein it is useful to employ the affinity distributions, i.e. the distribution of affinities of a DBP or an RBP for all the substrate variants in vitro (Fig. 9).
21
Figure 9. Affinity distribution of an RBP (C5 from E.coli) with a binding site for 6 nucleotides. Histogram of relative affinities (log scale) for 4096 sequence variants (all the possible combinations made of 6 nucleotides). Relative affinities are calculated in relation to a standard variant, which can be chosen freely. “Specific” RNA targets are marked by the asterisk and cluster in the high affinity region of the distribution, producing a binding consensus sequence, shown as a logo underneath the plot. The remainder of the distribution consists of “non-specific” RNA variants, which do not produce a consensus motif. The picture is taken from (49).
For proteins with canonical specificity, cellular substrates appear to fall mainly into the high affinity region of the affinity distribution (tail), instead the so called non-specific nucleic acid binding proteins have physiological substrates which fall in a distinct part of the affinity distribution (near the median). In other words, this means that a considerable fraction of nucleic acid binding proteins could potentially bind a wide array of different sequences in vitro, but
22 physiological targets.
The interaction between a protein and a RNA/DNA sequence in the cell is dictated by multiple factors: the affinity of the protein for the RNA/DNA site, the concentration of the protein, the RNA or DNA accessibility, the competition from other sequences for the binding site, the need for additional interacting partners, the metabolic control of the interaction and so on.
Indirect evidences led to hypothesize that SHMT1 could be able to bind to the DNA as well. As mentioned in Paragraph 1.3, SHMT1 has been found to localize into the nucleus in the S phase of the cell cycle and, interestingly, TYMS and DHFR display the same behavior. Small scale tandem purification experiments have shown that nuclear TYMS and DHFR coprecipitate with SHMT1, but only when the DNA is intact (32). Moreover, among SHMT1 nuclear interacting partners, several proteins involved in the DNA replication machinery such as proliferating cell nuclear antigen (PCNA), replication factor C activator 1 (RFC1) and DNA polymerases ε and δ have been found and, interestingly, there are preliminary evidences which suggest the enrichment of SHMT1 on the mammalian origins of replication (32, 33).
All these evidences support the idea that a ternary complex formed by the enzymes of the thymidylate cycle (SHMT1-TYMS-DHFR) may exist and it may localize on specific DNA sites thanks to the DNA binding capability of SHMT1, probably in order to localize de novo thymidylate biosynthesis at the sites of DNA synthesis.
It may seem unusual to find a protein that binds to both nucleic acids, as RNA and DNA binding are typically considered distinct functions and thus studied as different properties. However, the consideration of the DNA and RNA binding functions within proteins as separate entities is becoming outdated, since a lot of DNA and RNA binding proteins have recently been characterized
23
(namely DRBPs): these proteins bind to DNA and RNA through a mutual exclusive mechanism or simultaneously (51, 52).
1.6 Aim of the thesis
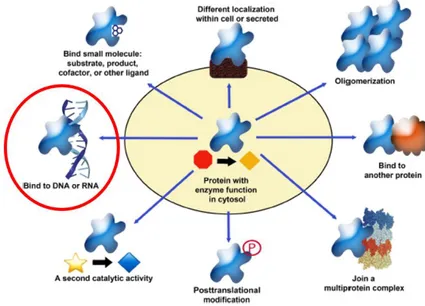
It has become evident that SHMT1 is a multitasking protein subjected to a complex regulation which can vary in different cellular milieu and/or metabolic conditions.
Among the multiple properties of SHMT1, the present thesis aims to focus on the RNA and DNA binding activity (Fig. 10). We are facing two moonlighting functions that need a deep biochemical, molecular and cellular characterization to understand their physiological and/or pathological relevance inside the cell, to date unknown.
Figure 10. Schematic representation of the multiple properties of human cytosolic serine hydroxymethytransferase (SHMT1), the subject of the present thesis is circled in red.
24
In such background, the present work firstly investigates the molecular mechanism at the basis of the crosstalk between SHMT isozymes observed by us in lung cancer cells, understanding if it is mediated by the moonlighting RNA binding activity of SHMT1.
The second goal is a deep biochemical and molecular characterization of the SHMT1-RNA interaction focused on: (i) the discovery of the non-canonical RNA binding domain, (ii) the effects of the SHMT1-RNA interaction on the catalytic activity of the enzyme and (iii) the metabolic effects of such interaction in lung cancer cell lines. In addition, to understand the biological meaning of the moonlighting activity of SHMT1, as well as why the protein has evolved such capacity, this work tries to go deeper into the discovery of all the sequence variants bound, and so potentially regulated, by the cytosolic isozyme in lung cancer models, in this way widening the knowledge on lung cancer metabolic regulation.
In parallel, the present thesis aims to shed light also on the DNA binding properties of SHMT1, mainly focusing on the biochemical characterization of such activity together with the analysis of the DNA sequence variants bound by the protein.
Overall the present work fits well in the emerging network which interconnects intermediary metabolism, gene transcription and gene expression through its main players: metabolic enzymes, nucleic acids and metabolites.
25
2. Materials and Methods
2.1 Analysis of SHMT1-nucleic acids interaction
2.1.1 Protein expression and purification
Wild-type SHMT gene was cloned into a pET22b(+) vector (Novagen) and expressed as N-terminal histidine-tagged fused protein in Escherichia coli (BL21-DE3). Mutant SHMT constructs were obtained by site-directed mutagenesis of the WT gene (see section 2.1.2). Bacterial cultures were grown at 37 °C in Luria-Bertani (LB) liquid medium supplemented with 30 μg/ml kanamycin. When OD600 reached about 0.8, the temperature was lowered to 22
°C and the protein expression was induced by adding 0.1mM IPTG (isopropyl Βd-thiogalactoside). Cells were harvested 20 hours later by centrifugation and stored at -20 °C. Bacterial pellets were then resuspended in lysis buffer (see Table 1) and lysed by sonication. After centrifugation, the soluble protein was purified by affinity chromatography on a 5 ml HP-chelating column (GE Healthcare) loaded with nickel ions equilibrated with buffer A (see Table 1). The elution was carried out with an imidazole gradient, SHMT proteins were eluted with 300 mM imidazole. Fractions containing pure protein were pooled, and imidazole was removed with desalting columns PD10 (GE Healthcare), the histidine tag was then removed by proteolytic digestion with 1U/mg of thrombin at 16 ℃ for 15 h. The digestion mix was then loaded again on the HP-chelating column and thrombin was eluted in the flow thought, whereas SHMT, which now binds with low affinity, was eluted with 100 mM imidazole. The protein was then concentrated and injected into a Superdex 200
26
column (either 10/300 or 16/600; GE Healthcare) and eluted with buffer A.
Table 1. Buffers utilized in the purification of SHMT1 (WT and mutants).
*The purification of SHMT1 K157S/K158S was carried out with 200 mM NaCl.
Protein concentration was determined measuring the absorbance at 280 nm and applying the Beer-Lambert law (SHMT1
ε
280 47565 M-1cm-1). Samples weresnap freezed and stored at -20 ℃.
2.1.2 Site-directed mutagenesis
SHMT mutants were produced by site-directed mutagenesis using the QuikChange Lightning Site-Directed Mutagenesis Kit (Agilent Technologies). The pET28b vector containing the wild-type SHMT1 gene was used as template DNA. Two complementary oligonucleotides, synthesized by Metabion (Steinkirchen, Germany), were used as primers for the mutagenesis reactions (primers listed in Table 2). The DNA was then transformed in
Escherichia coli Neb5α cells for amplification, plasmids were purified with
QIAprep Spin Miniprep kit (Qiagen). Mutagenesis was then verified by sequencing.
Lysis Buffer 20 mM Hepes, 100 mM NaCl, 5% glycerol, 1 mM PMSF
27
Table 2. Primers used in the mutagenesis reactions (written 5' to 3').
2.1.3 In vitro transcription and RNA biotinylation
pGL3 plasmids (pGL3 Control) containing the specific UTRs cloned upstream of the luciferase gene were provided by GeneArt/Invitrogen (Ratisbonne, Germany).
UTR sequences were amplified by polymerase chain reaction (PCR) from pGL3 plasmids using primers designed to include the T7 promoter sequence upstream of the UTR in the PCR product (Table 3). PCR products were run on a 1% agarose gel in 1x TAE buffer (Tris-Acetic acid-EDTA) and then purified using the Nucleospin Gel and PCR Clean-up Kit (Macherey-Nagel). The DNA fragments generated with this process were used as templates to produce the corresponding RNA sequences with the Ribomax Large Scale RNA Production System-T7 Kit (Promega). The RNA was purified according to the manufacturer instructions.
The UTR sequences were labelled at the 3' end with a molecule of cytidine-5'-phosphate-3'-(6-aminohexyl)phosphate labelled with biotin (pCp-biotin) using the PierceTM RNA 3'End Biotinylation Kit (Thermo Scientific) and purified according to the manufacturer instructions.
SHMT1 K157S/K158S Fw ccatgggttcatgacagacagcagcaaaatctctgccacgtccatc Rv gatggacgtggcagagattttgctgctgtctgtcatgaacccatggg SHMT1 Y82A Fw ggtacccgggccagagagcctatggcgggact Rv agtcccgccataggctctctggcccgggtacc
28
Table 3. Primers used in the PCR reactions (written 5' to 3'), the forward primers contain the T7 promoter sequence at the 5' terminal.
2.1.4 Electrophoretic mobility shift assay (EMSA)
Gel mobility shift assays were conducted by incubating a fixed amount of RNA or DNA with fixed or increasing concentrations of recombinant human SHMT1. For competition assays increasing concentrations of unlabeled competitors UTRs were added to the reaction mixture. To determine the effect of metabolites upon RNA binding, the enzyme was pre-incubated with an excess of serine or glycine and 5-CHO-THF-Glun (monoglutamylated: (6S)-5-formyl tetrahydrofolate and pentaglutamylated: (6R,S)-5-(6S)-5-formyl-5,6,7,8- (6R,S)-5-formyl-5,6,7,8-tetrahydropteroypenta-γ-L-glutamic acid lithium salt) for 5 minutes at room temperature, the latter being a substrate analogue stable in an oxidative environment.
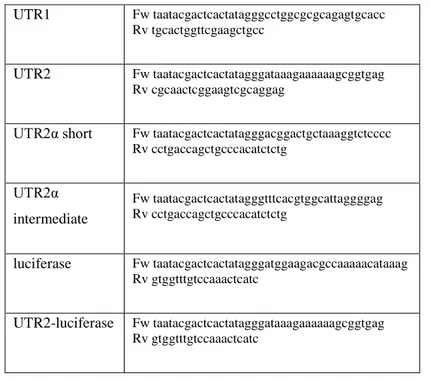
UTR1 Fw taatacgactcactatagggcctggcgcgcagagtgcacc Rv tgcactggttcgaagctgcc
UTR2 Fw taatacgactcactatagggataaagaaaaaagcggtgag Rv cgcaactcggaagtcgcaggag
UTR2α short Fw taatacgactcactatagggacggactgctaaaggtctcccc Rv cctgaccagctgcccacatctctg UTR2α intermediate Fw taatacgactcactatagggtttcacgtggcattaggggag Rv cctgaccagctgcccacatctctg luciferase Fw taatacgactcactatagggatggaagacgccaaaaacataaag Rv gtggtttgtccaaactcatc UTR2-luciferase Fw taatacgactcactatagggataaagaaaaaagcggtgag Rv gtggtttgtccaaactcatc
29
All the components were incubated at room temperature for 30 minutes in 12 μl of binding buffer (20 mM HEPES pH 7.4, 100 mM NaCl) containing 20 μg/ml bovine serum albumin (BSA), 1 μg of tRNA, 1 U/μl of recombinant Rnasin ribonuclease Inhibitor and 8% (v/v) glycerol. The reaction mixtures were separated onto 4% nondenaturing polyacrylamide gels in 0.5× TBE buffer (45 mM Tris-Borate, 1 mM ethylenediaminetetraacetic acid pH 8.6). For the visualization of unlabeled sequences, gels were stained with SYBR Safe (Invitrogen) in 30 ml of 0.5× TBE. To detect biotin labelled RNA, gels were transferred onto Immobilon-Ny+ positive charged nylon membranes (0.45 μm) in 0.5× TBE, the RNA was then crosslinked to the membrane using a hand-held UV lamp equipped with 314 nm bulbs. The biotin moiety was detected by chemiluminescence using the Chemiluminescent Nucleic Acid Detection Module (Thermo Scientific). In both experiments, images were acquired using Chemidoc MP Imaging System (Bio-Rad). Densitometric measurements of the free RNA bands were transformed into percentages, the amount of bound RNA (% bound) was then calculated by subtracting the percentage of free RNA from the total, the result was plotted as a function of protein concentration. The apparent dissociation constants (Kdapp) were estimated fitting the data with Equation 1, in which Bmax corresponds to the maximum binding (100%) and [P] corresponds to the concentration of SHMT1 in the reaction mixture. All experiments were run in triplicate.
Equation 1
% 𝐵𝑜𝑢𝑛𝑑 = 𝐵𝑚𝑎𝑥[𝑃] 𝐾𝑑+ [𝑃]
30 2.1.5 RNA Immunoprecipitation (RIP)
Cells were grown in complete RPMI-1640 medium (see section 2.3.1) and harvested at 80% of confluence spinning at 1000 rpm for 5 minutes at 4 ℃, pellets were then snap freezed and stored at -80 ℃.
Each pellet was lysated in 1 mL of RIP lysis buffer (25 mM Tris-HCl pH 7.4, 150 mM NaCl, 5 mM EDTA, 0.5% NP40, 1mM DTT and 100U/ml Ribolock Rnase Inhibitor), 10 U of TURBO Dnase (Invitrogen) were added to each lysate to avoid DNA contamination. Cellular debris were removed by centrifugation and protein quantification was carried out following the absorbance at 280 nm. In parallel, 2 μg of antibody, either mouse monoclonal anti-SHMT1 purchased from Santa Cruz Biotechnology (Santa Cruz, CA, USA) or mouse polyclonal IgG (Sigma), were conjugated to 100 μl of Protein G Dynabeads (Invitrogen), rotating for 1 hour at 4℃. The immunoprecipitation was performed incubating 500 μg of protein lysate with the beads conjugated to the antibody, rotating the samples o/n at 4 ℃.
Three stringent washing were performed the day after with RIP wash buffer (25 mM Tris-HCl pH 7.4, 150 NaCl, 5 mM EDTA, 1 mM DTT and 0.5% NP40) followed by one last wash in phosphate saline buffer (PBS). The beads were then resuspended in 1 ml of QIAzol reagent (Qiagen) and processed according to the manufacturer instructions to extract RNA.
One part of the extracted RNA was used to prepare libraries suitable for next generation sequencing (see next paragraph).
On the other hand, to assess the enrichment of the SHMT2 mRNA, the same volume of each sample (8 μl) was retrotranscribed with NZY First-Strand synthesis kit (Nzytech) following the manufacturer instructions.
31
PCR using NZYTaq II 2x Green Master Mix (Nzytech) according to the manufacturer instructions.
2.1.6 Libraries preparation for next generation sequencing (NGS)
To sequence all the RNAs recovered with the RNA Immunoprecipitation (RIP-Seq) it is necessary to generate a library of cDNAs having adaptor sequences containing indexes suitable for sequencing. For this purpose it was used the TrueSeq RNA Library Prep Kit v2 provided by Illumina (San Diego, CA, USA), the libraries preparation was performed according to the manufacturer instructions. The libraries quality control was done with Agilent 2100 Bioanalyzer using a DNA-specific chip (Agilent DNA 1000).
2.2 Analysis of SHMT1 enzymatic activity
2.2.1 In vitro enzymatic assays
All assays were carried out at 30 °C in 20 mM KPi buffer at pH 7.2, when working with RNA the buffer was treated with diethyl pyrocarbonate (DEPC). The serine cleavage reaction was measured using 0.2 μM enzyme with L-serine and THF as substrates by means of a spectrophotometric coupled assay, in which the 5,10-CH2-THF produced by the reaction was oxidized by the NAD-dependent E. coli 5,10-CH2-tetrahydrofolate dehydrogenase (53). The possible inhibition of methylenetetrahydrofolate dehydrogenase by RNA was checked in an experiment in which the activity of the enzyme (1 μM) with 50 μM 5,10-CH2-THF and 250 μM NADP₊ was measured in the presence and absence of tRNA and UTR2. No inhibition was observed under these
32 conditions.
Two assays were used to analyze the inverse reaction. The first assay uses glycine and 5-CHO-THF as substrates and is based on the spectrophotometric measurement of the quinonoid intermediate that develops when both ligands bind to SHMT, forming an enzyme–glycine–folate ternary complex. The quinonoid intermediate, which yields an intense absorption band with a maximum at 502 nm, derives from deprotonation of glycine, but it accumulates to a measurable extent only when a folate ligand is also bound to SHMT and a ternary complex is formed (54). Therefore, the absorbance at 502 nm is proportional to the fraction of enzyme present as the ternary complex. The second assay is a coupled assay carried out in the presence of 5,10-CH2-THF
and glycine substrates. The L-serine product of this reaction is oxidized by a NAD₊-dependent serine dehydrogenase.
The inhibition curves were obtained keeping fixed concentration of substrates (10 mM glycine, 10 mM L-serine, 5 μM 5-CHO-THF and 80 μM THF, 90 μM 5,10-CH2-THF) while varying the RNA concentration. All obtained inhibition curves were fitted to Equation 2, in which [I] corresponds to the RNA concentration.
Equation 2
%𝐴𝑐𝑡𝑖𝑣𝑖𝑡𝑦 = 100 (1 − [𝐼] [𝐼] + 𝐼𝐶50
)
The characterization of the tRNA inhibition mechanism was carried out using serine and THF as substrates. In a first series of experiments, L-serine concentration was held constant at 10 mM, while THF was varied between 10 and 488 μM. The single saturation curves obtained varying THF at various
33
RNA concentrations were fitted to a modified Michaelis–Menten equation that accounts for substrate inhibition (Equation 3).
Equation 3
𝑣𝑖= 𝑣𝑚𝑎𝑥
[𝑇𝐻𝐹]
𝐾𝑚+ [𝑇𝐻𝐹] (1 +[𝑇𝐻𝐹]𝐾𝑖 𝑇𝐻𝐹)
Moreover, all the saturation curves were globally fitted to a modified Michaelis–Menten equation that accounts for both substrate inhibition and hyperbolic competitive inhibition (Equation 4).
Equation 4 𝑣𝑖= 𝑣𝑚𝑎𝑥 [𝑇𝐻𝐹] 𝐾𝑚( 1 +[𝑡𝑅𝑁𝐴]𝐾 𝑖 1 +[𝑡𝑅𝑁𝐴]𝛼𝐾 𝑖 ) + [𝑇𝐻𝐹] (1 +[𝑇𝐻𝐹]𝐾𝑖 𝑇𝐻𝐹)
In these equations, vi stands for initial velocity, Vmax is the maximum velocity,
Km is the Michaelis–Menten constant for THF, KiTHF is the substrate inhibition
constant, Ki is the RNA inhibition constant and α is the factor by which Ki
changes when THF is bound to the enzyme. In a second series of experiments, THF concentration was held constant at 80 μM, while L-serine was varied between 0.156 and 10 mM. The saturation curves obtained were fitted to a Michaelis–Menten equation.
All spectrophotometric measurements were performed using a Hewlett-Packard 8453 diode-array spectrophotometer. Fitting of data to equations was
34
carried out with the PRISM software (GraphPad, La Jolla, CA, USA).
2.2.2 Enzymatic assays in living cells
SHMT activity measurements in living cells were performed using a radioisotope assay based on the capability of SHMT to catalyze the exchange of the pro-2S proton of glycine with solvent (55, 56). After 24 hours from transfection, H1299 cells were harvested using trypsin and washed twice with 2 ml of PBS buffer to eliminate growth medium. Aliquots (100 μl) of cells suspension were incubated with [2−3H]glycine (2 × 10⁹ dpm mol⁻1) (23 μM)
for 4 hours at 37 ℃ . Subsequently, samples were centrifuged to remove the cells and reactions were stopped by the addition of 3% (w/v) trichloroacetic acid to remove radiolabeled glycine and measure radioactivity in the solvent. Control reactions were performed to correct for background exchange (these samples did not contain cells). All measurements were performed in duplicate and were normalized on the protein concentration.
2.3 Analysis of the cellular effects of SHMT1-RNA interaction
2.3.1 Cell lines
H1299 and A549 cancer cells were grown in RPMI-1640 medium supplemented with 2 mM L-glutamine, 100 IU/ml penicillin/streptomycin and 10% fetal bovine serum (FBS; Biowest USA). HAP1shmt2KO cells were obtained from Horizon Discovery Ltd., Cambridge, UK and maintained in IMDM medium (Gibco) supplemented with 100 IU/ml penicillin/streptomycin and 10% FBS (Biowest USA). The composition of the minimal medium
35
(MEM) is the following: Minimum Essential Medium Eagle (Sigma-Aldrich) supplemented with 1X MEM Vitamin Solution, 2 mM L-glutamine, 25 mM glucose, 10% fetal bovine serum dialyzed, 100 IU/ml penicillin/streptomycin; the supplements for the specific media are 0.4 mM serine, 0.4 mM glycine and 0.5 mM formate.
2.3.2 Cells transfection
H1299 and HAP1-SHMT2KO cells were transiently transfected with interference RNA sequences or DNA plasmids. In detail, 1x10⁵ cells were seeded and simultaneously incubated for 18 hours with the following components:
- Qiagen AllStars RNAi Controls (scrambled sequences),
- shmt1 siRNA sequences (1_6 CTGCTGTAAATCAGAAGTGTA, 1_7 CTGACGGAGCTGGGCTACAAA, 1_8 CTCCCGTAATCAGGAA GCCAA),
- shmt2 siRNA sequences (2_6 CAGGCGCAGCAAATTCAATTT, 2_7 CCGGGAGATCCCTTACACATT, 2_10
CCCAGCCAACCTGGCCGTCTA) (GeneSolution, Qiagen) - pGL3 plasmids.
For the rescue experiments, 24 hours after the transfection, the medium was replaced with fresh medium containing the specified supplementations. For the fluorescent microscopy experiments, 1x10⁵ cells were seeded and transfected with 1 μg of SHMT1-GFP plasmid. The transfection medium was replaced with complete medium after 12 hours. The fluorescent signal was detected 24 hours after the transfection using an AXIO vert.A1 fluorescence
36
Zeiss microscope (Carl Zeiss Microscopy, Switzerland).
In all the set of experiments, JetPrime (Polyplus-transfection® SA) was used as transfection reagent following the manufacturer instructions.
2.3.3 RNA extraction and real-time qRT-PCR analysis
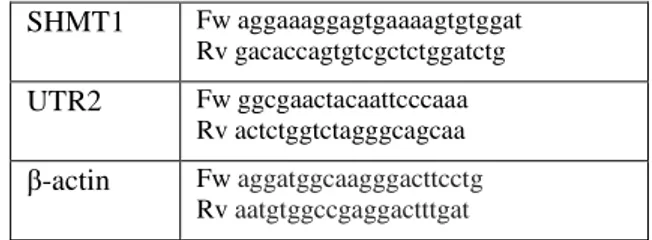
Total RNA was extracted from cells using TRIzol reagent (Invitrogen) following the manufacturer instructions. Reverse transcription reactions were performed on 1 μg of total RNA with SuperScript First-Strand Synthesis System Kit (Invitrogen). The obtained complementary DNA was used for the subsequent real-time PCR reaction: each PCR well contained 5 μl 2× KAPA Sybr Fast universal premix, 0.4 μl of forward and reverse primer, 1 μl cDNA (1:5 diluted) and 3.2 μl water (final volume 10 μl). Reactions were performed using Stratagene MX3000P (Stratagene, La Jolla, CA, USA). Each sample was analyzed in triplicate. Primer sequences are shown in Table 4.
Table 4. Primers used in the Real Time qRT-PCR analysis (written 5' to 3').
2.3.4 Ex vivo and in vitro luciferase assays
Ex vivo luciferase activity was determined after transfecting the pGL3
plasmids into the H1299 cells. Cells were cotransfected with 0.5 μg Renilla luciferase plasmid as control of transfection together with 1 μg of the pGL3, pGL3-UTR2 or pGL3-UTR1 plasmid plus scrambled RNA sequences or the
SHMT1 Fw aggaaaggagtgaaaagtgtggat Rv gacaccagtgtcgctctggatctg UTR2 Fw ggcgaactacaattcccaaa Rv actctggtctagggcagcaa β-actin Fw aggatggcaagggacttcctg Rv aatgtggccgaggactttgat
37
specific interference RNA (iRNA) against shmt1. The expression of Firefly and Renilla luciferases was analyzed 48 hours after transfection using the Dual-Luciferase® Reporter Assay System (Promega) in a VICTOR™ Multilabel Counter (Perkin Elmer, USA). Firefly luciferase was standardized to the value of Renilla.
In vitro, translation was measured as the synthesis of luciferase protein from
the corresponding mRNAs using Flexi Rabbit Reticulocytes Lysate System kit (Promega). The mRNAs employed in the in vitro translation assays were produced from pGL3 plasmids as described in section 2.1.3 using the primers listed in Table 3. The luciferase mRNA with or without the upstream UTR2 sequence was heated 3 minutes at 65°C and immediately cooled down in an ice-water bath. The transcripts were incubated 5 minutes at room temperature with SHMT1 in presence of recombinant Rnasin Ribonuclease Inhibitor (40 U); the other reaction components were then added to obtain a final mixture containing 125 ng RNA, 0.6 μM SHMT1, 17.5 μl rabbit reticulocyte lysate, 20 μM amino acid mixture and 70 mM KCl. The translation reactions were incubated 30 minutes at 30°C and then stopped in ice. Luminescence was detected according to the manufacturer’s protocol using VICTOR™ Multilabel Counter (Perkin Elmer, USA) equipped with 96 well plate reader.
2.3.5 Serine consumption assay
Sample extraction and derivatization. Serine was analyzed according to the method of Gao et al. (57) with slight modifications. Cells transfected as indicated were cultured in MEM originally supplemented as described before and specifically with 400 μM serine. After 48 hours, cells were harvested and
38
centrifuged to eliminate cellular debris. Then, 450 μl cell culture medium was spiked with 20 μl of 0.7 mM 2-(4-chlorophenyl)ethylamine as an internal standard. The first step of derivatization was performed by adding 350 μl of ethanol/pyridine (6:1) and 50 μl of ECF. The reaction mixture was then vortexed for 30 seconds and ultrasonicated for 60 seconds to increase the speed of reaction at room temperature. The derivatization products were extracted with 700 μl of n-hexane for 60 seconds and centrifuged for 5 minutes at 3000 rpm. The organic layer was removed and the aqueous phase was adjusted to pH ≥12 with 0.1 ml 7M NaOH. The second derivatization step was performed by adding a further 50 μl of ECF and 700 μl of n-hexane. The reaction mixture was again vortexed and ultrasonicated as before, and then centrifuged at 3000 rpm for 10 minutes. The organic layers were combined, dried under N2, resuspended in dichloromethane and analyzed by GC/MS gascromatography-mass spectrometry (GC/MS).
GC-M analysis was performed using an Agilent 6850A gas chromatograph coupled to a 5973N quadrupole mass selective detector (Agilent Technologies, Palo Alto, CA, USA). Chromatographic separations were carried out with an Agilent HP5ms fused-silica capillary column (30 m × 0.25 mm i.d.) coated with 5%-phenyl-95%-dimethylpolysiloxane (film thickness 0.25 μm) as stationary phase as follows: injection mode: splitless at a temperature of 280℃; column temperature program: 80 ℃ (2 minutes) ramped to 140 ℃ at a rate of 10 ℃/min, to 240 ℃ at a rate of 4 ℃/min, to 280 ℃ at a rate of 10 ℃/min and held for 5 min. The carrier gas was helium at a constant flow of 1.0 ml/min. The spectra were obtained in the electron impact mode at 70 eV ionization energy; ion source 280℃; ion source vacuum 10⁻⁵ Torr.
MS analysis was performed simultaneously in TIC (mass range scan from 50 to 600 m/z at a rate of 0.42 scans/s) and SIM mode. GC-SIM-MS analysis was
39
performed selecting the following ions: 102 m/z for glycine, 114 m/z for serine and 227 m/z for 2-(4-chlorophenyl)ethylamine (internal standard).
2.4 Statistical analysis
The mean and the standard deviation of data are computed from at least three independent biological experiments, each repeated in three technical replicates. Paired samples of real time PCR, in vitro translation and RIP experiments were analyzed with the two tailed Student’s t-test; all the others statistical analyses were performed using one-way ANOVA followed by the
Bonferroni post-hoc comparison test. A p-value < 0.05 was considered
40
3. Results
3.1 Expression of SHMT transcripts in lung cancer
There are many examples of regulatory proteins and enzymes interacting with the 5' untranslated regions of messenger RNAs (5'UTRs) (58). Notably, also the mechanism of SHMT1 autoregulation has been shown to be mediated by a 5'UTR sequence (see section 1.5). For these reasons, we raised the hypothesis that the post-transcriptional regulation of SHMT2 may involve a direct interaction between SHMT1 and the 5'UTR of the SHMT2 transcripts. To choose the candidate 5'UTRs to employ in the in vitro assays we performed, in collaboration with Prof. Alessandro Paiardini (Sapienza University of Rome), an analysis of the expression of SHMT transcripts in samples of lung adenocarcinoma (LUAD) cell lines, obtained from the TCGA database (59). Several transcripts arising from the shmt1 or the shmt2 gene were identified, and a representative pool of differently expressed 5'UTR sequences was chosen (the transcripts with the corresponding 5'UTRs are listed in Table 5). We selected three SHMT2 transcripts (one encoding the SHMT2 isoform and the other two encoding the SHMT2α isoform) and two SHMT1 transcripts, the latter two share the same 5'UTR. The features of the chosen 5'UTR sequences employed in the binding experiments reported in the next paragraph, respectively named UTR2, UTR2αint, UTR2αsh and UTR1, are shown in Figure 11.
41
Table 5. Expression of the SHMT1 and SHMT2 transcripts selected for this study in Healthy (H) and LUAD (T) cells.
Isoforms* TPM Percentage
Healthy Tumor Healthy Tumor
SHMT1 (Gene: ENSG00000176974) NM_004169a (uc002gta.3) 5'UTR 191nt 13.9 14.8 73.9% 67.9% NM_148918a (uc002gtb.3) 5'UTR 191nt 3.2 4.8 17.1% 22.1% SHMT2 (Gene: ENSG00000182199) NM_005412 (uc001snf.2) 5'UTR 205nt 26.5 63.1 95.9% 92.5% NM_001166358 (uc001sni.2) 5'UTR 230nt 0.3 2.4 1.1% 3.5% NM_001166359 (uc010srh.2) 5'UTR 123nt <0.01 <0.01 - - TPM: Transcripts-per-million.
aThe two SHMT1 transcripts share the same 5'UTR.
*Minor SHMT1 isoforms - uc002gtc.1:H, 0.2; 1.3% / T, 0.5; 2.0% - uc002gtd.1:H, 0.9; 5% / T, 0.8; 3.9% - uc002gsz.3:H, 0.4; 2.1% / T, 0.7; 3.4% -uc010vxu.1:H, 0.1; 0.6% / T, 0.1; 0.6%. Other minor SHMT2 isoforms - uc001snj.2:H, 0.15; 0.6% / T, 0.7; 1.1% - uc010srj.2:H, -; - / T, 1.2; 1.8% - uc001snh.2: H, 0.7; 2.5% / T, 0.8; 1.1%.
42
Figure 11. Schematic representation of the pre-mRNAs of different SHMT1 and SHMT2 transcripts. Non-coding exons are colored in light blue, coding exons in dark blue and introns are represented as thin light blue lines. The 5'UTR sequences selected for the experiments, composed by the indicated exons, are shown in the insets:
UTR1 = (NM_004169-NM148918: Ex1_21-192+Ex2_1-19). UTR2 =
(NM005412:Ex1_1-205). UTR2αsh = (NM_001166359: Ex1_1-93+Ex2_1-30). UTR2αint = (NM_001166358: Ex1_1-200+Ex2_1-30).
3.2 SHMT1 binds to the 5’UTR of shmt2 transcripts
Electrophoretic mobility shift assays (EMSA) have been employed to assess if SHMT1 is capable to interact in vitro with the selected 5'UTRs. Given the propensity of SHMT1 to bind to multiple unrelated sequence variants (see section 1.5), it was essential to add an excess of tRNA in the experimental setup to eliminate the low-affinity interactions with the UTRs.
In a first set of experiments, the UTRs were incubated with increasing concentrations of SHMT1 (1 - 9.6 μM); as shown in Figure 12, the enzyme is
43
able to retard the migration of all the UTRs except the one of UTR1. Although the lack of binding between SHMT1 and UTR1 may be in contrast with what mentioned in section 1.5 and reported in (46), it’s worth noticing that the experimental setup employed in the present work is far more stringent compared to the one chosen by Liu et al. (46), aiming to unravel only the high affinity interactions.
Figure 12. Electrophoretic mobility shift assays. Migration of 0.24 μM unlabeled UTR2αint (A), UTR1 (C), UTR2 (D) and of 0.08 μM biotin-labeled UTR2αsh (B) in the presence of the indicated concentrations of SHMT1. The labelling of UTR2αsh was necessary to visualize the fragment, since it comigrates with the tRNA (which is cut out of the picture). The protein-RNA complexes visualized in (C), highlighted with a star (*), are composed by SHMT1 and tRNA; densitometric analysis of the UTR1 bands (unbound) confirms that the fragment it is not bound by the protein.
A competition assay was then employed to assess which 5'UTR sequence binds with higher affinity to the protein. At this purpose, UTR2 was biotinylated and
44
incubated with SHMT1 in the presence of two different concentrations of each unlabeled UTR sequence. As shown in Figure 13, UTR2 and UTR2αint were the only fragments that displaced the biotinylated UTR2 from SHMT1, suggesting a stronger binding affinity with respect to UTR2αsh and UTR1.
Figure 13. Competition assay performed by incubating 0.08 μM of biotin-labeled UTR2 with 4.8 μM SHMT1 and, respectively, 0.6 and 1.2 μM of unlabeled competitors (UTR2, UTR2αsh, UTR2αint and UTR1).
SHMT1-UTR2 interaction: post-transcriptional and translational effects
The investigation of the post-transcriptional and translational effects of the SHMT1-UTRs interaction has been focused only on UTR2 binding since, in addition to having an high affinity for the enzyme, it is far more expressed in LUAD cells compared to the other UTRs (Table 5).
At first it was investigated if the presence of SHMT1 is able to modulate the levels of UTR2-containing transcripts. The H1299 cell line was transfected with an RNA interference (RNAi) against SHMT1 (ishmt1) or with a scramble RNA sequence (iscr) and then the expression of UTR2 was studied by qRT-PCR. As shown in Figure 14, SHMT1 knockdown resulted in a significant
45 increase of UTR2 levels.
Then, to evaluate the effects on translation, two luciferase assays were employed. The first one, performed using rabbit reticulocytes extracts, was carried out to evaluate whether the SHMT1 protein is able to affect in vitro
Figure 14. Effect of SHMT1 on UTR2 expression in H1299 lung cancer cells. Expression of shmt1 and UTR2 RNAs, measured by qRT-PCR 48 hours after the transfection with the indicated RNAi (iscr, scrambled RNA sequences or is1, RNAi against shmt1). Statistical analysis is performed on three independent experiments, *P ≤ 0.05 ** P ≤ 0.01.
the translation of the luciferase mRNA cloned downstream of the UTR2 sequence. Results show that SHMT1 inhibits to a greater extent (20%) the luciferase translation when the mRNA is fused to UTR2 (Fig. 15), highlighting a regulative role of the SHMT1-UTR2 interaction on translation.
The second assay was intended to confirm the same phenomenon ex vivo by employing a plasmid containing UTR2 cloned upstream of the firefly luciferase gene.
46
Figure 15. In vitro translation experiments. Translation of luciferase mRNA with (UTR2-luc) or without (luc) the upstream UTR2 sequence was measured in the absence (Control) or presence (Shmt1) of 0.6 μM SHMT1. The results are plotted as the ratio of luminescence units (L.U.) between UTR2-luc and luc samples normalized on control reactions carried out in the absence of SHMT1. Statistical analysis is performed on five independent experiments, *P ≤ 0.05.
Figure 16. Ex vivo translation experiments in H1299 cells. The panel shows the ratio between firefly and renilla luciferase evaluated 48 hours after the transfection with the indicated plasmids (pGL3, empty vector or UTR2, vector containing UTR2) and the indicated RNAi (iscr, scramble sequences or is1, RNAi against shmt1). Statistical analysis is performed on three independent experiments, *P ≤ 0.05.
47
A significant increase (5-fold) in the luciferase signal was observed only in those cells co-transfected with the UTR2-containing plasmid and ishmt1 (Fig. 16). These data demonstrate that in the H1299 lung cancer line the presence of SHMT1 reduces the luciferase expression only when the latter is controlled by UTR2, the results confirm that SHMT1 affects the translation of UTR2-containing transcripts also in the cellular system.
3.4 Modulation of the RNA binding through SHMT substrates
To investigate the relationship between the catalytic and the RNA binding activity of SHMT1, we started by assessing if the binding of substrates could interfere with RNA binding. EMSA assays were carried out in the presence of SHMT substrates and/or analogues: the protein was incubated with its amino acid and/or folate substrates prior to the addition of UTR2. As shown in Fig. 17A, pentaglutamylated 5-formyl-tetrahydrofolate (5-CHO-THF-Glu5)
competes with the formation of the RNA-protein complex in a concentration dependent manner. The presence of saturating concentrations of glycine in the reaction mixture significantly lowers the minimal folate concentration needed to compete with UTR2 (Fig. 17B). The latter phenomenon is due to the higher affinity of the folate moiety for the enzyme-glycine complex than for the free enzyme (54). Interestingly, even at the highest folate concentration, the RNA moiety was not fully displaced. Being the polyglutamylated folate binding stoichiometry 0.5 per subunit (2 per tetramer) (60, 61), and assuming that the RNA randomly binds to each monomer, it is likely that the folate-mediated displacement affects only two subunits and thus that at least 50% of UTR2 remains bound to the other sites (Fig.18), in accordance with our data.
48
Figure 17. Effect of SHMT substrates and/or analogues on UTR2-SHMT1 interaction. EMSA carried out by incubating 5.4 μM of SHMT1 with the indicated amounts of 5-CHO-THF-Glu5 in absence (A) or presence (B) of 10 mM glycine prior to the addition of 0.18 μM unlabeled UTR2. Panel C shows the effect of glycine concentration on the folate-mediated displacement of UTR2. In the latter case, EMSA was performed incubating 5.4 μM of SHMT1 with the indicated amounts of glycine and a fixed concentration of 5-CHO-THF-Glu5 (27 μM) prior to the addition of 0.18 μM unlabeled UTR2.
To further confirm the essential role of glycine in the competition between folate and RNA, glycine concentration was varied from 0.1 to 10 mM while maintaining a fixed concentration of 5-CHO-THF-Glu5. As expected, the