Alma Mater Studiorum - Università di Bologna
SCUOLA DI SCIENZE
Dipartimento di Chimica Industriale “Toso Montanari”
Corso di Laurea Magistrale in
Chimica Industriale
Classe LM-71 - Scienze e Tecnologie della Chimica Industriale
Towards NIR emission: 2-(1H-tetrazol-1-yl)pyridine as
versatile ligand for the synthesis of two new families
of cationic and neutral Ir(III) complexes
Tesi di laurea sperimentale
CANDIDATO
Dmitry Tungulin
RELATORE
Prof. Letizia Sambri
CORRELATORI
Dr. Elia Matteucci
Dr. Filippo Monti
Sessione II ________________________________________________________________________________________________________________________ Anno Accademico 2015-2016 ________________________________________________________________________________________________________________________Index
Abstract ... 1
Introduction ... 2
1. Luminescence ... 2
2. LED/OLED ... 5
3. NIR (Near Infrared) ... 8
4. Why Iridium? ... 9
5. Tuning the emission ... 12
Purpose of the work ... 16
Results and discussion ... 18
1. Synthesis of cyclometalating ligands ... 18
2. Synthesis of Ir(III) dimers ... 20
3. Synthesis of 2-(1H-tetrazol-1-yl)pyridine ... 21
4. Synthesis of cationic Ir(III) complexes ... 25
5. Synthesis of neutral Ir(III) complexes ... 30
6. Photophysical characterization ... 36
Conclusions ... 41
Experimental section ... 42
1. Materials and methods ... 42
2. Synthesis ... 43
2.1. Synthesis of ligands ... 43
2.2. Synthesis of Ir(III) dimers ... 45
2.3. Synthesis cationic Ir(III) complexes ... 47
2.4. Synthesis neutral Ir(III) complexes ... 50
3. Spectroscopic methods ... 52
4. Computational details ... 53
1
Abstract
In the last decades, cyclometalated Ir(III) complexes have drawn a large interest for their unique properties: they are excellent triplet state emitters, thus the emission is phosphorescent in nature; typically high quantum yields and good stability make them good candidates for luminescent materials. Moreover, through an opportune choice of the ligands, it is possible to tune the emission along the whole visible spectra. Thanks to these interesting features, Ir(III) complexes have found different applications in several areas of applied science, from OLEDs to bioimaging. In particular, regarding the second application, a remarkable red-shift in the emission is required, in order to minimize the problem of the tissue penetration and the possible damages for the organisms.
With the aim of synthesizing a new family of NIR emitting Ir(III) complexes, we envisaged the possibility to use for the first time 2-(1H-tetrazol-1-yl)pyridine as bidentate ligand able to provide the required red-shift of the emission of the final complexes.
Exploiting the versatility of the ligand, I prepared two different families of heteroleptic Ir(III) complexes. In detail, in the first case the 2-(1H-tetrazol-1-yl)pyridine was used as bis-chelating N^N ligand, leading to cationic complexes, while in the second case it was used as cyclometalating C^N ligand, giving neutral complexes.
The structures of the prepared molecules have been characterised by NMR spectroscopy and mass spectrometry. Moreover, the neutral complexes’ emissive properties have been measured: emission spectra have been recorded in solution at both room temperature and 77K, as well as in PMMA matrix. DFT calculation has then been performed and the obtained results have been compared to experimental ones.
2
Introduction
1. Luminescence
The term Luminescence (Lichetereggung in German) was firstly introduced by a German physics, Eilhard Wiedemann, in 1888. This phenomenon consists in the emission of light from an excited compound.
In general, when a molecule absorbs energy it is promoted to an excited state, from which it returns to the ground state releasing energy, in most cases in the form of heat. However, in some cases, the release of the absorbed energy can take place through the emission of photons, then luminescence occurs.
Depending on the type of excitation, there could be different types of luminescence:
Chemoluminescence – the emission is the result of a chemical reaction that generates the
product in its excited state; the decay to the ground state occurs releasing photons;
Mechanoluminescence – the emission is generated through any mechanical action on a solid:
in some cases you have to break the bonds (Triboluminescence), in others, just a mild elastic deformation is enough (Piezoluminescence);
Electroluminescence – the emission is generated when an electric current is applied on the
material;
Thermoluminescence – the emission is generated when the material is heated. It is a property
of certain crystalline materials;
Photoluminescence – the emission is generated through the absorption of an electromagnetic
radiation (typically UV-Vis photons); the absorbed energy is released as photons with lower energy.
Among luminescence phenomena, two different processes can be observed:
1) The light emission is immediate, but stops once the source of excitation is turned off.
2) The light emission is not immediate, but persistent, even when the source of excitation is turned off;
3
The first case described is called Fluorescence, while the second is called Phosphorescence. The differences between these two kinds of emission are well described by Jablonski diagram,1
where the energy level of the spin multiplicities are represented. The limits of electronic energy states are represented by bold horizontal lines. The grey horizontal lines are different vibronic energy states.
Figure 1. Jablonski diagram
It is assumed that, at room temperature, almost all of the molecules are situated at the lowest energy level called the Ground State (S0). Absorption of an opportune wavelength can promote
molecules to an electronic excited state (Sn). This state is not stable and the molecules can
follow two deactivation paths: radiative decay (indicated with solid arrows) and non-radiative decay (indicated with dashed arrows).
The non-radiative deactivation consists of three processes:
Vibrational relaxation: the loss of excitation energy through energy transfer to the environment caused by collisions (time ≈ 10-12 s);
Internal conversion: an isoenergetic transition between two electronic states of the same multiplicity (time ≈ 10-13 s);
Intersystem crossing: an isoenergetic transition between two electronic states with different multiplicity (time ≈ 10-8 s).
4
All this processes take place without the emission of photons. On the contrary, the radiative deactivation occurs with an emission of photon and two main processes can be identified for this kind of deactivation:
Fluorescence: a spin-allowed transition from the lowest excited singlet (S1) to the
ground state (S0) (time ≈ 10-9 s);
Phosphorescence: a spin-forbidden transition from the lowest excited triplet (T1) to
the ground sate (S0) (time ≈ 10-6 s);
Several factors may increase the non-radiative decay: for example a high flexibility of the molecular structure, high temperatures, that cause the molecules to move faster and to collide more frequently, or the presence of a solvent, capable of absorbing the energy of excited molecules.
The two kinds of decay are in competition between each other and fluorescence and phosphorescence are not commonly observed, especially in nature.
Concerning radiative decay, once excited with the correct energy, a molecule can be promoted to an excited state (S0 Sn). Through internal conversion it can decay to the lowest excited
state S1, from which it can either relax to S0 with the emission of a photon (fluorescence) or it
can undergo the Intersystem crossing, leading to the population of Triplet state (S1 T1), and
the following relaxation to the ground state S0 (phosphorescence). This latter process goes with
the emission of a photon as well. In order to be competitive the Intersystem crossing should be efficient. The triplet states are situated at lower energy, so the phosphorescence emission occurs at longer wavelength than fluorescence. Furthermore, the transitions between states with different multiplicity are forbidden (T1 S0), so the relaxation time is longer than for the
fluorescence emission. However, the transition became more accessible with the presence of heavy atoms with a big spin-orbit coupling, such as Ir(III) (3909 cm-1). For this reason, transition metal complexes are widely used for luminescent materials.
The luminescent properties of compounds can be measured through various parameters, such as quantum yield and lifetime, together with the emission wavelengths.
The quantum yield (Φ) is a parameter that quantifies the amount of light emitted by a molecule. Basically, it’s the ratio of emitted to absorbed photons. It takes in account two rate constants: the radiative rate constant (kr) and the non-radiative rate constant (knr):2
5
Φ = 𝑘𝑟
𝑘𝑟 + 𝑘𝑛𝑟
While kr is quite clear, knr is trickier: it includes all the competing deactivation paths, such as intra- and intermolecular quenching of vibration energy relaxation.
The average lifetime (τ) a molecule spends in its excited state, before the emission occurs, can be measured as well:
τ = 1
𝑘𝑟 + 𝑘𝑛𝑟
In order to increase the quantum yield, the molecular structure should be rigid, to limit the vibrational relaxation deactivation path as much as possible. Depending on the process, heavy atoms should be used for the promotion of phosphorescence emission. On the other hand, lighter atoms should be used for the fluorescence emission.
2. LED/OLED
Among the plethora of possible applications of luminescent materials, one of the most interesting and most promising field is LEDs/OLEDs technology. The LED (Light-emitting diode) technology started to develop in the beginning of 20th century with the discovery of Electroluminescence. In 1927 the first LED was reported by the hand of a soviet inventor, Oleg Losev.3 However, only with Nick Holonyak Jr., an American inventor, the LED technology started to acquire a practical usage. Holonyak reported the creation of the first red LED in 1962.4 His former student, M. G. Craford invented the first yellow LED in 1971,5 followed by the development of blue LED by H. P. Maruska the next year.6
The LED is a light source which uses semiconductors and electroluminescence to create light. It consists of P-N junction, where “P” is the zone with electron holes, while “N” is a zone rich of electrons. When a suitable voltage is applied, the two zones combine at the junction, releasing photons, as illustrated in Figure 2.
6
Figure 2. LED structure
The first possible application of LEDs is illumination, from street illumination to mobile displays. LEDs have been proven to be more efficient than conventional broad-spectrum light sources, such as metal halide or fluorescent lamps.7 Other advantages are their small mass and volume, solid-state construction, superior safety and longevity. In addition, LEDs can be used as an alternative source for plant biomass production: they can be used as a potential light source for growing plants in the space, where a sufficient quantity and quality of light is fundamental.8 An OLED (Organic Light-emitting Diode) is a LED, in which an organic molecule, a polymer, or an organometallic complex generates the emission.9 Although the technology itself is not widely diffused and the production lines are still small, several companies such as LG, Konica or Philips are already producing OLEDs panels. They can be used to make flexible and transparent panels.
The basic structure of an OLED consists of a thin film of an organic or material. The first diode of this type was reported by C. W. Tang and S. A. Van Slyke, the two chemists working at Eastman Kodak laboratories, in 1987.10 This first double heterostucture device (Figure 3) was made out of glass substrate coated with a transparent indium tin oxide (ITO) acting as anode; an aromatic diamine acting as a hole transporting layer; followed by a thin film of Alq3
(Aluminium tris(8-hydroxyquinolinate)) acting as both emissive and electron transporting layers; and the Mg:Ag cathode at the top.
7
Figure 3. Configuration of OLED and molecular structures
When an electrical current flows from cathode, through the organic materials, to the anode, positive and negative charges are injected into organic layers. The positive “holes” and the negative electrons recombine and form excitons inside the emissive layer (Figure 4). The electron-hole pairs so formed can be either in a singlet or in a triplet states. It depends on how the recombination occurs, but statistically the ratio is roughly 1:3 singlets to triplets.11 However, the singlets can undergo the intersystem crossing and became triplets as well, while the other way around is not possible. When the exciton decays, light is produced.
8
The OLEDs’ light quality is high and the response time is excellent. However, they are quite expensive and their lifetime sometimes is quite short, especially for the blue emitting OLEDs. They are sensitive to the environment, especially to water, so appropriate precautions should be taken, increasing the costs and complicating the manufacturing.
3. NIR (Near Infrared)
OLEDs does not include the visible spectrum only: more recently, there has been a growing interest in NIR-OLEDs. The devices made with molecules that emit in the IR region of the electromagnetic field may be used in different areas such as telecommunication, bioimaging, medical therapies and night vision equipment.12
Infrared (IR) is a part of electromagnetic spectrum. The word comes from Latin, where “infra” means below; in fact, it has a longer wavelength than that of red light, which is the longest of visible light. It was discovered by a British astronomer, Sir William Herschel, in 1800. He used a glass prism to split the sunlight in its colour components. He found out that different colours have a different temperature, increasing from violet to red, but that the invisible part, just beyond the red portion, had the highest temperature.
Infrared extends, roughly, from 750 nm to 1 mm. This region can be split into three smaller portions: Near-Infrared (NIR = 750 nm – 2500 nm), Mid-Infrared (MIR = 2500 nm – 25 μm) and Far Infrared (FIR = 25 μm – 1 mm). Lying outside of visible spectrum, Infrared light cannot be seen by human eyes; however, it can be seen with special cameras that translate it into visible colours. Infrared radiation is very important for the climate as well. The planet’s temperature is regulated by a balance between absorbed and emitted infrared radiation by the greenhouse gasses.13
As mentioned before, the NIR technology may have many applications: for example, in food industries it is widely used as a quality control’s tool – through a fast analysis it is possible to measure the quantity of fat, proteins or sugar.
Moreover, the near-infrared imaging is currently used in medicine and biology for diagnostics and therapeutic applications. Operating at long wavelength permits a deeper tissue penetration, together with a lower undesired absorption. In fact, in the wavelength range of 200 – 650 nm there is a number of blood and tissue components, such as melanin, haemoglobin (Hb) and
9
water, which have a high absorbance and thus, they can interfere with the analysis by creating a high background noise (Figure 5).14 However, the absorbance of these components
considerably decreases after 650 nm, therefore it is much convenient to work in that range and luminophores able to emit in the NIR window are extremely attractive.
Figure 5. Absorbance of various tissue and blood components
4. Why Iridium?
Transition metal complexes have found a large use within different branches of applied sciences, such as OLEDs and bioimaging technologies, but they also exhibit a broad range of biological activities, or can be used as catalysts in various reactions.15 Among transition metals derivatives, an important role is held by Ir(III) complexes, thanks to their robust nature, colour tunability, synthetic versatility and reversible electrochemistry.
Cyclometalated Ir(III) complexes exhibit bright and tunable phosphorescent emission, thus resulting very attractive also for bioimaging. In fact, they feature some interesting properties for bioimaging applications, such as: high quantum yields at room temperature; tunable phosphorescent emission that covers all the visible spectra and, sometimes, NIR; large Stroke shifts; long emission lifetimes compatible with time-gated imaging, that eliminates the problem of autofluorescence and increase the sensibility; great photochemical and photophysical stabilities, along with and redox stability.16 Phosphorescent Ir(III) complexes can be therefore used for cellular imaging, intracellular sensing or cancer cell detection. The drawback of many
10
Ir(III) complexes, however, consists in their cytotoxicity, thus their delivery relies on biocompatible carriers.17
The Ir(III) is a 5d6 transition metal and typically, the orbitals of d6 cations are destabilized and
split, once coordinated, in an octahedral ligand field: t2g (dxy, dxz, dyz) and eg (dz2, dx2-y2). The
energy gap between this two levels is called Δo (Figure 6).
Figure 6. d6 octahedral field splitting
The amount of energy Δo is smaller for the lower quantum numbers and bigger for the higher,
because of different spatial extension of the orbitals. The other factor that influence the amount of Δo is the nature of the ligands. Different ligands exert different field strength and they can be
ordered in a “spectrochemical series”. The oxidation state of the metal centre also plays an important role: the splitting is bigger for the higher oxidation states.
Being a trivalent cation of the 6th period, Ir(III) benefits of high LFSE (ligand field stabilisation energy). It makes the dissociative eg orbitals less accessible and leads to an enhancement of the
photostability.
Ir(III) properties are similar to those of Fe(II) (3d6), Ru(II) (4d6), Os(II) (5d6) and Re(I) (5d6). However, Fe(II) has a small Δo splitting, so the lowest lying excited state is a non-emissive 1MC
state, centered on eg metal orbitals. In the case of Ru(II), the lowest emissive excited state is 3MLCT in nature and it is close to the 3MC, which is not emissive. This latter state can be
thermally populated and, as a consequence, the non-radiative decay became more competitive. In fact, PLQY of Ru(II) complexes is inversely proportional to the temperature. Os(II) is quite close to Ir(III) in terms of properties. However, the emissive 3MLCT state is very low in energy
and in this case, radiationless paths governed by the “energy-gap law” become effective. Different possible transitions are illustrated in Figure 7.
11
Figure 7. Molecular orbitals and different transitions
The high LFSE makes MC (Metal Centered) excited state less thermally accessible. Which is good, because 3MC state is non-emissive and undergoes the non-radiative decay, which in turn compromises the photoluminescence quantum yield.
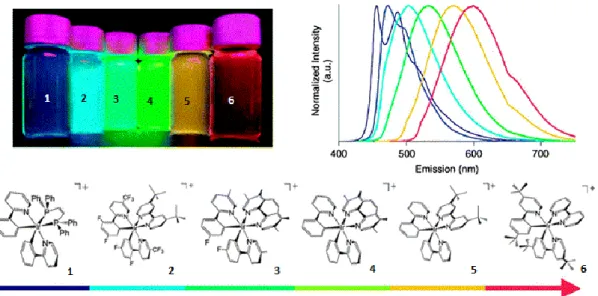
In principle, the emission colour of Ir(III) complexes can be tuned from blue to red through the appropriate modifications of the cyclometalating and/or ancillary ligands as described in the pioneering work of Prof. Thompson in 2001.18 , Figure 8 illustrates some Ir(III) based complexes with the emission along the whole visible spectrum.19
12
5. Tuning the emission
As mentioned before, through an accurate choice of the ligands, it is possible to tune the colour of emission of Ir(III) complexes. The colour depends on the HOMO-LUMO energy difference: a large energy gap corresponds to a blue-shifted emission, whereas a red-shifted emission originates from small energy gap.
According to the nature of Ir(III) ligands, the complexes can be rationalized in two groups: Homoleptic complexes, where three identical cyclometalating ligands are bond to
the metal centre;
Heteroleptic complexes, where a different ligand substitutes one of the cyclometalating ligands.
Homoleptic complexes can present two different geometries: facial (fac-) or meridional (mer-) isomers. The two possible geometries are illustrated in Figure 9. Facial is a thermodynamic isomer, thus more stable. Most of the reactions are run at high temperature, therefore mer- isomers are rarely obtained.
Figure 9. Geometry of homoleptic complexes
Heteroleptic complexes can be cationic, anionic or neutral, and the charge depends on the third ligand, which can be neutral, dianionic or monoanionic.
Typically, in a heteroleptic Ir(III) complex, the HOMO orbital is located on the cyclometalated ligands, while the LUMO is found on the ancillary (third) ligand.7
13
Therefore, the emission of blue light, or rather the increase of the HOMO-LUMO gap, can be achieved by:
Introducing electron-withdrawing substituents on the cyclometalated ligands; Adding electron-donating groups to the ancillary ligand;
Reducing the size of aromatic heterocycles;
Increasing the number of nitrogen atoms in the azole ring. 20
Regarding the red emission, in order to reduce the HOMO-LUMO gap, it is possible to: Add electron-withdrawing groups to the ancillary ligand;
Expand the π conjugation of both ligand systems;
Introduce electron-rich heteroaromatic rings in the cyclometalating ligand;
Based on these observations, Bossi and co-workers reported a study on the 1(-benzo[b]thiophen-2-yl)isoquinoline (Hiqbt) family of complexes.21 Thanks to the π conjugation of isoquinoline and benzotiophene groups and the presence of N and S atoms inside the aromatic rings it is possible to destabilize HOMO orbital. With the introduction of β-diketonate ancillary ligands, they obtained a slight red shift (10-15 nm) of the emission, compared to the corresponding tris-cyclometalated homoleptic complex. The ancillary ligands they used were: 2,2,6,6-tetramethyl-3,5-heptanedione (Hdpm), 2-thienoyltrifluoroacetone (Htta) featuring one thiophenyl group and 1,3-di(thiophen-2-yl)propane-1,3-dione (Hdtdk) featuring two thiophenyl groups. All three complexes have a NIR phosphorescence around 700 nm (Figure 10).
14
Figure 10. (top) Structure of complexes; (left) Absorption spectra (at 298K);
(right) Emission spectra (at 298K)
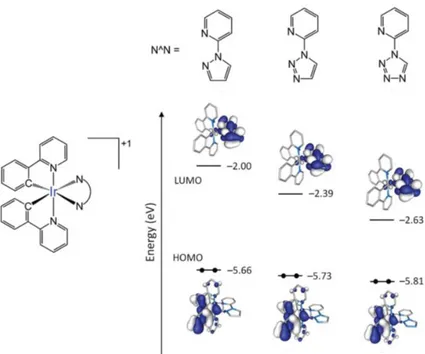
Another approach for the shift of the emission toward the red is that based on the stabilization of the LUMO, through the addition of electron-rich atom in the ancillary ligand. In this optic, Ortì and co-workers have recently reported a theoretical study describing the influence of azole rings on both cyclometalating and ancillary ligands.20
Through DFT calculations, they investigated the relative change in HOMO-LUMO energy gap in a series of Ir(III) complexes with 2-phenylpyridine as cyclometalating ligand, through modifications of the structures of the ancillary ligand, in particular by changing the number and the position of nitrogen atoms in the azole moiety linked to 2-pyridine derivatives.
In all the studied cases, calculations show that HOMO is mainly centred on the cyclometalating ligands and dπ orbitals of Ir(III), while the LUMO is centred on the π* orbitals of the ancillary
ligand. Moreover, it was observed that, by increasing the number of the N atoms in the azole ring, an effective stabilization of the LUMO is observed, while the HOMO is almost unaffected. This lead to a decrease of the HOMO-LUMO gap, as illustrated in Figure 11.
15
16
Purpose of the work
As mentioned above, the interest in NIR emitting materials is constantly growing, for both OLED and bioimaging applications. In order to have an efficient NIR emission, the HOMO-LUMO energy gap of the newly synthesized materials should be reduced, keeping in mind that, for small gaps, high photoluminescence quantum yield is very challenging.
With the aim of synthesizing a new family of NIR emitting Ir(III) complexes, and based on the reported works by Bossi and Ortì,20,21 as well as on experimental studies performed in the
research group where I worked, we envisaged the possibility to use for the first time 2-(1H-tetrazol-1-yl)pyridine as a bidentate ligand able to provide the required energy gap in the final complexes.
In detail, I used the 2-(1H-tetrazol-1-yl)pyridine ligand for the synthesis of a new family of heteroleptic cationic Ir(III) complexes 2N-4N, with typically ‘red emitter’ cyclometalated ligands, such as 2-methyl-3-phenylquinoxaline and 2-(1-benzothien-2-yl)pyridine, together with 1(-benzo[b]thiophen-2-yl)isoquinoline. The particular structure of these cyclometalating ligands should destabilize the HOMO orbital of the complexes, while the 2-(1H-tetrazol-1-yl)pyridine ligand should stabilize the LUMO orbital, resulting in an overall reduction of the HOMO-LUMO energy gap. In addition, I synthetized complex 1N, containing 2-phenyl pyridine as cyclometalating ligand, to be used as reference compound. The structures of the investigated complexes are reported in Figure 12.
17
Figure 12. Cationic Ir(III) complexes
Moreover, exploiting the particular structure of the 2-(1H-tetrazol-1-yl)pyridine ligand, I decided to investigate a second family of heteroleptic neutral Ir(III) complexes, in which the tetrazole fragment of the ligand act as a cyclometalating site (Figure 13).
18
Results and discussion
In order to synthesize the designed complexes, the work was divided in the following steps: 1. Synthesis of some cyclometalating ligands
2. Synthesis of Ir(III)-dimers
3. Synthesis of 2-(1H-tetrazol-1-yl)pyridine 4. Synthesis of cationic Ir(III) complexes 5. Synthesis of neutral Ir(III) complexes
Since the studies and methodologies of my thesis are subject of a possible patent, the description of the experimental work is in some cases summarized.
1. Synthesis of cyclometalating ligands
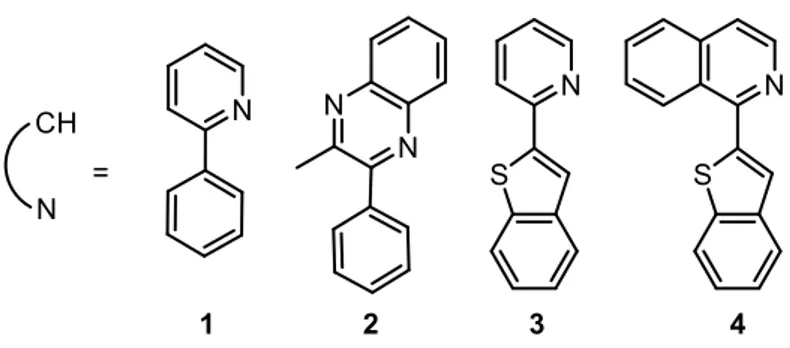
The derivatives I used as cyclometalating ligands are reported in Figure 14.
Ligand 1 was used as a reference,22 since 2-phenylpyridine (Hppy) based complexes are the
most popular, while the ligands 2-4 were chosen because of their capacity to red-shift the emission of the complexes to be obtained.21
Figure 6. Structures of the selected cyclometalating ligands
Ligands 1 and 3 were commercially available and were used without further treatment. On the contrary, ligands 2 and 4 had to be synthesized.
Ligand 2 was obtained through the double condensation of 1,2-diaminobenzene and 1-phenyl-1,2-propanedione in presence of I2 as catalyst (Scheme 1), following a described procedure.23
19
Scheme 1. Synthetic procedure for ligand 2
The reagents were dissolved in ACN and the mixture was stirred for an hour at room temperature. The solvent was removed in vacuum and the crude was purified on silica gel. NMR signals were in accordance with literature reported data and the product 2 was obtained in 93% yield.23
Ligand 4 was obtained through the Suzuki’s coupling of 1-chloroisoquinoline and benzo[b]thiophen-2-yl-boronic acid,21 as reported in Scheme 2.
Scheme 2. Synthetic procedure for ligand 4
All the reagents were dissolved in THF and the reaction was stirred at 90oC for 16 hours in presence of 1M K2CO3solution in water. Pd(PPh3)4 was used as catalyst. Since Pd(0) catalysts
are air sensitive, the reaction had to be performed under N2 atmosphere. After the work-up, the
crude was purified on silica gel. Ligand 4 was obtained as white solid in 78.7% yield and NMR signals were in accordance with literature reported data.21
20
2. Synthesis of Ir(III) dimers
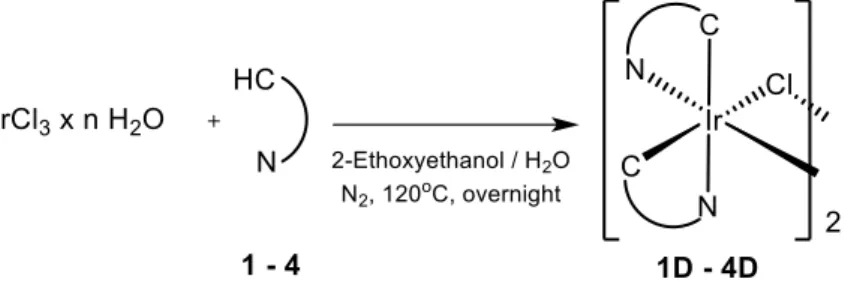
Once all ligands were available, the corresponding Ir(III) dimers were synthesized following the general procedure reported by Nonoyama in 1974.24 IrCl3 x nH2O was reacted with 2
equivalents of the appropriate cyclometalating ligand, giving the corresponding dimer, as reported in Scheme 3.
Scheme 3. Synthetic procedure for dimers 1D-4D
This cyclometalation reaction is a two-step process that consists in the binding of the donor group of the aromatic heterocycle of the ligand to the metal centre followed by intra-molecular cleavage of the C–H bond, forming the metal-containing cyclic framework.25 For this process
to occur, high temperatures are required, therefore all reagents were dissolved in the 3:1 mixture of 2-ethoxyethanol and water and the mixture was refluxed under N2 atmosphere overnight.
After this time, the dimer was formed as an insoluble solid. To achieve the complete precipitation, additional water was added. In the end, the solid was filtered and washed with water, hexane and Et2O in order to remove the impurities. The structures of the obtained Ir(III)
dimers are reported in Figure 15.
21
All the dimers are symmetric, so one series of signals, related to the single ligand should be expect from NMR analysis. Unfortunately, most of these dimers are poorly soluble in most common solvents: for example the NMR spectra of 2D was obtained in CDCl3, while for 3D
the NMR spectra was acquired in DMSO. However, DMSO is a coordinating solvent able to easily react with the dimer, destroying its symmetry and giving as the result a second series of NMR peaks. Dimers 1D and 4D are not soluble in any common deuterated solvent, so it was not possible to acquire any NMR spectra and they were directly used in the next reactions, as in literature reported works.
3. Synthesis of 2-(1H-tetrazol-1-yl)pyridine
The next step was the synthesis of the versatile 2-(1H-tetrazol-1-yl)pyridine ligand. Considering the studies reported in the literature and illustrated in the introduction20,21 I
identified ligand 5 (2-(1H-tetrazol-1-yl)pyridine) as the right precursor able to act both as a bis-chelating (N^N) and a cyclometalating (C^N) ligand to potentially obtain NIR-emitting Ir(III) complexes. In fact, the particular disposition of the nitrogen atoms in the tetrazole ring should stabilize the LUMO orbitals of the formed complexes, taking it at lower energies (if confronted, for example, with 2,2-bipyridine) and shifting the emission toward shorter wavelength (red). The synthesis of the ligand is here reported (Scheme 4).
Scheme 4. Synthetic procedure for ligand 5
Following the procedure reported by Linert,26 2-aminopyridine, sodium azide and triethyl orthoformate were dissolved in glacial acetic acid and the solution was stirred at 80oC for 6 hours. Acetic acid was removed in vacuum and the crude was dissolved in Et2O. The reaction
was neutralized with NaHCO3. The formed solid was filter off and the organic layer was dried
over Na2SO4. The solvent was removed in vacuum and the crude was recrystallized from EtOH.
22
with literature reported data. The signals related to the protons of the pyridine ring can be found in the region between 8.55 and 7.43 ppm, while the signal related the H of the tetrazole ring appears as a singlet centred at 9.54 ppm, as reported in Figure 16.
Figure 8. 1H NMR spectrum of 2-(1H-tetrazol-1-yl)pyridine 5 (CDCl
3, 400 MHz)
In addition to the electronic effects on the energy of molecular orbitals, a very interesting peculiarity of the obtained ligand is its versatility in acting as bidentate ligand. In fact, it can behave as coordinating ligand (N^N), but, interestingly, it can also be used as cyclometalating ligand (C˄N), (See Figure 17). In fact, it can lose its acidic proton when treated with a base.
23
The main challenge however in using 5 as cyclometalating ligand is the identification of the right base able to assist the reaction. In fact, the tetrazolyl pyridine 5 appears to be quite sensitive to pH: in presence of a strong base, such as TBAOH, it reacts forming a new specie,
N-(pyridin-2-yl)cyanamide. As soon as the base is added, visible bubbles are produced, by the
escape from solution of N2 (Scheme 5).
Scheme 5. Formation of N-(pyridin-2-yl)cyanamide
The formation of the new specie was confirmed by NMR (Figure 18). All the aromatic peaks are still present, although they are significantly shifted to the higher fields. In detail, the former peaks appear now in the range between 7.90 to 6.40 ppm. Moreover, the singlet of the tetrazole ring disappeared and a newly formed amine group’s broad singlet at 5.30 ppm appeared.
24
Looking for milder conditions, a detailed base screening was performed and finally I was able to find the optimal conditions to deprotonate ligand 5 (Scheme 6), as results from NMR analysis showing that over 95% of ligand was deprotonated (Figure 19).
Scheme 6. Deprotonation of ligand 5
25
4. Synthesis of cationic Ir(III) complexes
The first compounds I attempted to synthesize were cationic Ir(III) complexes 1N-4N, (Figure 20), where the 2-(1H-tetrazol-1-yl)pyridine ligand coordinates the Ir(III) with two nitrogen atoms, acting as a N^N neutral ligand.
Figure 12. Structures of cationic Ir(III) complexes 1N-4N
First, I studied the synthesis of complex 1N. After performing a wide screening of reaction conditions, solvents and additives, I optimized the reaction and the purification procedures and obtained 1N in 66% yields.
Scheme 7. Synthesis of complex 1N
The formation of the desired complex was confirmed by NMR spectrometry (Figures 21-22) and HR-MS. In detail, in the 1H NMR spectrum the singlet of the CH of the tetrazole ring was shifted at 10.70 ppm, while the signals related to the two cyclometalated ligands appear not
26
equivalent, confirming the non-symmetric structure of the formed complex. The 13C NMR
spectrum was consistent with the structure displaying the signals of all the not equivalent carbons.
Figure 13. 1H NMR spectrum of 1N (Acetone-d6, 600 MHz)
27
Following the optimized reaction condition for 1N, complex 2N was obtained in 96% yields, (Scheme 8).
Scheme 8. Synthesis of complex 2N
The NMR spectra of the purified product (Figure 23-24) were then acquired: the singlet of the CH of the tetrazole ring was shifted at 10.20 ppm in the 1H NMR spectrum, and in both spectra the signals related to the two cyclometalated ligands appear not equivalent, confirming the non-symmetric nature of the product. HR-MS analysis was performed as well, to further confirm the formation of desired complex.
Figure 15. 1H NMR spectrum of 2N (Acetone-d
28
Figure 16. 13C NMR spectrum of 2N (bottom); DEPT (top) (Acetone-d
6, 150 MHz)
The same reaction conditions proved to be successful also in the synthesis of complex 3N, obtained in 67% yields, as reported in Scheme 9.
Scheme 9. synthetic procedure for complex 3N
After purification, the structure of 3N was confirmed by NMR spectroscopy (Figure 25 and 26) and HR-MS. Even in this case, the signals related to the two cyclometalated ligands appeared not equivalent and in the 1H NMR spectrum the singlet of the CH of the tetrazole ring was shifted at 10.75 ppm.
29
Figure 25:.1H NMR spectrum of 3N (Acetone-d
6, 600 MHz)
Figure 17. 13C NMR spectrum of 3N (bottom); DEPT (top) (Acetone-d6, 150 MHz)
Unfortunately, complex 4N was more challenging to synthesize compared with the other analogous derivatives 1N-3N. In fact, despite several attempts, a satisfying amount of the desired product was never obtained. As first try, I used the same reaction conditions adopted for the previous complexes (Scheme 10), but the NMR analysis of the crude mixture indicated
30
the presence of many by-products, deriving either from the instability of the complex or from the presence of impurities within the starting dimer. Despite all the efforts for purification, the product was not isolated.
Since an accurate structure analysis of the starting dimer was not possible owing to its insolubility, we hypothesized that problems occurred in its formation. So it was decided to approach different routes to the dimer 4D. However, all the attempts to react the so obtained
4D with the ligand 5 was unsuccessful, since I always got complex reaction mixtures from
which the desired product was never isolated. Studies are in progress to find better reaction conditions and purification procedures.
Scheme 10. Attempted synthesis of complex 4N
5. Synthesis of neutral Ir(III) complexes
In the second part of my thesis I synthetized three neutral Ir(III) complexes 1C-3C where the 2-(1H-tetrazol-1-yl)pyridine 5 act as a cyclometalating C^N ligand (Figure 27).
The direct cyclometalation according to the procedure described by Thompson27 was attempted.
However, since the methodology requires the use of high temperatures and, in some cases, of a base to promote the cyclometalation, I was aware that good results were difficult to obtain since 2-(1H-tetrazol-1-yl)pyridine is a very sensitive ligand and at high temperature it either undergoes a complete breakdown or gives undesired reactions.
As expected, the reaction of IrCl3 x nH2O salt with 2-(1H-tetrazol-1-yl)pyridine (5) in the
refluxing mixture of 2-ethoxyethanol and water (130oC) didn’t yield the desired dimer. At the same time, the reaction of dimer 1C with ligand 5 in DCM and under reflux temperature gave a mixture of unknown products.
31
Figure 18. Generic structure of neutral complexes
Therefore, a wide screening of reaction conditions was performed by varying the solvent, temperature and reagents. At the end, a general procedure for the synthesis of 1C and 2C was set up.
Reaction of dimer 1D with ligand 5 under the appropriate condition gave complex 1C in 55% yields after purification (Scheme 13).
Scheme 11. Synthesis of complex 1C
The 1H NMR spectrum (Figure 28) was acquired and no singlet of the CH of the tetrazole ring was observed proving the cyclometalation, while the signals related to the other two cyclometalated ligands appear not equivalent, confirming the non-symmetric structure of the formed complex. 13C NMR spectrum was also acquired (Figure 29) to further confirm the structure of the complex.
32
Figure 19. 1H NMR spectrum of 1C (CDCl
3, 400 MHz)
33
Similarly, complex 2C was obtained in 46% yields from the reaction of dimer 2D with ligand
5, (Scheme 14).
Scheme 12. Synthesis of complex 2C
The formation of the desired complex was confirmed by NMR spectrometry and HR-MS. In detail, as in the previous case, in the 1H NMR spectrum (Figure 30) the singlet of the CH of the tetrazole ring is missing and the signals related to the other two cyclometalated ligands appeared not equivalent, confirming the non-symmetric structure of the formed complex. The same conclusions can be deduced from the 13C NMR spectrum (Figure 31).
Figure 30. 1H NMR spectrum of 2C (CDCl
34
Figure 31. 13C NMR spectrum of 2C (bottom); DEPT (top) (CDCl3, 150 MHz)
On the contrary, the synthesis of complex 3C was much more challenging. The procedure exploited for the synthesis of 1C and 2C did not give the desired results. A complex reaction mixture was obtained and I was not able to find the right conditions to perform the purification of 3C. Therefore, alternative reaction conditions were considered, and after various attempt, I was able to synthetize 3C in quantitative yield.
Scheme 13. Synthesis of complex 3C
The formation of the complex was confirmed by NMR spectrometry (Figure 32) and HR-MS. The singlet of the CH of the tetrazole ring was not observed in the 1H NMR spectrum proving the cyclometalation and the signals related to the two cyclometalated ligands appeared not equivalent, confirming the non-symmetric structure of the formed complex.
35
36
6. Photophysical characterization
The cationic iridium(III) complexes 1N, 2N and 3N are relatively unstable and/or insoluble in common spectroscopic solvents, consequently their photophysical characterization is not reported in the present thesis. Possible degradation pathways were investigated and the detachment of the N^N ligand from the iridium metal centre seems to be the main responsible. On the contrary, complexes 1C, 2C and 3C are stable in solution for days and do not show degradation under standard laboratory conditions. The following spectroscopic data were acquired:
Absorbance spectra in acetonitrile at 298 K
Emission spectra, PLQYs and excited-state lifetimes in acetonitrile at 298 K Emission spectra and excited-state lifetimes in rigid matrix at 77K
Emission spectra, PLQYs and excited-state lifetimes in PMMA
The room-temperature electronic absorption spectra of 1C-3C are reported in Figure 33. The spectral window between 225 and 300 nm shows intense absorption bands ( ≈ 2–9 104 M–1 cm–1) that are tentatively assigned to spin-allowed ligand-centred (LC) π–π* electronic transitions involving the cyclometalating ligands.7 On the other hand, the weaker bands at a longer wavelength could also display a contribution from the iridium d orbitals and arise from transitions of both singlet and triplet spin multiplicity, due to the high spin–orbit coupling constant of the iridium metal centre.
37
Figure 33. Absorption spectra of 1C-3C in acetronitrile at 298 K.
The room-temperature emission spectra of complexes 1C-3C in diluted acetonitrile solutions are reported in Figure 34. All complexes emit from a predominantly 3LC excited state with an important 3MLCT contribution from the iridium dπ orbitals. The ligand that is involved in the
transition is always the one in trans to the cyclometalating site of ligand 5, as corroborated by the spin density plots of the lowest triplet state reported in Figure 35. The low values of the radiative decay constants (kr) reported in Table 1, further confirm this hypothesis (i.e., the kr of
all the complexes are around 104 s–1, a value that is compatible with emission from 3LC excited
states).7 Notably, the emission profile of complex 3C displays a strongly vibronically structured
emission profile due to the presence of the 2-(benzo[b]thiophen-2-yl)pyridine cyclometalating ligands. In fact, a similar emission profile was also observed in an analogue neutral iridium(III) complex based on the same benzothiophene ligand, but having an acetylacetonate (acac) ancillary ligand instead of 5.28
As experimentally observed, ligand 5 basically acts as a spectator ligand, therefore the emission properties of 1C–3C are effectively tuned by the other two cyclometalating ligands. As already observed for other iridium(III) complexes, the phenyl-quinoxaline (i.e., the ligand of 2C) is able to promote a strong red shift in the emission band of the related complex, if compared to 1C which is based on phenyl-pyridine cyclometalating ligands.29
These experimental findings are in excellent agreement with DFT calculations; in fact, the estimated emission energies (calculated from the adiabatic energy difference between S0 and
38
T1) are computed to be 2.56 eV (483 nm), 1.88 eV (661 nm) and 2.08 eV (596 nm) for 1C, 2C
and 3C, respectively (to be compared to spectroscopic data of Table 1).
Figure 34. Normalized emission spectra of 1C-3C in acetonitrile solution at 298 K (full lines)
and at 77 K (dashed lines). Excitation wavelength: 420 nm.
Figure 35. Spin-density distributions calculated for the fully relaxed lowest triplet state (T1)
39
Table 1. Luminescence properties and photophysical parameters of C1–C3 in acetonitrile.
Oxygen-free CH3CN solution, 298 K Rigid matrix
CH3CN, 77 K ema [nm] PLQYb [%] c [µs] kr d [104 s–1] knr e [106 s–1] ema [nm] c [µs] 1C 525 1.4 1.2 1.2 0.82 504, 532(sh) 0.9 (22%) 4.0 (78%) 2C 676 0.5 0.8 0.63 1.2 658 3.7 (33%) 8.9 (67%) 3C 600, 650 7.6 4.9 1.6 0.19 598, 652 5.2 (57%) 12.3 (43%) a
exc = 420 nm; b exc = 420 nm, [Ru(bpy)3]Cl2 aqueous solution as reference, PLQY = 2.8 %; c exc =
365 nm; d k
r = PLQY/; e knr = 1/ – kr.
The photoluminescence quantum yields (PLQYs) of complexes 1C and 2C are relatively modest in room-temperature acetonitrile solution (i.e., around 1%) and only in the case of complex 3C a PLQY of 7.6% was recorded. This higher PLQY, compared to 1C and 2C, can be ascribed to a strong reduction in the non-radiative deactivation pathways (i.e., knr around 105
vs. 106 s–1, see Table 1), rather than to a different nature of the emitting state. The remarkably high values of knr observed for this series of complexes deserve a more accurate photophysical
investigation (e.g., temperature dependent studies and/or a more detailed theoretical analysis of thermally accessible triplet excited states); these investigations are ongoing. In fact, similar cyclometalated iridium(III) complexes are known to display low PLQYs due to the presence of low-lying metal centred (3MC) states that are able to effectively quench their luminescence.30 At 77 K, all the complexes show bright emission. This experimental evidence is actually an additional indication suggesting that, at room temperature, thermally activated processes can be responsible for emission quenching. At low temperature, all emission spectra display a negligible blue shift compared to 298 K data, which is a further indication that the emissive state in all complexes has a strong 3LC character, with a little 3MLCT contibution. This is particularly true in the case of complex 3C, where the emission at 77 K is practically superimposable with the one at 298 K.
The emission properties of 1C-3C were also investigated in the solid state (i.e., in PMMA matrix at a concentration of 1% by weight and in neat films).
In PMMA matrix, an increase of PLQYs is generally observed for all the complexes, if compared to data in room-temperature solutions (see Table 2 and Table 1). The emission profiles are very similar to the ones already recorded in acetonitrile (compare Figure 36 and
40
34), suggesting that the emitting state responsible for the luminescence in the solid state is the same of the solution.
Figure 36. Normalized emission spectra of 1C-3C in PMMA 1% wt. at 298 K (dotted lines),
compared with the associated spectra in acetonitrile solution at 298 K (full lines). Excitation wavelength: 420 nm.
Table 2. Luminescence properties and photophysical parameters of 1C-3C in solid state
(PMMA 1% wt.) at 298 K. ema [nm] PLQYb [%] c [µs] kr d [104 s–1] knr e [105 s–1] 1C 510 2.7 1.4 1.9 6.9 2C 645 13.0 1.1 11.8 7.9 3C 600, 650 16.8 7.0 2.4 1.2 a
exc = 420 nm; b exc = 420 nm, determined using an integrating
sphere; c
exc = 365 nm; d kr = PLQY/; e knr = 1/ – kr.
On the other hand, in neat film, no emission is detected (i.e., PLQY < 0.1%). This could be potentially attributable to self-quenching due to the high concentration of the emitter, a phenomenon that is commonly observed in the case of cyclometalated iridium(III) complexes lacking of bulky substituents.7
41
Conclusions
During my thesis, I spent most of the time in performing synthetic experimental work in the lab, finding the right reaction and purification conditions and currently the project is still in progress.
I had successfully synthesized all of the required ligands in good yields and purity.
I have developed efficient synthetic methods for the preparation of three cationic Iridium(III) complexes, 1N-3N, in which 2-(1H-tetrazol-1-yl)pyridine acts as N^N bis-chelating ligand and three neutral Iridium(III) complexes, 1C-3C, in which 2-(1H-tetrazol-1-yl)pyridine acts as C^N cyclometalating ligand. Unfortunately, any attempt to obtain pure complex 4N failed. All the compounds were characterized with NMR spectroscopy and MS spectrometry.
Concerning the photophysical properties, only neutral complexes 1C-3C resulted stable under standard experimental conditions and were fully investigated.
From computational and photophysical analysis, ligand 2-(1H-tetrazol-1-yl)pyridine proved to basically behave as a spectator ligand and could not dramatically shift the emission of the obtained complexes towards NIR wavelengths.
Studies are in progress to find a viable route to 4N complex and to perform the photophysical characterizations of the cationic complexes.
42
Experimental section
1. Materials and methods
1H, 13C and 19F NMR spectra were recorded on a Varian AS 300, on a Mercury 400 or a Varian
AS 600 spectrometer. All spectra were acquired at 25oC, unless otherwise specified.
Chemical shifts (δ) are reported in ppm relative to residual solvent signals for 1H and 13C NMR: Solvent 1H NMR (ppm) 13C NMR (ppm)
CDCl3 7.26 77.0
Acetone-d6 2.05 29.9
DMSO 2.50 39.5
13C NMR spectra were acquired with 1H broadband decoupled mode. The types of carbon atoms
were determined by DEPT NMR experiments. To indicate the multiplicity were used the following abbreviations: s, singlet; d, doublet; t, triplet; dd, double doublet; dt, double triplet; m, multiplet. Analytical grade solvents and commercially available reagents were used as received, unless otherwise stated. Chromatographic purifications were performed using 230-400 mesh silica and 70-290 mesh Al2O3.
43
2. Synthesis
2.1. Synthesis of ligands
2.1.1. Synthesis of 2-methyl-3-phenylquinoxaline (2)
1,2-benzenediamine (650 mg; 6 mmol; 1.2 equiv) and 1-phenyl-1,2-propanedione (673 μL; 5 mmol; 1 equiv) were dissolved in acetonitrile (3 mL). Iodine (126 mg; 0.3 mmol; 0.1 equiv) was added and the mixture was stirred for 1h at rt. The solvent was removed in vacuum and the resulting yellowish solid was purified by flash chromatography on silica gel (Hexane:Ethyl acetate = 6:1) giving the product as an off-white solid (1.02 g; 93.0% yield). NMR signals are in accordance with literature reported data.23
1H NMR (CDCl
3, 300 MHz) δ 8.15-8.02 (m, 2H), 7.77-7.69 (m, 2H), 7.69-7.63 (m, 2H),
7.57-7.47 (m, 3H), 2.78 (s, 3H).
2.1.2. Synthesis of 1(-benzo[b]thiophen-2-yl)isoquinoline (4)
1-chloroisoquinoline (500 mg; 3.05 mmol; 1 equiv) and benzo[b]thiophen-2-yl-boronic acid (545 mg; 3.06 mmol; 1 equiv) were dissolved in THF (12 mL) under N2 atmosphere. Then a
1M K2CO3solution in water (12 mL) was added, followed by Pd(PPh3)4 (176 mg; 0.15 mmol;
44
the aqueous layer was extracted with DCM (3 x 10 mL). The organic layers were combined, dried over Na2SO4, concentrated and the crude was purified by flash chromatography on silica
gel (Hexane:Ethyl Acetate = 95:5) giving the product as a white solid (627 mg; 78.7% yield). NMR signals are in accordance with literature reported data.21
1H NMR (CDCl 3, 400 MHz) δ 8.63 (d, JHH = 1.0 Hz, 1H), 8.62 (d, JHH = 5.7 Hz, 1H), 7.95-7.88 (m, 3H), 7.85 (s, 1H), 7.76-7.72 (m, 1H), 7.68 (d, JHH = 1.4 Hz, 1H), 7.67-7.64 (m, 1H), 7.43-7.40 (m, 2H). 13C NMR (CDCl 3, 100 MHz) δ 153.7 (C), 143.1 (C), 142.4 (CH), 140.9 (C), 140.3 (C), 137.2 (C) 130.4 (CH), 128.0 (CH), 127.5 (CH), 126.8 (CH), 126.6 (C), 125.6 (CH), 125.3 (CH), 124.6 (CH), 124.4 (CH), 122.5 (CH), 120.6 (CH). GC-MS: m/z = 259 (100%), 130 (26%). 2.1.3. Synthesis of 2-(1H-tetrzol-1-yl)pyridine (5)
2-Aminopyridine (0.94 g; 10 mmol; 1 equiv), sodium azide (1.33 g; 20 mmol; 2 equiv) and triethyl ortoformate (5 mL; 30 mmol; 3 equiv) were dissolved in glacial acetic acid (4.6 mL; 80 mmol; 8 equiv). The solution was stirred at 80oC for 6h. Acetic acid was removed in vacuum and the crude was dissolved in Et2O. NaHCO3 was added until the evolution of CO2 ceased.
The formed solid was filter off and the ether layer was dried over Na2SO4. The solvent was
removed in vacuum and the crude was recrystallized from EtOH. The final product was obtained in 62% yield (0.91 g) as white crystals.
1H NMR (CDCl
3, 400 MHz) δ 9.54 (s, 1H), 8.55 (d, JHH = 4.9 Hz, 1H), 8.10 (dd, JHH = 0.9 Hz,
45
2.2. Synthesis of Ir(III) dimers General procedure of synthesis
Under N2 atmosphere, IrCl3 x nH2O (1 equiv) and desired ligand (2.5 equiv) were dissolved in
a 3:1 mixture of 2-ethoxyethanol and H2O (4 mL). The solution was refluxed overnight. After
this time, water (5 mL) was added and the formed coloured solid was filtered on Büchner and washed with water (2 times x 5 mL), Et2O (2 times x 5 mL) and Hexane (2 times x 5 mL).
2.2.1. Synthesis of dimer 1D
Following the general procedure, the reaction of IrCl3 x nH2O (50 mg; 0.167 mmol; 1 equiv)
with 2-phenylpyridine (65 mg; 0.418 mmol; 2.5 equiv) in a 3:1 mixture of 2-ethoxyethanol and H2O gave 1D as a yellow solid (63.7 mg; yield 71.3%). The crude dimer was used in the next
46
2.2.2. Synthesis of dimer 2D
Following the general procedure, the reaction of IrCl3 x nH2O (150 mg; 0.50 mmol; 1 equiv)
with methyl-3-phenylquinoxaline (2) (275 mg; 1.25 mmol; 2.5 equiv) in a 3:1 mixture of 2-ethoxyethanol and H2O gave 2D as a red solid (222.8 mg; yield 67.0%). The crude dimer was
used in the next step without further purifications.
1H NMR (CDCl
3, 400 MHz) δ 8.15 (d, JHH = 8.9 Hz, 4H), 7.95 (d, JHH = 7.8 Hz, 4H), 7.68 (dd,
JHH = 8.4 Hz, JHH = 0.9 Hz, 4H), 7.56 (t, JHH = 7.2 Hz, 4H), 6.93-6.78 (m, 8H), 6.31 (t, JHH =
7.6 Hz, 4H), 5.75 (d, JHH = 7.8 Hz, 4H), 3.18 (s, 12H).
2.2.3. Synthesis of dimer 3D
Following the general procedure, the reaction of IrCl3 x nH2O (300 mg; 1.0 mmol; 1 equiv)
with (1-benzothien-yl)pyridine (3) (530 mg; 2.5 mmol; 2.5 equiv) in a 3:1 mixture of 2-ethoxyethanol and H2O gave 3D as an orange solid (461.9 mg; yield 71.3%). The crude dimer
was used in the next step without further purifications.
1H NMR (DMSO, 300 MHz) δ 9.93 (d, J
HH = 6.0 Hz, 1H), 9.69 (d, JHH = 6.0 Hz, 1H), 8.19 (dt,
JHH = 1.6 Hz, JHH = 7.8 Hz, 1H), 8.10 (dt, JHH = 1.6 Hz, JHH = 7.8 Hz, 1H), 7.93 (d, JHH = 8.2
47
(m, 1H), 7.22-7.16 (m, 1H), 7.15-7.09 (m, 1H), 6.94-6.88 (m, 1H), 6.82-6.75 (m, 1H), 6.19 (d,
JHH = 8.2 Hz, 1H), 5.56 (d, JHH = 8.2 Hz, 1H).
2.2.4. Synthesis of dimer 4D
Following the general procedure, the reaction of IrCl3 x nH2O (50 mg; 0.167 mmol; 1 equiv)
with 1(-benzo[b]thiophen-2-yl)isoquinoline (4) (109 mg; 0.419 mmol; 2.5 equiv) in a 3:1 mixture of 2-ethoxyethanol and H2O gave 4D as a brown solid (78.4 mg; yield 62.8%) insoluble
in all common deuterated solvents available in the laboratory. The crude dimer was used in the next step without further purifications.
2.3. Synthesis cationic Ir(III) complexes 2.3.1. Synthesis of 1N
Following the general procedure I set up, complex 1N was obtained as a yellow solid in 65.7% yield (21.3 mg).
1H NMR(Acetone-d
6, 600 MHz) δ 10.71 (s, 1H), 8.80 (d, JHH = 8.4 Hz, 1H), 8.55 (t, JHH = 8.2
Hz, 1H), 8.27 (d, JHH = 8.4 Hz, 1H), 8.25 (d, JHH = 8.4 Hz, 1H), 8.05-7.9 (m, 4H), 7.93-7.90
48 = 7.2 Hz, 1H), 7.01 (t, JHH = 7.2 Hz, 1H), 6.95 (t, JHH = 7.2 Hz, 1H), 6.88 (t, JHH = 7.2 Hz, 1H), 6.32-6.29 (m, 2H). 13C NMR (Acetone-d 6, 150 MHz) δ 168.7 (C), 167.7 (C), 151.4 (CH), 151.0 (CH), 150.7 (CH), 147.0 (C), 146.6 (C), 145.2 (C), 145.0 (C), 144.6 (C), 143.6 (CH), 140.2 (CH), 140.1 (CH), 132.7 (CH), 132.1 (CH), 131.4 (CH), 130.7 (CH), 129.32 (CH), 129,31 (CH), 126.0 (CH), 125.5 (CH), 124.8 (CH), 124.4 (CH), 124.2 (CH), 123.7 (CH), 121.0 (CH), 120.9 (CH), 117.5 (CH). 19F NMR (Acetone-d 6, 376 MHz) δ -155.0. 2.3.2. Synthesis of 2N
Following the general procedure, complex 2N was obtained as a red solid in 96.4% yield (41.6 mg). 1H NMR (Acetone-d 6, 600 MHz) δ 10.20 (s, 1H), 8.58 (d, JHH = 7.9 Hz, 1H), 8.54 (d, JHH = 5.6 Hz, 1H), 8.49 (d, JHH = 8.1 Hz, 1H), 8.34 (dt, JHH = 1.5 Hz, JHH = 7.9 Hz, 1H), 8.26 (d, JHH = 8.5 Hz, 1H), 7.92-7.89 (m, 3H), 7.67-7.64 (m, 1H), 7.62 (d, JHH = 9.1, 1H), 7.61-7.58 (m, 1H), 7.37-7.33 (m, 2H), 7.31-7.26 (m, 2H), 7.17-7.15 (m, 1H), 6.94 (dt, JHH = 1.0 Hz, JHH = 7.4 Hz, 1H), 6.89-6.86 (m, 2H), 6.75 (dd, JHH = 0.7 Hz, 1H), 3.41 (s, 3H), 3.37 (s, 3H). 13C NMR (Acetone-d 6, 150 MHz) δ 165.6 (C), 164.5 (C), 153.8 (C), 153.7 (C), 150.2 (C), 148.5 (CH), 147.4 (C), 146.6 (C), 145.9 (C), 145.6 (C), 145.2 (CH), 144.0 (CH), 141.3 (C), 141.1 (C), 140.9 (C), 140.7 (C), 136.8 (CH), 136.4 (CH), 131.84 (CH), 131.82 (CH), 131.6 (CH), 131.3 (CH), 131.2 (CH), 131.1 (CH), 131.0 (CH), 130.7 (CH), 130.1 (CH), 130.0 (CH), 129.5 (CH), 125.0 (CH), 124.9 (CH), 124.8 (CH), 124.6 (CH), 117.1 (CH), 27.5 (CH3), 27.4 (CH3). 19F NMR (Acetone-d 6, 376 MHz) δ -155.0.
49
2.3.3. Synthesis of 3N
Following the general procedure, complex 3N was obtained as an orange solid in 67.4% yield (26 mg). 1H NMR (Acetone-d 6, 600 MHz) δ 10.75 (s, 1H), 8.85 (d, JHH = 8.3 Hz, 1H), 8.56 (dt, JHH = 1.7 Hz, JHH = 8.0 Hz, 1H), 8.12-8.07 (m, 3H), 8.02 (d, JHH = 5.7 Hz, 1H), 7.97 (dt, JHH = 1.0 Hz, JHH = 5.7 Hz, 1H), 7.95 (dt, JHH = 1.1 Hz, JHH = 8.0 Hz, 1H), 7.90 (dt, JHH = 1.1 Hz, JHH = 8.1 Hz, 1H), 7.88 (dt, JHH = 0.8 Hz, JHH = 8.2 Hz, 1H), 7.84 (dd, JHH = 1.1 Hz, JHH = 7.6 Hz, 1H), 7.83 (d, JHH = 8.0 Hz, 1H), 7.25-7.23 (m, 1H), 7.21-7.19 (m, 1H), 7.15-7.13 (m, 1H), 7.10-7.08 (m, 1H), 6.93-6.87 (m, 2H), 6.08 (d, JHH = 8.2 Hz, 2H). 13C NMR (Acetone-d 6, 150 MHz) δ 165.6 (C), 164.7 (C), 152.5 (CH), 152.1 (CH), 151.5 (CH), 146.8 (C), 146.43 (CH), 146.40 (C), 145.5 (C), 144.3 (CH), 143.3 (C), 143.01 (C), 143.00 (C), 141.61 (CH), 141.60 (CH), 141.3 (C), 138.0 (C), 137.7 (C), 129.8 (CH), 126.8 (CH), 126.5 (CH), 125.6 (CH), 125.5 (CH), 125.4 (CH), 125.1 (CH), 124.2 (CH), 124.1 (CH), 123.0 (CH), 122.5 (CH), 120.8 (CH), 120.6 (CH), 117.9 (CH). 19F NMR (Acetone-d 6, 376 MHz) δ -155.0.
50
2.4. Synthesis neutral Ir(III) complexes 2.4.1. Synthesis of 1C
Following the general procedure I developed, complex 1C was obtained as a yellow solid in 55.2% yield (10 mg). 1H NMR (CDCl 3, 600 MHz) δ 8.99 (d, JHH = 5.8 Hz, 1H), 8.00 (d, JHH = 5.8 Hz, 1H), 7.91 (d, JHH = 8.0 Hz, 1H), 7.85 (d, JHH = 8 Hz, 1H), 7.77 (d, JHH = 7.3 Hz, 1H), 7.75 (d, JHH = 7.3 Hz, 1H), 7.58-7.50 (m, 3H), 7.44 (d, JHH = 5.3 Hz, 1H), 7.21 (t, JHH = 6.5 Hz, 1H), 7.05 (t, JHH = 6.5 Hz, 1H), 6.87-6.82 (m, 3H), 6.72 (d, JHH = 7.2 Hz, 1H), 6.69 (d, JHH = 7.2 Hz, 1H), 6.60 (t, JHH = 6.3 Hz, 1H), 6.21 (d, JHH = 7.8 Hz, 1H), 6.16 (d, JHH = 7.8 Hz, 1H). 13C NMR (CDCl 3, 150 MHz) δ 169.6 (C), 169.0 (C), 167.8 (C), 151.1 (CH), 149.2 (CH), 148.2 (C), 144.6 (CH), 144.13 (C), 144.11 (C), 143.7 (C), 138.3 (CH), 137.3 (CH), 137.1 (CH), 132.3 (CH), 132.1 (CH), 129.6 (CH), 129.5 (CH), 124.2 (CH), 124.0 (CH), 122.7 (CH), 122.3 (CH), 121.6 (CH), 121.3 (CH), 119.0 (CH), 118.5 (CH), 118.4 (C), 114.6 (CH), 113.4 (CH). 2.4.2. Synthesis of 2C
Following the general procedure, complex 2C was obtained as a red solid in 46.4% yield (8 mg).
51 1H NMR(CDCl 3, 600 MHz) δ 8.30 (d, JHH = 8.8 Hz, 1H), 8.28 (d, JHH = 8.3 Hz, 1H), 8.25 (d, JHH = 8.1 Hz, 1H), 8.02 (d, JHH = 8.3 Hz, 1H), 7.96 (d, JHH = 8.1 Hz, 1H), 7.66-7.64 (m, 2H), 7.60 (t, JHH = 7.5 Hz, 1H), 7.52 (t, JHH = 7.5, 1H), 7.35 (d, JHH = 5.4, 1H), 7.14-7.09 (m, 3H), 7.06 (t, JHH = 7.7 Hz, 1H), 6.74 (t, JHH = 7.4 Hz, 1H), 6.69 (t, JHH = 7.4 Hz, 1H), 6.65 (d, JHH = 7.4 Hz, 1H), 6.44-6.40 (m, 2H), 6.23 (d, JHH = 8.8 Hz, 1H), 3.39 (s, 3H), 3.35 (s, 3H). 13C NMR (CDCl 3, 150 MHz) δ 167.5 (C), 164.4 (C), 163.2 (C), 152.3 (C), 152.1 (C), 151.1 (C), 150.4 (C), 145.0 (C), 144.5 (C), 142.1 (CH), 140.4 (C), 140.2 (C), 140.15 (C), 140.14 (C), 138.2 (CH), 136.1 (CH), 135.5 (CH), 130.5 (CH), 130.0 (CH), 129.7 (CH), 129.6 (CH), 129.5 (CH), 129.2 (CH), 129.1 (CH), 128.99 (CH), 128.96 (CH), 128.1 (CH), 127.3 (CH), 125.7 (CH), 122.4 (CH), 122.0 (CH), 116.1 (C), 114.4 (CH), 112.6 (CH), 27.4 (CH3), 27.3 (CH3).
HRMS calcd for C36H26IrN9: 776.1940; found: 776.2014.
2.4.3. Synthesis of 3C
Following the procedure I developed for this compound, complex 3C was isolated as an orange solid in quantitative yield (20 mg).
1H NMR (Acetone-d
6, 400 MHz) δ 9.19-9.17 (m, 1H), 8.38-8.35 (m, 1H), 8.13-8.06 (m, 2H),
7.96-7.91 (m, 1H), 7.89-7.85 (m, 2H), 7.80-7.77 (m, 1H), 7.73-7.70 (m, 2H), 7.50 (d, JHH = 8.7
Hz, 1H), 7.34-7.26 (m, 2H), 7.17-7.11 (m, 2H), 6.91-6.82 (m, 3H), 6,14 (d, JHH = 6.1 Hz, 1H),
6.04 (d, JHH =8.3 Hz, 1H).
52
3. Spectroscopic methods
The spectroscopic investigations were carried out in spectrofluorimetric grade acetonitrile. The absorption spectra were recorded with a Perkin-Elmer Lambda 950 spectrophotometer. For the photoluminescence experiments, the sample solutions were placed in fluorimetric Suprasil quartz cuvettes (1 cm path length) and dissolved oxygen was removed by bubbling argon for 20 minutes. The uncorrected emission spectra were obtained with an Edinburgh Instruments FLS920 spectrometer equipped with a Peltier-cooled Hamamatsu R928 photomultiplier tube (PMT) (185−850 nm) and a R5509–72 supercooled PMT for the NIR spectral windows (800– 1700 nm). An Edinburgh Xe 900 (450 W xenon arc lamp) was used as the excitation light source. The corrected spectra were obtained via a calibration curve supplied with the instrument. The photoluminescence quantum yields (PLQY) in solution were obtained from the corrected spectra on a wavelength scale (nm) and measured according to the approach described by Demas and Crosby31 using an air-equilibrated water solution of [Ru(bpy)3]Cl2 (PLQY =
2.8%)32 as reference. The emission lifetimes (τ) were measured through the time-correlated
single photon counting (TCSPC) technique using an HORIBA Jobin Yvon IBH FluoroHub con-trolling a spectrometer equipped with a pulsed NanoLED (λexc = 465 nm) or a SpectraLED (λexc
= 370 nm) as excitation source, depending on the measured emission lifetime, and a red-sensitive Hamamatsu R-3237-01 PMT (185–850 nm) as detector. The analysis of the luminescence decay profiles was accomplished with the DAS6 Decay Analysis Software provided by the manufacturer, and the quality of the fit was assessed with the χ2 value close to unity and with the residuals regularly distributed along the time axis. To record the 77 K luminescence spectra, samples were put in glass tubes (2 mm inner diameter) and inserted into a special quartz Dewar flask filled with liquid nitrogen. Solid samples were prepared by drop casting using a dichloromethane-acetone solution (2:1) containing the poly(methyl methacrylate) (PMMA) matrix with 1% wt. of the complex; the thickness of the films was not controlled. Solid-state PLQY values were calculated by corrected emission spectra obtained from an Edinburgh FLS920 spectrometer equipped with a barium sulphate-coated integrating sphere (diameter of 4 in.) following the procedure described by Würth et al.33 Experimental uncertainties are estimated to be ±5% for τ determinations, ±10% for PLQY, ±2 nm and ±5 nm for absorption and emission peaks, respectively.
53
4. Computational details
Density functional theory (DFT) calculations were carried out using the D.01 revision of the Gaussian 09 program package34 in combination with the M06 hybrid meta exchange-correlation functional.35 The 6-31G(d,p) basis set was selected for C, H and N;36 the small-core relativistic energy-consistent pseudopotentials (PPs) of the Stuttgart/Cologne group was used, along with its triple-ζ correlation-consistent basis sets for the iridium metal centre (ECP60MDF/VTZ basis set).37 All the complexes were fully optimised, without symmetry constraints, in acetonitrile both in the electronic ground state (S0) and in the lowest triplet state (T1) by using the polarisable
continuum model (PCM).38 A frequency calculation was always used to confirm that the stationary point found by the geometry optimisation was actually corresponding to a mini-mum on the potential energy surface (no imaginary frequencies). To investigate the nature of the T1
state, geometry optimisations and related frequency calculations were performed at the spin-unrestricted UM06 level of theory, imposing a spin multiplicity of 3. All the pictures of molecular orbitals and spin-density surfaces were created using GaussView 5.39