ALMA MATER STUDIORUM - UNIVERSITÀ DI BOLOGNA
FACOLTA’ DI INGEGNERIA
CORSO DI LAUREA IN INGEGNERIA CIVILE M
DICAM – Dipartimento di Ingegneria Civile, Ambientale e dei Materiali
TESI DI LAUREA in
CONTEXT SENSITIVE DESIGN IN TRANSPORTATION INFRASTRUCTURES
A CLASSIFICATION OF ASPHALT SURFACING
TEXTURES BASED ON 3D IMAGERY
ELABORATO FINALE DI: RELATORE:
Alessandro Labbate Dott Ing. Cesare Sangiorgi
CORRELATORI: Prof. Ing. David Woodward Dott. Ing. Claudio Lantieri
KEY WORDS:
SMA Skid Resistance Texture Contact area RTMINDEX
INTRODUCTION ... 1
CHAPTER 1 – Tyre/Road interaction: Skid Resistance and Road Texture ... 5
1.1 – INTRODUCTION ... 5
1.2 – FRICTION AND SKID RESISTANCE ... 7
1.3 – PRINCIPLES OF FRICTION GENERATION ... 7
1.3.1 –Longitudinal Friction Principle ... 9
1.3.2 – Transverse Friction Principle ... 11
1.4 – IMPORTANT PARAMETERS FOR ROAD SURFACE ... 13
1.4.1 – Influence of texture on Skid Resistance ... 15
1.5 – THE INFLUENCE OF SURFACING MATERIALS ... 16
1.5.1 – Aggregates ... 17
1.5.2 – Influence of traffic loading ... 20
1.5.3 – Bitumen/Binder ... 21
1.5.4 – Void content... 22
1.5.5 – Paving and compaction of asphalt surfaces ... 22
1.5.6 – Type of surface: asphalt and concrete ... 22
1.6 – THE ROLE OF TYRES IN SKID RESISTANCE ... 24
1.6.1 – Tread pattern ... 25
1.6.2 – Tread depth ... 26
1.6.3 – Tread compound ... 26
1.6.4 – Inflation Pressure ... 27
1.7 – EXTERNAL ENVIRONMENTAL INFLUENCES ... 28
1.7.1 – Rainfall and the influence of water films ... 28
1.7.2 – Other external factors influencing tyre/road interaction ... 31
CHAPTER 2 – Tests to assess Skid Resistance and Texture Depth ... 35
2.1 – TEST TO ASSESS SKID RESISTANCE ... 35
2.1.1 – BS 7941-2:2000 - Surface friction of pavements - Part 2: Test method for measurement of surface skid resistance using the GripTester braked wheel fixed slip device . 2.1.2 – BS 7941-1:2006 – Method for measuring the skid resistance of pavement surfaces – Part 1: Sideway – force coefficient routine investigation machine ... 37
2.1.3 – BS EN 13036-4:2011 - Road and airfield surface characteristics – Test Method. Part 4: Method for measurement of slip/skid resistance of a surface: The Pendulum Test .. 39
2.2 – TEST TO ASSESS TEXTURE DEPTH ... 46
2.1.1 – BS EN 13036-1:2010 - Road and airfield surface characteristics – Test method. Part 1: Measurement of pavement surface macrotexture depth using a volumetric patch technique ... 46
2.3 – TEST TO ASSES ASPHALT WEAR: ROAD TEST MACHINE (RTM) ... 50
CHAPTER 3 – 3D techniques for the evaluation of Texture Depth ... 53
3.1 – INTRODUCTION ... 53
3.2 – THE CONTACT BETWEEN A TYRE AND A ROAD SURFACE ... 54
3.2.1 – Laboratory experience ... 55
3.3 – CHARACTERIZATION OF TEXTURE USING 3D LASER SCANNER ... 58
3.4 – CHARACTERIZATION OF SURFACE TEXTURE USING PHOTOGRAMMETRY ... 63
3.4.1 – Laboratory experience ... 68
3.5 – STEREO-VISION APPLICATIONS TO RECONSTRUCT THE 3D TEXTURE ... 70
3.5.1 – Photo Texture Techniques ... 75
CHAPTER 4 – Experimental Phase ... 79
4.1 – INTRODUCTION ... 79
4.2 – PREPARATION OF THE SAMPLES ... 81
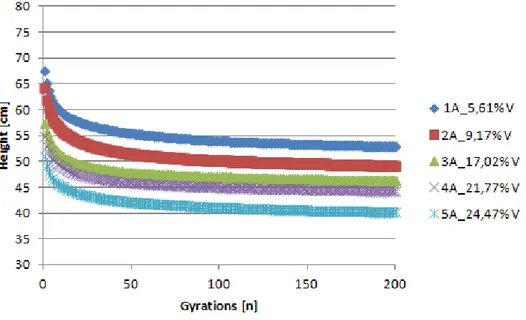
4.2.1 – The giratory compactor machine ... 84
4.2.2 – ELE-Servopac gyratory compactor ... 85
4.3 – MAIN PROPERTIES OF THE SAMPLES ... 86
4.4 – SAND PATCH METHOD ... 92
4.5 – SKID PENDULUM TEST ... 94
4.6 – CONTACT AREA ... 95
4.7 – THE EFFECTS OF TRAFFICKING – ROAD TEST MACHINE ... 101
CHAPTER 5 – Analysis of data ... 103
5.1 – INTRODUCTION ... 103
5.2 – SKID RESISTANCE ... 103
5.3 – TEXTURE DEPTH ... 106
5.4 – RELATIONSHIP BETWEEN SKID RESISTANCE AND TEXTURE DEPTH ... 108
5.5 – CONTACT AREA ... 110
5.6 – RELATIONSHIP BETWEEN CONTACT AREA, TEXTURE DEPTH AND SKID RESISTANCE ... 117
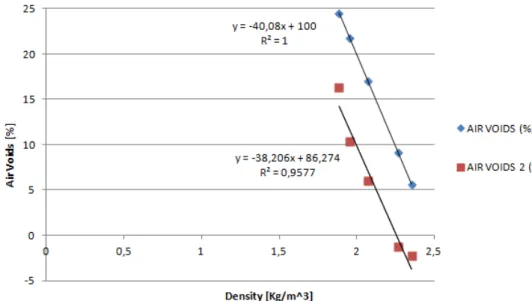
5.7 –THE INFLUENCE OF PRESSURE ON TEXTURE DEPTH AND SKID RESISTANCE 122 5.8 –THE INFLUENCE OF AIR VOID CONTENT ... 130
CHAPTER 6 – Analysis of texture using 3D photogrammetry software ... 135
6.1 – INTRODUCTION ... 135
6.2 – THE USE OF PHOTOGRAMMETRY ... 135
CONCLUSION ... 143
Introduction
INTRODUCTION
Analysing many years of research it becomes apparent that “texture”, both that of the road surface and that of tyres, and the way that they combine in the contact patch, is the most important broad factor which needs to be understood for optimising tyres and road surfaces. This factor, on all its scales, influences the interaction between tyre and road to develop friction; it plays a significant role in noise generation or attenuation and, potentially in tyre rolling resistance. There are also other aspects of road surfaces and tyres, such as the impacts that construction techniques might have on the surface properties that show gaps in current knowledge.
In many areas, the knowledge gaps are associated with inadequate or inconsistent measurement techniques. For example, our understanding of texture and its influence is limited by what can currently be measured and the ability to measure characteristics. For this reason other methods of analysis are required and so it’s useful to consider the problem in three dimensions rather than two. It would enable different or new parameters to be defined that would better predict or explain behaviour. The problem of measurement limitations restricting understanding also applies to surface construction characteristics such as interconnected voids, which may influence noise, water dispersal in the skid resistance context and the durability of performance.
Lack of well-defined measurement techniques is also a serious limitation of understanding the rolling resistance of tyres, especially on real road surfaces. Similarly, differences in ways of assessing passenger-car and truck tyres and their performance are not always well understood.
Over the years there has been a great deal of research relating to the optimization of skid resistance, rolling resistance and noise emissions, and work in this area is continuing. However, the research typically is driven by the different perspectives and interests of various involved groups: the road construction industry, the tyre manufacturing industry, road users and road agencies. Consequently, in individual research projects, optimization has tended to be focused on either road surfaces or tyres but seldom on both. The optimisation of road surfaces was not really affected by the optimisation of tyres
and vice versa. Road surfaces are always tested with specified test methods for the individual properties; tyres are tested on specified surfaces (particularly in accordance with ISO10844).
Therefore, road surfaces are designed to perform optimally in relation to the specific test methods and tyres are optimised to perform on their specified test surfaces.
In practice, interaction between roads and tyres and the factors that affect them are influenced in their turn by road geometry, general traffic levels and the speeds and loads of vehicles.
However, some environmental factors, such as particulates and seasonal effects, have specific impacts on the three surface properties that are also associated with knowledge gaps requiring research to fill them and these are shown in the next chapters.
Currently, texture is measured in one of two basic ways. One of these, the historic approach, is to use a volumetric technique to fill the voids in the surface to provide an estimate of the space available in the texture (the texture depth) which, it is thought, has a primary function of draining water from the tyre/road interface. However, a limitation of this technique is that it does not access all the voids in the surface from this perspective and says little about the smaller component of texture near to the surface that actually makes contact and interacts with tyres.
Over the last 25 years there has been a trend towards measurement of a two-dimensional surface profile of the road surfaces, typically using lasers. However, this technique requires algorithms to convert the discreet height measurements in the profile into parameters to represent the texture and these are proving inadequate to enable researchers and engineers to properly understand the texture. It may be much more helpful not only to improve the profile measurement technique but to extend it to make laminar texture measurements of road surfaces provided that this can be done with the necessary resolution and acceptable speed.
This would allow the different texture wavelengths, texture depth, texture form and their relationships with the three surface properties to be assessed.
Potentially, microtexture, which currently is not measured directly at all, could also be included. The contact patch of the tyre on the surface, and therefore the
Introduction
interaction of the tyre with the surface occurs in three dimensions, not only one line (2D). A 3D approach to measurement and assessment of road surface texture could lead not only to an improved measuring technique but would also follow on to the development and assessment of new parameters to represent aspects of texture that cannot be suggested at the moment because they cannot be measured adequately, if at all.
How tyres respond to the road surface texture is also a significant knowledge gap; it is likely that many other factors could be involved here which currently are not known or well understood. These might include size of the contact patch, localised pressures due to different road surface textures or tyre characteristics and the way the tyre shapes itself to the surface, specific tyre characteristics, vehicle size and mass. Such factors, deriving from both road surfaces and tyres, may have different influences in relation to the three properties which could then be complicated further when differences between wet and dry conditions are taken into account. [1]
In this thesis has been considered how the interaction of a tyre and an asphalt surfacing may be investigated in the laboratory to assess a range of properties ranging from aggregate and mix type, grip, texture, noise and rolling resistance. The interactive properties of any vehicle / tyre / road surfacing combination are constantly changing. The holistic relationship between the many different variables is extremely difficult to model and predict. With unlimited funding and time the interaction between vehicles and the different types of asphalt road surface could be assessed over many years using full scale road trials. However, this ideal is now totally unrealistic.
Laboratory based research needs to relate to observable and measureable performance in the field. Whilst there is a need for the fundamental approach, improved understanding needs to be based on accelerated simulated conditions to provide meaningful data, something that most standardised test methods cannot do as they do not adequately consider how materials and properties change with time. This thesis describe how new types of data might be measured in the laboratory that either relates to or effects the interaction of a tyre and an asphalt surface. The measurements considered include skid resistance, interface mapping and texture.
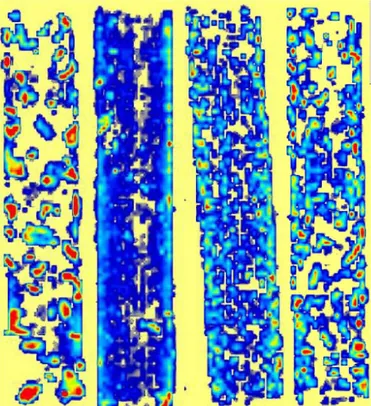
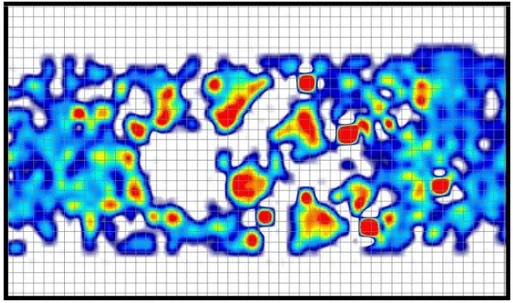
Moreover, the use of 3D models allows much greater insight into surface textures. For example, it may generally be used to highlight areas of a surface potentially at risk due to water entrapment, and the use of software, such as ArcGIS, can help us in predicting the effect of water and of other parameters on durability of asphalt surfacing materials, better than a simple estimation of texture depth could give. [15]
Chapter 1: Tyre/road interaction: Skid resistance and road Texture
CHAPTER 1
:
TYRE/ROAD INTERACTION: SKID RESISTANCE AND ROAD
TEXTURE
1.1 INTRODUCTION:
Acting together, roads and tyres make a vital contribution to road safety but in the process they also have an impact on the environment. The interaction between the tyre and the road surface, provides grip to allow vehicles to manoeuvre, but the same process can also give rise to rolling resistance, with a potential increase in fuel consumption and CO2 emissions. The interactions also
generate noise both in vehicles and in areas close to the road. There are also safety implications for rolling resistance and noise, although these are not related to vehicle control. Vehicle emissions and noise levels have a potential influence on the health of drivers and those living or working near major roads. If road/tyre noise is very low there might be risks to vulnerable road users such as pedestrians who might not be alerted to the approach of a vehicle. This chapter introduces the known main factors associated with road surfaces and tyres that influence skid resistance and road texture. [1]
1.2 FRICTION AND SKID RESISTANCE
Clearly, the provision of adequate grip between tyres and roads is vitally important in helping drivers to be able to travel safely, a fact recognized in the earliest days of research as motor traffic began to increase.
There are three particular situations in which the forces transmitted through the tyres are increased and so the adhesion provided needs to be adequate for a vehicle to be driven safely:
• Under power, when a reaction force between the tyre and the road is needed for the vehicle to accelerate or maintain speed.
• In braking, when forces are developed between the tyre and the road that react against the action of the brakes so that the vehicle slows down.
• While cornering, when reaction against side forces generated in response to steering action enables the vehicle to follow around the curve.
These forces are generated as a result of friction between the tyre and the road. In normal circumstances, the contact patch, the area of the tyre in direct contact with the road, is instantaneously stationary.
However, if the forces required by the manoeuvre exceed the available friction, the contact patch will start to slide over the road surface, a condition known as “slipping”. If too much power is applied when accelerating, the powered wheels may spin freely; if the force on the brakes is too great the wheels may lock, leading to a skid; if lateral acceleration is too great when cornering, the tyre will slide sideways. If acceleration or, braking, are combined with cornering then the combined forces must be “shared” with the available friction, increasing the likelihood of grip being reduced.
Once the tyre is slipping or skidding, full control is lost. In many situations control cannot be recovered in time, if at all, and a crash of some kind is the inevitable result.
When a road surface is dry, the coefficient of friction between a tyre and the road is normally high and adequate for most vehicle manoeuvres. However when the road is wet, the tyre/road friction decreases significantly and becomes much more dependent on the properties of the road surface and the tyre. When the road is wet, friction is not only reduced but also decreases as speed increases. Importantly, sliding friction on a wet road is typically much lower than the friction available just before the tyre starts to slip. It is also important to note that a damp road may also show a marked reduction in tyre/road friction even though it may no longer be raining.
It is important to appreciate the differences between these two concepts since they are often used interchangeably and this can sometimes lead to confusion.
Chapter 1: Tyre/road interaction: Skid resistance and road Texture
The following convention, widely used in the context of road surface characteristics, is therefore used to distinguish between the meanings of “friction” and “skid resistance”.
Friction, in the context of tyres and roads, represents the grip developed by a
particular tyre on a particular road surface at a particular time. The coefficient of friction is a measure of this, defined as the ratio of the load, the force applied in the vertical direction, to the traction, the force resisting movement in the horizontal direction.
Friction is influenced by a large number of parameters relating to the road and the tyre but it is also affected by other influences that may not be directly attributable to them, such as the vehicle suspension, ambient conditions, speed and the presence of localized contaminants (including water).
Skid resistance describes the contribution that the road makes to tyre/road
friction. Essentially, it is a measurement of friction obtained under specified, standardized conditions, generally chosen to fix the values of many of the potential variable factors so that the contribution that the road provides to tyre/road friction can be isolated.
In the context of a crash, or situation that might lead to one, it is the coefficient of friction available at the time and place of the incident that matters. However, for the purposes of building and maintaining roads, it is the initial designed properties of the surfacing and, subsequently, the general condition of the road surface in service that are important. [1]
1.3 PRINCIPLES OF FRICTION GENERATION
The mechanisms of tyre/road friction are not fully understood, but it is widely recognized that there are two main mechanisms involved: molecular adhesion and hysteresis losses, and so the overall friction between tyre and road surface is the sum of these two components.
Adhesion is a surface phenomenon that occurs at the interface between the tyre tread rubber and the road, so this contribution depends on the actual contact area.
Some theories have described adhesion as a thermally activated molecular stick-slip process. During sliding between a rubber and a hard surface, the separate chains on the two surfaces attempt to link together, thus forming a local bond. Sliding causes these bonds to stretch, rupture and relax before new bonds are made. The contribution of adhesion to friction is the sum of the inter-facial shear tension between the tread rubber and the road surface by different islets on the overall contact area, which depend on surface roughness at the microscopic scale.
The hysteresis contribution comes from energy losses due to damping in the rubber bulk when this is deformed as it passes over the aggregate particles in the surface. The internal damping in the rubber opposes its own movement upstream of aggregates and its shape recovery downstream of aggregates, creating an asymmetric pressure distribution on aggregate surfaces. This contribution depends on roughness of the surface at the macro scale.
Figure 1.1 illustrates these two concepts of adhesion and hysteresis.
Chapter 1: Tyre/road interaction: Skid resistance and road Texture
To be effective, the adhesion component needs close contact and thus a clean surface, while the hysteresis component needs cyclic deformation of the rubber and a rough surface. It is argued that, on rough and lubricated surfaces, the friction force derives primarily from the hysteresis contribution, whereas adhesion is dominant when rubber slips on a smooth and clean surface.
There is a slightly different interpretation by Yandell, which is based on the assumption that adhesion does not play a significant part in tyre-road friction, rather that the observed effects can be entirely explained in terms of hysteresis. In this theory, the texture of the road surface is separated into components with different scales. Hysteresis is generated on each of these scales and the total friction is obtained from the sum of the individual contributions.
Yandell and his colleagues showed that predictions based on this analysis, together with measurements of the damping factor of the tread rubber, agree well with locked wheel and sideways force measurements on concrete and bituminous surfaces. [1]
1.3.1 LONGITUDINAL FRICTION PRINCIPLE
For a vehicle travelling in a straight line, when the driver applies the brake, a torque is applied to the vehicle wheels via the braking system. A reacting force develops in the tyre/road contact area. Provided that grip is maintained, the angular speed of the wheels decreases and the vehicle slows down as kinetic energy is absorbed in the braking system.
However, as the braking torque increases, the wheel speed may reduce below the vehicle speed and consequently the tyre slips on the road, generating friction forces in the contact area, due to adhesion and deformation processes, to slow down the vehicle.
In the extreme, the wheel may cease to rotate, known as the “locked” condition, and one area of the tyre slides or skids over the road surface. Longitudinal friction measuring devices try to simulate part of this process, typically by controlling the rate at which the wheel rotates relative to the road speed. This leads to the idea of the “slip ratio” and it is important to appreciate how the longitudinal friction coefficient varies with the slip ratio.
The tyre slip ratio G is defined by the formula:
where:
ω: angular speed of the wheel; R: wheel radius;
V: vehicle speed.
G varies between 0 and 1. For skid-resistance measuring devices, G is generally expressed as a percentage.
Thus, for G = 0%, the tyre speed is equal to the vehicle speed and the wheel is freely rotating; for G = 100%, there is no rotation and the wheel is locked.
The longitudinal friction coefficient LFC varies with the tyre slip ratio as illustrated in Figure 1.2:
Chapter 1: Tyre/road interaction: Skid resistance and road Texture
It can be seen that, initially, friction increases as the slip ratio increases but it reaches a maximum value before decreasing as the slip ratio continues to increase until the locked wheel state is reached.
This variation can be explained by the movement of the tyre treads in the tyre/road contact area changing from a largely shear phase to a mainly slipping phase.
The maximum value of LFC denoted by Gmax, sometimes known as “peak friction”, typically occurs at a slip ratio between 15% and 20%. [2]
1.3.2 TRANSVERSE FRICTION PRINCIPLE
In a bend, the driver uses the steering system to turn the vehicle’s front-wheels so that there is a difference between the vehicle direction and the wheel rotation-plane.
The induced angular difference is known as the slip angle. It induces tyre/road friction, which in turn generates a centripetal force opposing the centrifugal force exerted on the vehicle in the bend, allowing the vehicle to follow round the curve. Just as with longitudinal friction, when as the braking force increases the wheel starts to slip over the road surface, so in the transverse friction situation if the centrifugal force exceeds the friction force available, the tyre will slip sideways, even though it continues to rotate.
Transverse-friction skid resistance measuring devices try to simulate this process. This leads to the concept of the “slip angle” and it is important to appreciate how the transverse, or sideway, friction coefficient varies with the slip angle. The slip angle is the angle formed by the wheel’s plane of rotation and the tangent to the wheel’s path. On a skid resistance test device the wheel’s path normally follows the direction of travel of the test vehicle.
Figure 1.3 - Illustration of slip angle
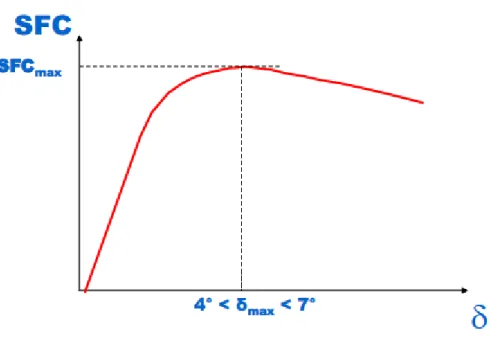
The sideways friction coefficient SFC varies with the tyre slip-angle as illustrated in Figure 1.4:
Chapter 1: Tyre/road interaction: Skid resistance and road Texture
It can be seen that the friction increases at first as the slip angle increases, reaching a maximum before decreasing as the slip angle continues to increase. This process is analogous to the variation observed in longitudinal braking, as the tyre tread in the tyre/road contact area moves from a shear phase to a slipping phase.
Typically, the maximum value of SFC occurs at a slip angle, denoted by δmax, between 4° and 7° for a light vehicle, and between 6° and 10° for a truck. [2]
1.4 IMPORTANT PARAMETERS FOR ROAD SURFACE
As we have seen, the interactions between the tyre and the road that affect skid resistance, rolling resistance and noise emission all derive from the way in which different parts of the tyre deform to make intimate contact with the road, and then are released again as the tyre rotates further or moves on.
The surface profile of a road with which tyres interact is often described in terms of its “surface texture”. In order to describe the components of texture, [1] that is defined as the deviation of actual surface from an ideal reference plan, in relation to the factors that they influence, [3] the profile is divided into different texture scales, based on wavelength ranges. Figure 1.5 illustrates the “irregularity ranges” that are typically used to describe these texture scales and the different factors, including skid resistance, rolling resistance and noise that are influenced by them.
Figure 1.5 - Texture wavelength influence on tyre-road interactions
Although their influence varies, it can be seen that essentially there are just three main parameters relating to the road surface that affect the three main factors in this study. They are:
• Microtexture, which is formed by the microscopic asperities on the surface of aggregate particles and fine grains in the road surfacing material. [1] It’s constituted by wavelenght values inferior to 0,5 mm and profile peak-to-peak width values between 1 µm and 0,2 mm, which is the result of roughness of individual aggregate items used in road surface material and is therefore tightly connected to the mineralogical composition of an aggregate. [3]
• Macrotexture, which is formed by the shape of and spaces between the larger aggregate particles (or grooves formed in concrete) at the surface of the road. [1] It’s constituted by wavelenght and peak-to-peak width values between 0,5 mm and 50 mm and 0,2 and 10 mm, respectively, depending on mixture size range. [3]
• Megatexture, which arises from variations in the surface profile on a larger scale. It often appears as waviness and includes wavelengths between 50 and 500 mm and peak amplitudes from 0.1 to 50 mm. These wavelengths are of the same order of size as the length of the tyre/road contact area.
Chapter 1: Tyre/road interaction: Skid resistance and road Texture
There are no boundaries between these categories; one merges into the next. Figure 1.6 illustrates the range of textures that could be encountered on roads. It is macrotexture and microtexture that have the greatest influence on skid resistance and tyre/road friction. [1]
Figure 1.6 – Texture
1.4.1 INFLUENCE OF TEXTURE ON SKID RESISTANCE
The effects of texture scales on the two basic mechanisms of tyre/road friction can be summarized as the adhesion component being highly sensitive to microtexture, whereas the hysteresis component is mostly sensitive to macrotexture.
Although skid resistance is generally high on dry and clean road surfaces, in wet conditions road surface texture on both the micro- and macro-scales is essential.
The surface must provide sufficient macrotexture to assist effective drainage of water from the road/tyre interface and increase the zone of potential dry contact at the rear of the tyre/road contact patch. However, drainage alone is not sufficient to provide good skid resistance; the water film can only be broken if
the road surface has a good microtexture on which localized high pressures are built up.
The texture of the surface also influences how skid resistance varies with speed. As is normal practice in studies of skid resistance, a standardized smooth tread tyre was used in the tests to separate the effect of road characteristics from those of the tyre, such as tread pattern and depth. A smooth tyre represents the worst case in practical terms.
It can be seen from the results of many studies that all texture scales have a significant effect on tyre/road friction. Both the microtexture and the macrotexture of a road surface should be high in order to increase adhesion, hysteresis and water drainage.
Microtexture affects friction over the range from almost zero up to the maximum possible friction and is important at all speeds. Macrotexture has some influence on friction at low speeds, albeit to a much lesser extent than microtexture, but is the dominant factor at higher speeds on wet roads.
However, as yet there are limitations to the reliable modelling of the influence of macrotexture, partly due to the ways in which this factor is quantified and measured.
Microtexture currently cannot be measured quantitatively. Work is in hand at many institutes to study this but measurements made with low-speed devices such as the pendulum tester or dynamic friction tester are often used as surrogates. [1]
1.5 THE INFLUENCE OF SURFACING MATERIALS
In order to produce road surfacings with effective texture, it is necessary to know how the composition of the asphalt or concrete influences the development and maintenance of skid resistance.
Parameters of the surfacing material that will influence the texture and therefore the skid resistance include:
1) Aggregates. 2) Bitumen. 3) Void content.
Chapter 1: Tyre/road interaction: Skid resistance and road Texture
4) Paving and compaction of asphalt surfaces. 5) Texturing of concrete surfaces.
6) The types of surfacing - Asphalt / Concrete .
As well as providing appropriate levels of microtexture and macrotexture when new, it is important that the surfacing can maintain appropriate levels during its service life. This will depend on various factors, including:
• The aggregates’ ability to resist polishing and the associated loss of microtexture when trafficked.
• Resistance to wear that could lead to reduced macrotexture as surface aggregate particles are worn down or concrete brush-marks are worn away. Microtexture may also be affected as aggregate particles in the body of the surfacing material with less polishing resistance become exposed at the surface.
• The ability of the surface to maintain its structural integrity and hence macrotexture. This is important on modern asphalt materials in which loss of some aggregate particles from the surface can lead to a gradual degradation of the surrounding material as unsupported particles are broken away. Deformation or flushing of bitumen could lead to the embedment of surface chippings with loss of macrotexture (or even, in the extreme, the covering of microtexture). [1]
1.5.1 AGGREGATES
The shape of the various asperities on the road must be taken into account in order to explain the main differences in the friction performance of different types of road surfacing materials. Depending on how the surface is made, patterns of texture can vary widely, both at the micro- and macrotexture scales. On asphalt surfaces these may range from closely-packed small particles through larger individual chippings spaced out from one another with relatively smooth asphalt mortar in the spaces between them. The aggregate particles may be orientated differently, with pyramidlike angles or, conversely, essentially flat surfaces uppermost. The natural properties of the aggregate after crushing and grading will have an influence on these factors. A high proportion of
naturally-flaky particles, for instance, will tend to present flatter faces to the surface, whereas more cuboid particles are more likely to present an angled edge. On concrete surfaces the ways in which grooves and ridges are formed can create a different range of texture patterns, including repeating patterns that may be transverse or longitudinal compared with the direction of traffic movement.
In relation to microtexture and, in particular, its ability to break through a water film, it is reasonable to assume that aggregates with sharp asperity peaks produce higher localized pressures in the contact patch and that these are likely to be more efficient at breaking the last slight water film than aggregates with rounded asperities. Another advantage of sharp
asperities is that the total load on a tyre could be carried on quite a small area; thus, only a small area need be cleared of water before much of the load is supported upon a dry road surface.
The shape of the aggregates used can be assessed by the shape index or flakiness index.
Flaky aggregates tend to lie flat during the paving process and so make a relatively small contribution to macrotexture. For this reason, it is better to use coarse aggregates with a low shape or flakiness index and this is often taken into account in different national regulations or specifications.
Angularity of the aggregates is only relevant for the sand (0.063 – 2 mm) within the mix, because for the coarse aggregates in surface layers crushed materials have to be used. This property of the sand is determined by the flow coefficient. Crushed sand gives a higher value of the flow coefficient and the friction coefficient increases with the crushed sand content. This is currently taken into account in different national regulations.
As well as being affected by particle shape, macrotexture is controlled to a certain degree by the size of the aggregate particles. On surface dressings and most asphalt surfacings, the macrotexture, in particular the drainage paths, is determined by the spaces between the particles at the surface, the so-called “positive” texture. On porous asphalt and Stone Mastic Asphalt (SMA) thin surfacings, macrotexture is produced by voids between adjacent particles below their upper surfaces, so-called “negative texture” and is controlled by the way the particles pack together in the mix.
Chapter 1: Tyre/road interaction: Skid resistance and road Texture
The size of aggregates used in surfacings influences skid resistance, with smaller sizes giving greater skid resistance. This has been observed in a number of experiments. For example it has been shown that increasing the percentage of crushed faces increases the skid resistance, and is important for high-speed skid resistance while chip grade is more important at low speeds. In controlled environmental conditions, skid resistance at any time is primarily a function of the geological properties of the aggregates and the traffic loads placed upon them. The type of aggregate used will determine the microtexture of the surfacing and its ability to maintain that microtexture under loading from traffic and as a result of weathering.
Under traffic loading high stresses are developed at the tips of the asperities which combined can cause the individual particles to polish, particularly if fine surface detritus is also present. Thus the main engineering quality required from an aggregate to be used in a pavement surfacing is to be resistant to the polishing and abrasive actions of traffic. Rocks, which contained minerals of sufficiently different hardness or which were friable, consisting of grains rather insecurely cemented together, were found to give high polishing resistance. The microtexture on an aggregate that is exposed in the surface of a road is affected by the following factors:
- Polishing.
- Differential wear. - Weathering.
The term “polishing” describes any general smoothing of an aggregate, including rounding that takes place by abrasion. This phenomenon tends to smooth aggregates by reducing their angularity and microtexture and is caused by the action of tyre carrying detritus and grinding away material from the exposed aggregate. The severity of the abrasive action is related to the density of the traffic and the petrographic characteristics of the aggregates:
- Degree of hardness and proportion of hard minerals.
- Proportion, orientation and distribution of cleaved minerals. - Grain size
- The nature of the inter-granular bond.
- Degree of liability to chemical alteration of the mineral content.
Where aggregate particles consist of agglomerations of several minerals with different resistance to wear, rough texture can remain as the particles are worn by traffic. Some minerals remain in high relief, whilst others are worn down to a lower level. This phenomenon can be expected where the minerals are of different hardness or toughness.
This will tend to prevent general smoothing by recreating a microtexture.
The aggregate used in a road surfacing has a progressively greater influence on skid resistance as the surfacing ages. The aggregates start with good microtexture but this is lost over time and aggregates with good resistance to polishing can be expected to provide higher levels of equilibrium skid resistance. In order to help in the selection of appropriate aggregates, accelerated polishing tests have been developed that can be used in the laboratory to assess likely performance. The most widely-used of these is the Polished Stone Value (PSV) test. [1]
1.5.2 INFLUENCE OF TRAFFIC LOADING
On opening a surface to traffic, the skid resistance can alter for the first year or two as a result of traffic action before settling to an equilibrium value around which the skid resistance will fluctuate slightly. Once equilibrium has been reached, the skid resistance at any time may vary as a result of seasonal variation and a significant change in traffic level may alter the equilibrium level. On a new asphalt surface, the microtexture can be masked by bitumen when the surface is initially laid and for a period afterwards until the effects of trafficking and weathering remove the excess bitumen to expose the microtexture. This phenomenon, often referred to as “early life skid resistance”, has been investigated in some depth in recent years.
The rate at which skid resistance changes in this period depends upon the type of surfacing material, the trafficking and climatic conditions.
Chapter 1: Tyre/road interaction: Skid resistance and road Texture
Particularly on more lightly-trafficked roads, the process can sometimes dominate the skid resistance performance of a surfacing throughout its life.
After the initial period, the aggregates are gradually exposed and actual polishing of the aggregate particles begins, gradually reducing skid resistance to the equilibrium level. [1]
The effect of trafficking can be evaluated in laboratory conditions using the Road Test Machine (RTM) apparatus.
1.5.3 BITUMEN/BINDER
The amount of bitumen used in the asphalt mix can also have some influence on skid resistance. High binder contents will tend to produce a low void content, which could lead to bleeding: this may have resulting negative effects on skid resistance as a result of loss of microtexture, as the bitumen covers the aggregate, and on macrotexture as the filling of surface voids reduces macrotexture.
There is no evidence that suggests that the type of bitumen used in the asphalt mix has a noticeable effect on skid resistance. However, for carriageways with heavy traffic it is better to use bitumen with higher viscosity to ensure the durability of the surface and therefore, indirectly, its skid resistance.
Practical experience shows that the use of polymer modified bitumen (PMB) tends to produce higher levels of skid resistance compared to standard bitumen. This could be due to the higher viscosity of PMB and therefore a higher ring-and-ball softening point, resulting in a pavement that has a higher resistance to permanent deformation at high temperatures.
In contrast, however, if bitumen with higher viscosity or polymer modified bitumen is used, it may take much longer for the bitumen to be removed from the aggregate in the initial period after laying, especially if there is less traffic. This can have two influences: one is adverse, in which the bitumen blinds the microtexture and reduces skid resistance, especially as speed increases; the other is favourable because the presence of the bitumen can delay the onset of the polishing of the aggregate so better microtexture is maintained for longer. [1]
1.5.4 VOID CONTENT
The void content and other volumetric values of the asphalt mixture are only relevant for dense rolled asphalt.
Different studies and practical experience show that, with lower ‘void content’ (V) and therefore rising ‘voids filled with bitumen’ (VFB) at the surface, the skid resistance tends to fall because of loss of micro and macro texture. A critical range of V is about 2 Vol.-% and VFB about 90%. [1]
1.5.5 PAVING AND COMPACTION OF ASPHALT SURFACES
The appropriate usage of the paver and the roller compactor could avoid negative effects on skid resistance of paving and compaction to the surface. The effects are likely to vary depending on the specific material being laid, but examples found in some countries could include segregation in the horizontal direction caused by inappropriate use of the paver and in the vertical direction by the selection of an inappropriate use of the roller. [1]
1.5.6 TYPE OF SURFACE
Asphalt
There are many different types of asphalt surfacing, as well as applied treatments such as surface dressings, used on European roads. These can have markedly different characteristics in the ways in which micro- and macro-texture are provided at the surface. Therefore, the skid resistance that a road will provide is affected by the type of surfacing. The finished surface will have different proportions of coarse and fine aggregate exposed at the surface to interact with tyres through which the skid resistance forces are transmitted. Studies have shown that for asphalt mixtures with a high proportion of fines in the contact area, such as some Asphalt Concrete materials, the fines themselves contribute to microtexture, and hence skid resistance. In surfacings in which coarse aggregate predominates in the contact area, high-PSV
Chapter 1: Tyre/road interaction: Skid resistance and road Texture
aggregate (typically, PSV > 50) is needed to provide and maintain microtexture. In some countries, in the UK for example, that generally use surfacings with a high proportion of coarse aggregate at the surface, different levels of PSV are used to deliver different levels of skid resistance depending on expected traffic levels. Nevertheless, in surfaces which are not gap-graded, it is necessary to use coarse aggregate with adequate PSV since both coarse and fine materials contribute to microtexture.
Concrete
Portland cement concrete surfaces behave differently from asphalt surfaces in the way in which microtexture and macrotexture, and hence skid resistance are developed initially and how this changes over time. The actual composition of the concrete has a relatively small impact on skid resistance at first because the running surface is created by the mortar on the surface and the way in which that has been formed to provide texture. However, as the surfacing wears over time, this initial texture can change.
In the worst cases, the internal structure may be exposed at the surface and consequently influences skid resistance.
The microtexture of a concrete surface is provided initially by the sand grains in the mortar. These are naturally at the microtexture scale and the polishing resistance can be important, especially if crushed-rock fines are used.
Over time, the upper surface can wear away to expose the coarse aggregate in the bulk of the material and the polishing resistance of the aggregate then becomes of great significance in terms of skid resistance, especially if this is associated with a naturally-low texture depth.
The macrotexture of concrete roads is determined by their structure, which can be broadly divided into two categories:
• Isotropic, in which the macrotexture is formed by aggregate particles deliberately exposed at the surface (e.g. exposed aggregate concrete, porous concrete).
• Anisotropic, where the macrotexture is formed by ridges or grooves applied to the surface, either while the cement is still wet or plastic or after it has hardened.
In Germany, for example, where the composition of cement concrete surfaces can vary more than elsewhere in Europe, it has been found that using a higher stability concrete does not necessarily lead to greater durability of the texture produced. Furthermore, a loss of texture geometry does not have to lead to a loss of skid resistance, provided that the mortar layer contains a high proportion of fine aggregate and is of suitable thickness, perhaps 0.5 to 1.0 mm. However it has also been found that as well as the composition of the mortar, its consistency can also have an impact on measured skid resistance. [1]
1.6 THE ROLE OF TYRES IN SKID RESISTANCE
Skid resistance is described as the “Characterization of the friction of a road surface when measured in accordance with a standardized method” and does not therefore relate to the contribution that different tyre types or properties make to road/tyre friction.
The ability of a tyre not to skid on a surface is sometimes referred to as “wet traction” or “wet grip”. Tyres are a rotationally symmetric composite that consists of a complex rubber compound with about 200 constituent parts which is reinforced by different layers of textile or steel fabric. Tyres have to support wheel loads but they also transfer torques that enable the vehicle to accelerate and decelerate and transfer lateral forces in order to steer.
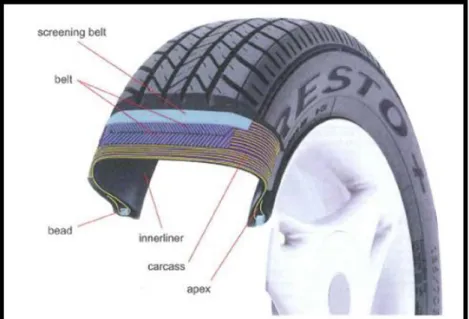
There are different types of tyre design but the predominant type for cars and many trucks is the radial tyre. Radial tyres are built on a carcass of steel cords running radially from bead to bead. A stabilizing belt of crossed steel cords surrounds the carcass. The rubber tread, which is the part of the tyre that is contact with the road surface, is bonded to the belt and sculpted with a tread pattern.
Chapter 1: Tyre/road interaction: Skid resistance and road Texture
Figure 1.7 – Tyre section
The two parts of the tyre that have the main influences on skid resistance, rolling resistance and noise are the carcass and the tread. The design of the carcass, its inflation pressure and aspect ratio all have an influence on the way in which the tyre rolls over the surface and responds to changes in surface characteristics such as megatexture, or changes in driving pattern such as braking or cornering.
In the case of the tread, which is the part of the tyre through which frictional forces are transmitted and which is distorted by the road surface, there are a number of particular aspects that influence our main topics in different ways. [1]
1.6.1 TREAD PATTERN
We have seen that a major contribution that road surface macrotexture makes to road/tyre friction is removal of water from the contact area. The tyre also contributes to this through its tread pattern. This provides channels for water to escape, with the aim of establishing some localized dry contact between the tread and road surfaces. The role of the tread pattern is extremely important on surfaces that have low drainage capacity, i.e. low macrotexture.
Today, there are many different designs of tread pattern but most consist of circumferential and zigzag rib patterns. Investigations were undertaken in the
1960s to determine whether particular tread patterns produce better performance on wet surfaces, but at that time no one pattern design seemed to show significantly better performance than others. [1]
1.6.2 TREAD DEPTH
The effect of tread depths on skid resistance has also been studied. From these various studies, it appears that on surfaces with relatively high macrotexture, the influence of tread depth on the tyre is less important until water depths become high.
Studies, have demonstrated clearly that macrotexture is important but that increasing it markedly beyond a certain level, about 1.2 mm TD has been suggested gives no additional benefit. Therefore, on road surfaces that are already above this level in macrotexture terms, the contribution of tyre tread is small in terms of increased grip. However, on surfaces with inherently low texture depth, the contribution made by the tyre tread becomes a much more significant component of the tyre/road friction process, especially at higher speeds with greater water depth.
However, on wet surfaces, an increase in tread depth resulted in higher friction values. [1]
1.6.3 TREAD COMPOUND
Tread rubber is a viscoelastic material. The term viscoelasticity is applied to materials which are neither ideal elastic solids nor viscous liquids but posses characteristics which are typical of both. On a stress against strain curve, the loading and unloading parts of a cycle have different slopes that are due to energy loss in rubber with changes in the storage and loss modulus of the rubber; this is what gives rise to the hysteresis effect.
It is established that a large part of friction between rubbers sliding over a rough lubricated surface comes from energy losses in the rubber and that the lower the rubber resilience is, the greater the tyre wet grip is. [1]
Chapter 1: Tyre/road interaction: Skid resistance and road Texture
1.6.4 INFLATION PRESSURE
It is clear that changes in loading and inflation pressure will alter the dimensions and shape of the contact area. This is potentially important since this will determine the duration of the contact between each element of the tyre and the road, and so will have an effect on the water film variation. However, tests carried out in normal conditions, with patterned tyre and textured surface, showed that relatively large changes in inflation pressure had hardly any effect on tyre/road friction; its effect was low compared with road macrotexture and tyre tread depth.
Other investigations have shown the same for wet surfaces, where the inflation pressure has no effect on friction value, even if the tread depth increases.
However, on dry surfaces the friction value rises, when the inflation pressure decreases, even with an increase in the tread depth, and this reduction in friction value can be explained by the reduced contact area that results from a higher inflation pressure, which leads to higher contact pressure.
On wet surfaces, however, it seems that the influence of the changes of the inflation pressure and therefore the inhomogeneous contact pressure are in balance. This may occur because on wet surfaces the dry area through which the contact pressure acts to develop adhesion is already a relatively small part of the tyre contact patch and so is less sensitive to the overall change in contact area as a result of inflation pressure changes. [1]
1.6.5 TYRE TYPE
Tyres are essentially of two general types: heavy goods vehicle (HGV) tyres and passenger car tyres. Car tyres can also be divided into summer and winter tyres, with different rubber compounds and tread patterns chosen to reflect the different conditions. Winter tyres are not always used in countries that do not experience great extremes between summer and winter conditions or in which the extreme conditions are not over prolonged periods.
Heavy vehicles use different tyres on different axles according to their purpose. Tyres on the drive axles usually have a traction profile to give grip for power transmission, whereas tyres on the steering axles have a longitudinal profile.
Figure 1.8 – Tyre types
The different tyres on HGVs, with their various profiles, influence the braking distance of these types of vehicle. The tyres on the power transmission axles with a traction profile have approximately the same braking distance as the tyres on the steering axles with a longitudinal profile. However, the behaviour of braking distance in relation to the tyre width is inconsistent; sometimes the braking distance rises and sometimes it falls with an increase in tyre width. [1]
1.7 EXTERNAL ENVIRONMENTAL INFLUENCES
1.7.1 RAINFALL AND THE INFLUENCE OF WATER FILM
When a road is clean and dry, high levels of tyre/road friction are generated whatever the vehicle operating conditions; it is water on the surface during and after rainfall that is the main factor leading to reduced friction. Various factors relating to the road and the tyre and other influences such as vehicle speed then affect the actual level of friction achieved in a particular situation.
Chapter 1: Tyre/road interaction: Skid resistance and road Texture
The role of the water itself is primarily as a medium that separates the rubber of the tyre from the microtexture of the road by acting as a lubricant.
A wedge angle is created between the tyre and water ahead the contact area. This occurs because of the change in momentum of the water as it is pushed ahead of the tyre by the rolling surface of the tyre.
This phenomenon creates a hydrodynamic pressure that increases with the square of the vehicle speed. A tread element which comes into contact with the road as the tyre is rolling must first squeeze out the film of water ahead of the contact area before it can make contact with the road surface asperities in the remainder of the contact patch. The real areas of contact between tread elements and the road occur only towards the rear of the contact patch. At any moment during the tyre movement, the tyre load is supported partly by the water trapped in the contact patch and partly by the road surface asperities that are in direct contact with the tyre tread. The greater the proportion of dry contact, the greater the tyre/road friction will be.
The contact patch can be divided into three zones with different proportions that range from wet to almost dry. These zones are generally explained as follows:
Figure 1.9 - Three zones in the tyre/road contact patch
• Squeeze-film zone (or Sinkage zone or Zone A): Under wet conditions, the forward part of what would normally be considered the contact area under dry conditions floats on a thin film of water, the thickness of which decreases progressively as individual tread elements traverse the contact area. Since the
tyre, water film, and the road surface have virtually no relative motion in the contact area, the tread elements in effect attempt to squeeze out the water.
• Transition zone (or Draping zone or Zone B): The transition zone begins when the tyre tread elements, having penetrated the squeeze-film, commence to drape over the major asperities of the surface and to make contact with the lesser asperities.
• Actual contact zone (or Dry zone or Zone C): This is the region where the tyre tread elements, after draping, have attained an equilibrium position vertically on the surface. This zone occupies the rear portion of the contact area.
The lengths of these regions depend on vehicle velocity and relate to water drainage time. At low speeds, the contact time is long, and there is ample time for water film to be expelled, thus allowing a large actual contact zone to develop with a resulting high level of friction.
When speed increases, the time available for water to be expelled from the interface becomes shorter and consequently the expulsion of water is less complete, the actual contact zone is smaller and friction is lower.
Increasing speed will decrease the available drainage time so much that the squeeze-film zone is extended, ultimately to the point where it occupies the whole contact length. This situation corresponds to the viscous hydroplaning limit. At such a speed, the hydrodynamic pressure is less than the wheel load. Further increase in speed moves the situation to the point that corresponds to dynamic hydroplaning, where the hydrodynamic pressure balances the normal wheel load and the water occupies the whole contact area. In this extreme situation the tyre is effectively lifted off the road and all grip and steering control are lost. However, normal road surface are never smooth, so the contact area is usually broken up into discontinuous areas, either by the texture of the road or by the texture of the tread pattern of the tyre. This increases the speed needed for hydroplaning to occur. Nevertheless, in practice, it is not at all necessary to have a flooded road surface for viscous hydroplaning to occur, and the slightest film of water may be sufficient to make skidding possible.
Chapter 1: Tyre/road interaction: Skid resistance and road Texture
Instead of determining water drainage time, Horne and Buhlmann proposed an alternative method for determining the available friction at any speed that takes the road texture directly into account. This method describes the water removal rate in the squeeze film and transition zones. The relative drainage times from both zones are expressed in terms of pavement drainage coefficients, Cmac and Cmic. It is Cmac that determines the percentage of the tyre footprint in the squeeze-film zone. Since in this area the dynamic effect of water predominates, the removal rate is dependent upon bulk channel flow, which is determined by the amount of road surface macrotexture in the case of a smooth test tyre. Cmic determines a percentage of the tyre footprint that set the relative size of the transition zone. Unlike the squeeze-film zone in which bulk water is removed, fluid viscous forces prevail in this region. Since localized high contact pressures are required to penetrate and break this viscous film, this coefficient depends on the road surface microtexture.
The film thickness decreases rapidly with time as soon as it enters in contact with the tyre. Thus, the differences in the initial thickness of the water films are small importance. Experimental investigations at the Road Research Laboratory in the UK in the late 1960s confirmed that the main skidding problem on roads is the lubricating effect of a relatively thin water film, of about 3 to 4 mm. Based on experimental investigations, Bohdan et al proposed a mathematical relationship between water film thickness and skid resistance with a form that responds in the same sense as the RRL results.
1.7.2 OTHER EXTERNAL FACTORS INFLUENCING TYRE/ROAD INTERACTION
There are also other external environmental factors that also have an influence in the real world of in service roads and tyres travelling on them.
Over time, microtexture is polished by the action of the repeated passage of vehicle tyres, especially those of heavy vehicles. This leads to a gradual reduction in skid resistance as the road ages until an equilibrium value is reached. The extent to which a surface will polish, and hence the equilibrium skid resistance achieved, depends on both the level of traffic and the ability of
the aggregate to resist polishing. The effect is also influenced by other stresses such as braking and cornering forces, so an aggregate may provide different levels of skid resistance depending on where it is used.
Generally, the greater the polishing resistance of the aggregate, the better the microtexture and the better the skid resistance will be. Conversely the greater the traffic level, the greater the polishing and the lower the skid resistance will be.
On very lightly trafficked roads, it may take many years for the equilibrium skid resistance to be reached. On heavily trafficked roads this may happen in as short a time as six months to a year.
It has been found that, especially in temperate climates such as in much of western and central Europe, there is a marked variation in skid resistance (and consequently in road/tyre friction) throughout the year and from one year to the next. Typically, skid resistance is at its lowest in summer and higher in winter. This cyclical effect is known as “seasonal variation and this process can be explained as follows. Initially, the skid resistance on a new road is high because the aggregate is unpolished. During the summer period, fine deposits on the surface act as a polishing medium, leading to a reduction in the microtexture. However, in winter, frost action and more frequent rainfall mean that the deposits are coarser and so the microtexture is roughened. Initially, the polishing process dominates and the skid resistance gradually falls to the equilibrium level. Once reached, the skid resistance will remain at this same general level but, depending on the balance between summer polishing and winter roughening, it will vary from year to year. A change in traffic will also alter the balance of the polishing cycle and the equilibrium level may then increase (lighter traffic) or decrease (heavier traffic).
While seasonal variation is a significant phenomenon in the study of skid resistance, and must be taken into account in any standards for roads based on skid resistance measurements, it is not strictly a parameter of either the road or the tyre. Rather, it reflects in part the way in which the road responds to the effects of traffic and weather over time.
The presence of ice and snow on the road surface primarily impacts on tyre/road friction. By covering the surface of the road with a slippery film, the
Chapter 1: Tyre/road interaction: Skid resistance and road Texture
normal frictional characteristics of road surfaces are masked and the tyre has to interact with ice.
If the ice or snow has a water film on its surface then clearly it becomes very slippery indeed. However, when it is dry, for example on recently-fallen snow, reasonable levels of grip may be available.
Salt or other de-icers may be spread on the road during winter maintenance operations to counteract the effects of ice formation. Some of these might have an adverse effect on skid resistance but recent research in the UK suggests that the effects, if any, are negligible and preferable to an icy road.
During long, hot, dry spells, especially in summer, deposits of dust, oil and rubber can build up on the road. When it next rains, at first these deposits create a slippery film on its surface that has a worse effect on friction than water alone. Once sufficient rain has fallen, the deposits are washed from the surface but for a short time they are potentially hazardous. This is an important factor of which drivers need to be aware but it has little directly to do with the properties of road surfaces and tyres.
Temperature itself does not directly influence the skid resistance of roads but high summer temperatures and frosty conditions can have an influence on the deterioration mechanisms of road surfacing materials that then affect their performance characteristics.
There are also small effects due to temperature changes that can influence tyre rubber characteristics and consequently affect friction, or skid resistance measurements. [1]
Chapter 2: Tests to assess Skid Resistance and Texture Depth
CHAPTER 2:
TESTS TO ASSESS SKID RESISTANCE AND TEXTURE
DEPTH
2.1 TEST TO ASSESS SKID RESISTANCE
2.1.1 BS 7941-2:2000 - Surface friction of pavements - Part 2: Test
method for measurement of surface skid resistance using the GripTester braked wheel fixed slip device
This British Standard describes a method for determining the skid resistance of a surface using the GripTester continuous reading braked wheel fixed slip device.
The method is applicable to the following: - highways: surfacings;
- highways: horizontal signs; - airport runways;
- flight decks; - footways;
- pedestrian precincts;
- test panels of surfaces intended for any of the above.
The method is for measurement of skid resistance along a continuous surface on external paved surfaces or indoors. Test speeds can vary from 5 km/h to 130 km/h depending on the application. The measured values can be affected by the test speed.
The GripTester is a device developed by Findlay Irvine Ltd in the United Kingdom, initially for use on helipads but now widely used in many countries on airfields and roads. The device operates on the longitudinal friction principle and is a trailer with two running wheels, called the “drive” wheels, and a single small test wheel.
The wheel dimensions are similar to those of a “go-kart” wheel (Figure 2.1). It can also be configured to be pushed manually for low speed operation in confined areas.
Figure 2.1 – Grip Tester
GripTester measures LFC using a small test wheel operating at fixed slip ratio of 15%.
The test wheel is mounted on a stub axle and is mechanically braked by a fixed gear and chain system linking it to the drive wheel axle.
The wheel slips as it is towed along the wetted pavement surface at a constant speed and the slipping force and vertical load are both measured. The static load on the test wheel is (250 ± 30) N when towed or (260 ± 30) N when used in push mode. In the latter case a small water container is mounted on the device itself, adding to the load.
During operation, the stub axle becomes elastically deformed by the horizontal drag and vertical load forces acting on the test tyre. Two strain gauge bridges
Chapter 2: Tests to assess Skid Resistance and Texture Depth
on the stub axle continuously measure the horizontal drag and vertical load forces. The two drive wheels are mounted on the main axle, which also carries a toothed wheel. A proximity sensor generates signals for distance recording. For normal wet road testing, water is deposited in front of the test tyre from a water tank fitted with a control valve. A water nozzle is mounted directly in front of the test wheel delivering a controlled amount of water to the road surface. In towing mode, water flow rate is further controlled by a pump and may be monitored with a flow meter.
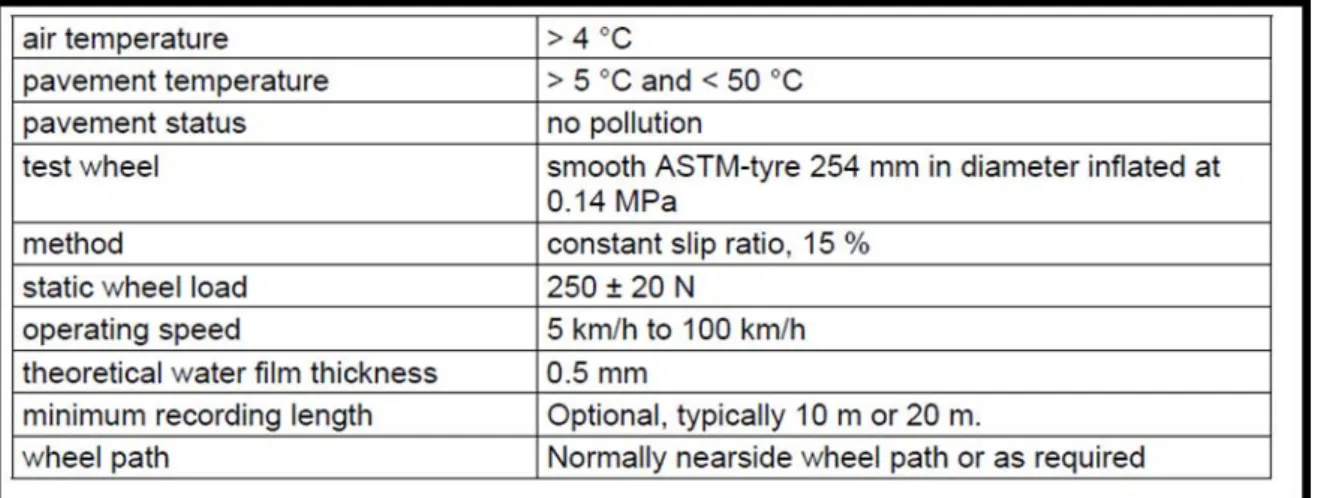
The standard test-conditions for the GripTester are listed in Table below: [2]
Table 2.1 - The standard test-conditions for the GripTester
2.1.2 BS 7941-1:2006 - Methods for measuring the skid resistance of pavement surfaces – Part 1: Sideway-force coefficient routine investigation machine
This British Standard describes a method for determining the wet-road skid resistance of a surface using the sideway-force coefficient routine investigation machine (SCRIM). The method provides a measure of the wet-road skid resistance properties of a bound surface by measurement of sideway-force coefficient at controlled speed. The method has been developed for use on roads but is also applicable to other paved areas such as airport runways.
The SCRIM was originally designed in the UK by the then Road Research Laboratory and has been manufactured under licence by WDM Limited since
the 1970s. The device operates on the transverse friction principle and uses special narrow test wheel which set at an angle to the direction of travel. The wheel is lowered on to the road surface under the action of a static load.
The test wheel is mounted to the side of a tanker lorry between the front and rear axles of the truck so that it runs in the vehicle wheel path. SCRIM is used widely across Europe with many countries operating more than one machine. There is a wide variety of truck chassis and bodywork in use, ranging from small units for use on local roads to very large three-axle trucks for long-distance main highway work.
Figure 2.2 shows the measuring wheel assembly on a SCRIM built for UK main road use, with its test wheel on the left side of the truck. European mainland machines normally carry the test wheel on the right side and some machines are fitted with two test wheels.
Figure 2.2 – SCRIM
SCRIM measures SFC using an angled wheel. Some machines are also fitted with laser sensors to measure macrotexure.
These have been estimated from data from the 2008 annual comparison trial in the UK involving fourteen machines operating on seven different test surfaces. Reproducibility values may vary in other countries depending on whether the machines have been maintained and compared with the UK fleet.
A freely rotating wheel fitted with a special pneumatic, smooth, rubber tyre, is mounted midmachine in line with the nearside wheel path and set at an angle to
Chapter 2: Tests to assess Skid Resistance and Texture Depth
the direction of travel of the vehicle. The wheel is lowered on to the road surface under the action of a static vertical load defined by the mass of the wheel assembly, which is able to move freely up and down on vertical linear guides. The force acting along the axle of the test wheel is measured and used to calculate the SFC. On some machines, particularly those operating in the UK, the dynamic vertical load is also simultaneously measured and used in the computation of SFC.
The standard test conditions for the SCRIM are listed in Table 2.2. [2]
Tabel 2.2 - The standard test conditions for the SCRIM
2.1.3 BS EN 13036-4:2011 - Road and airfield surface characteristics —
Test methods. Part 4: Method for measurement of slip/skid resistance of a surface: The pendulum test
This European Standard describes a method for determining the slip/skid resistance of a surface using a device which remains stationary at the test location. The slip/skid resistance is measured by means of a slider mounted at the end of a pendulum arm, either in the field or in the laboratory.
This method measures the slip/skid resistance of a small area of a surface (approximately 0,01 m2). This should be considered when deciding its