UNIVERSITY OF PISA RESEARCH DOCTORATE
THESIS
Risk Factors of Depression and Anxiety during
Pregnancy:
Maternal Antenatal Attachment
……..
Results of PND-ReScu Study
.
CANDIDATE: SUPERVISING PROFESSOR:
“…..sono orgogliosa di avere dei figli e per quanto mi possano far arrabbiare li amo e sono felice di sacrificarmi per loro perchè senza di loro la vita non avrebbe senso. Grazie d avermi aiutata sei anni fa perchè oggi so che non ho sbagliato e non sto sbagliando. Con affetto A.C”
Alla mia famiglia e Alle donne seguite in questi anni.
Index
Abstract 4
1. Introduction 10
1.1 Epidemiological Date 10
1. 2 Risk Factors of Postnatal Depression (PND) 11
1.3 Treatments for post partum depression 14
1.4 The Maternal Attachment 16
2 Aims of the study 21
3. Methods 22
3.1 Participants 22
3.2 Instruments 24
3.3 Statistical Analyses 29
4. Results 30
4.1 Demographic characteristics of the sample study 31
4.2. Prevalence of depression during pregnancy 32
4.3 Prevalence of anxiety symptoms during pregnancy 32
4.4 Prevalence good antenatal attachment 32
4.5 Association between depression, good antenatal attachment, anxiety symptoms , risk factors during pregnancy
33 4.6 Association during pregnancy beetween antenatal maternal attachment and
demographic characteristics
37 4.7 Correlation between antenatal attachment, anxiety, depression and risk factors
during pregnancy
38
5. Discussion 50
6. Conclusion 52
ABSTRACT
Background: :
Perinatal depression is one of the most common complications of
childbearing.
Approximately 10 to 15% of women experience a clinically significant
major depressive episode during pregnancy or the early postpartum period
(Bennett, Einarson, Taddio, Koren, & Einarson, 2004b; Epperson, 1999;
Gavin, Gayner, Lohr, Meltzer-Brody, Gartlehner, & Swinson, 2005; O’Hara
& Swain, 1996). These prevalence estimates predominantly reflect rates of
depressive symptoms in developed countries; there is evidence that rates of
depression vary more widely in non-developed countries (Halbreich &
Karkun, 2006). In addition to the distress and impairment experienced by
depressed women, depression during this time period is associated with
further adverse outcomes for both mother and child. Women who
experience perinatal depressive episodes are at increased risk for subsequent
episodes of both postpartum and non-postpartum depression (Cooper &
Murray, 1995).
Anxiety symptoms are frequently reported by pregnant women and are
often considered as part of the normal psychic experiences of pregnancy,
especially if they are focused on the baby's health or on maternal
competencies.
The emotional image of the baby inside is what is called the mother fetus
relationship.
Cranley (1981) describes the nature of mother’s experiences as ‘physical
and kinesthetic awareness of the fetus’, and an ‘intellectual knowledge of
her child’.
Nowadays, the concept of prenatal attachment is more accurately defined
(Righetti, 2003) and it generally refers to the maternal–fetal relationship,
which normally develops during the pregnancy; it represents the earlier
internalized representation of the fetus that both parents typically acquire
and elaborate. Pregnancy can also represent a crisis period for many
women, with manifest effect on antenatal attachment. Condon and
Corkindale (1997) explore the hypothesis that feelings of anxiety or
depression and lack of social support would be an interference issue in the
development of maternal antenatal attachment. Women characterized by
low attachment are associated with high levels of depression and anxiety,
weak external social support, and high control and criticism in the partner
relationship.
Aims:
The aims of this thesis were:
1)to assess association between antenatal
attachment and demographic characteristics. 2) to investigate the role of
maternal attachment (as MAAS) on the development of depression
(EPDS>12) , anxiety symptoms (STAI-Y >40) and risk factors (PDPI-R)
during pregnancy. 3) to assess the specific role of antenatal attachment as
risk factor for depression (EPDS>12), as anxiety symptoms (STAI>40)
during pregnancy.
.
Methods:
A sample of pregnant (N= 456) women was recruited as part of a larger
study conducted at Pisa in the framework of the Perinatal Research and
Screening Unit Study (PND-ReScU). The Perinatal Depression-Research and
Screening Unit (PND-ReScU) is based on an ongoing collaboration between
the Department of Obstetrics and Gynecology and the Department of
Psychiatry, Neurobiology, Pharmacology, and Biotechnologies of the
Azienda Ospedaliera Universitaria Pisana. The primary aim of the
PND-ReScU is to evaluate the effectiveness of screening for early identification
and the intervention strategies to reduce mood disorders in the perinatal
period. Furthermore, PND-ReScU aims at defining a battery of instruments
that can be easily administered in a primary prevention setting.
Women were recruited for the study during pregnancy, at the time of
delivery of the pregnancy book, or in the immediate post-partum period
(during hospitalization).
Instruments:
Symptoms of maternal depression were assessed using the 10-item
Edinburgh Postnatal Depression Scale (Cox et al., 1987). The Post-partum
Depression Predictors Inventory-Revised (PDPI-R) (Beck, 2002) was used to
identify the risk factors for PPD.
Prenatal maternal attachment were
assessed using
the Maternal Antenatal Attachment Scale (MAAS).
Maternal and paternal antenatal attachment scales (MAAS; Condon, 1993).
Anxiety symptoms were assessed using STAI-Y ( state trait anxiety
Inventory form Y-1.)
Statistical analysis:
Data are presented as means (standard deviations), or percentages.
Chi-square tests were used to compare percentages and
ANOVA were used to compare mean scores.
Using analysis of variance (ANOVA) was able to compare two or more
groups of data comparing the internal variability in these groups with the
variability between groups.
To check the intensity and direction of the relationships between
depression, anxiety, attachment to the fetus and risk factors, was
performed Pearson bivariate correlation.
Analyses were conducted using SPSS, version 15.
Results:
Our sample is composed by 456 women: among them, 393 (86.2%) of
Italian nationality and 401 (87.9%) experiencing a spontaneous pregnancy.
Moreover, 61.6% of the sample is composed of women in their first
pregnancy.
At T0, we can observe that 4.8% of women have an high score on EPDS
(EPDS ≥13) while at T1 At the percentage of the output decreases to .9%.
At T2 decreases further to 4%. while the T3 is increased up to 1.1%.T0, the
prevalence of anxiety is 18%, while we can observe that the percentage
decrease at the next T: T1 (6.1%), T2 (4.4%), T3 (3.9%). the average of the
MAAS total scores at T2 was 76.95 ± 6.3, while at T3, the average is 78.54 ±
6.29. Considering the MAAS Preoccupation subscales at T2 the average is
28.12 ± 4.2 and 29.33 ± 4.21 at T3. Considering the Quality of Attachment
subscale MAAS, at T2, the average is 47.2 ± 3.29, while the T3 is 47.71 ±
2.98. Association between depression during pregnancy, good antenatal
attachment , anxiety symptoms and risk factors is reported in tab 2,3,4,5.
In our sample we don’t find any association between antenatal maternal
attachment and demographic characteristics except for women in their
first pregnancy in which we discover higher MAAS scores than other
women in sample. Correlation between antenatal attachment, anxiety,
depression and risk factors during pregnancy is reported in tab.7
Conclusions:
Many of the physiological sensations that occur during pregnancy closely
resemble anxiety symptoms; thus, these disorders may be masked in
pregnant women. For this reason it is essential that treatment providers in
obstetric offices, primary care settings, and mental health clinics be
attuned to the signs of anxiety disorders (Weisberg and Paquette, 2002).
Carrying out antenatal screening of established risk factors and accurate
evaluation of attachment during pregnancy
may help to plan adequate
treatment in order to prevent
possible postpartum distress outcomes.
Further studies are needed to replicate our findings and to
clarify the role
of pre/post natal attachment during pregnancy and its link with
Post-Partum Depression in order to
identify a specific subgroup of women
warranting special attention.
1. INTRODUCTION
1.1 Epidemiological Date
Perinatal depression is one of the most common complications of
childbearing.
Approximately 10 to 15% of women experience a clinically significant
major depressive episode during pregnancy or the early postpartum period
(Bennett, Einarson, Taddio, Koren, & Einarson, 2004b; Epperson, 1999;
Gavin, Gayner, Lohr, Meltzer-Brody, Gartlehner, & Swinson, 2005; O’Hara
& Swain, 1996). These prevalence estimates predominantly reflect rates of
depressive symptoms in developed countries; there is evidence that rates of
depression vary more widely in non-developed countries (Halbreich &
Karkun, 2006). In addition to the distress and impairment experienced by
depressed women, depression during this period is associated with further
adverse outcomes for both mother and child. Women who experience
perinatal depressive episodes are at increased risk for subsequent episodes
of both postpartum and non-postpartum depression (Cooper & Murray,
1995).
Prenatal depression is associated with increased risk for negative birth
outcomes, including preterm labor, low birth weight, and intrauterine
growth restriction (Grote, Bridge, Gavin, Melville, Iyengar, & Katon, 2010).
Maternal depression during the postpartum period is also a risk factor for a
range of adverse child outcomes, including behavioral problems and
impaired cognitive development (Grace, Evindar, & Stewart, 2003).
1.2 Risk Factors of Postnatal Depression (PND)
Despite the stereotype that the perinatal phase is a period of happiness,
women frequently experience adjustment difficulties and depressive
symptoms during pregnancy and in the postpartum period. Reviews and
meta-analyses published on postnatal depression (PND) estimate that in
Western countries it affects 10% to 15%
of women (Beck, 2001; O’Hara and
Swain, 1996). Recently, meta-analysis of the Agency for Healthcare
Research and Quality estimated that the prevalence of major or minor
depression in pregnancy ranges from 8.5% to 10.0% while in the first
postpartum year it ranges from 6.5% to 12.9% (Gaynes et al., 2005). These
figures are comparable to those seen in non-childbearing women (O’Hara
et al., 1991
).
Although every woman is potentially at risk of developing PND, women
who present specific risk factors have a significantly increased risk of
becoming depressed after delivery. These risk factors are widely studied in
literature (Kitamura et al., 1993; Glangeaud-Freudenthal and Boyce, 2003;
1996) have been carried out to estimate the effect size of each of them.
Currently, the known risk factors have been classified, according to their
effect size, into three categories: strong-moderate, moderate, and small.
The strongest predictors of PND are the experience of depression or
anxiety during pregnancy or a previous depressive illness (Ryan et al., 2005;
Robertson et al., 2004). In addition to these predictors, life stress and lack
of social support have a moderate-severe effect size; psychological factors
and marital problems have a moderate effect size, while obstetric factors
and socioeconomic status have a small effect size (Robertson et al., 2004).
As regards psychiatric risk factors, when anxiety is considered as a
dimensional characteristic clinically assessed or measured by a score on a
rating scale, the findings in the literature are discrepant. Precursor studies
suggested that anxiety during pregnancy increased the risk of PND (Dalton,
1971; Tod, 1964; Heron et al., 2004) while others did not confirm this
association (Pitt B., 1968). In a recent study Austin et al. (2007) have
demonstrated that women with high antenatal BMWS scores (scale used to
assess trait cognitive anxiety) were 2.6 times more likely to have probable
PND than those with low scores (Austin et al., 2007). Antenatal anxiety has
been found to be a significant predictor of postnatal depression in three
meta-analysis (O’Hara and Swain, 1996; Beck, 2001; Robertson et al.,
2004).
Although the role of anxiety symptoms on the development of PND has
already been studied in literature (Heron et al., 2004; Sutter-Dallay et al.,
2004; Skouteris et al., 2009), the link between anxiety disorders (AD)
defined as diagnostic categories and PND, has received only a little specific
attention. Moreover, in most studies there were methodological
limitations such as small sample sizes and the lack of adjustment for
confounding factors. In particular, most studies did not take into account
the strong co morbidity between mood disorders and AD, and thus did not
investigate whether pregnancy AD could increase the risk of PND,
regardless of the existence of pregnancy depression.
In a large sample of women Sutter-Dallay (2004) assessed whether
pregnancy AD is an independent risk factor for the occurrence of intense
postnatal depressive symptoms; these authors found that women
presenting pregnancy AD were four times more likely to present also
postnatal depression at the 6th week, than those without. Further, as
literature suggests, no studies have examined the predictive role of a
specific diagnosis of anxiety disorder in post-partum depression.
1.3 Treatments for post partum depression
Given the prevalence of perinatal depression and the adverse effects this
disorder has on women and their children, the identification of effective
treatments for this disorder has important public health implications.
Although there is a great evidence for the efficacy of both antidepressant
medication and psychological interventions for depression (Joffe, Sokolov
& Streiner, 1996 and Cuijpers, van Straten, Andersson, & van Oppen, 2008 )
. For example, in an attempt to limit fetal exposure, antidepressants may
be prescribed below therapeutic dosage levels (Bennett, Einarson, Taddio,
Koren, & Einarson, 2004a).
This problem is complicated further by the fact that most women actually
require higher doses of antidepressant medication during pregnancy
(Dawes & Chowienczyk, 2001; Hostetter, Stowe, & Strader, 2000; Wisner,
Perel, & Wheeler, 1993). Concerns regarding effects of infant exposure to
antidepressant medication via breast milk may also lead clinicians to
prescribe inadequate doses of these medications during the postpartum
period (Epperson, Anderson, & McDougle, 1997; Epperson, Jatlow,
Czarkowski, &
Anderson, 2003). Biological and psychosocial changes that occur in the
context of pregnancy and parenting, including sleep deprivation,
disruptions to the hormonal balance, alterations to HPA axis functioning,
and changes to interpersonal relationships, introduce challenges that may
affect the efficacy of both pharmacological and psychotherapeutic
interventions (Dennis & Ross, 2005; Kammerer, Taylor, & Glover, 2006).
Efficacy of psychological interventions for depression may also be reduced
among women who have had previous pregnancy losses, complications, or
traumatic deliveries, as they may experience post-traumatic stress disorder
or other co morbid anxiety disorders (Forray, Mayes, Magriples, &
Epperson, 2009).
There are also differences in the acceptability of interventions, particularly
among women who are pregnant or breastfeeding: the majority of women
indicate a preference for psychological interventions to antidepressant
medication during both pregnancy and the postpartum period, and the
overall acceptability of antidepressant medication among these groups is
low (Chabrol, Teissedre, Armitage, Danel, & Walburg, 2004; Kim et al.,
2011). Thus, identification of efficacious interventions, particularly
psychological interventions, for this population is an important and
growing area of research.
Two meta-analytic reviews of psychological treatments for postpartum
depression have found these interventions to be superior to routine care
interventions for postpartum depression found that, compared to routine
care, these interventions were associated with a 30% reduction in relative
risk for depressive symptomatology (Dennis & Hodnett, 2007).
Cuijpers, Brännmark, and van Straten (2008) conducted a meta-analysis of
17 studies in which a psychological intervention initiated during the
postpartum period was compared to a control or active treatment
condition. They reported that psychological interventions were superior to
control conditions, with an overall effect size in the moderate range.
Many studies of interventions for this population are either open trials or
do not include a treatment control condition, we chose not to restrict
these analyses to studies in which interventions were compared to a
control condition. However the possibility that effect sizes calculated from
these studies may reflect natural symptom remission over time, we also
compared active treatments to control conditions in studies where it was
possible to do so.
1.4 The Maternal Attachment
In the last two decades, psychologists had progressively structured the
concept of the mother–fetus relationschip as the complex emotional
internal image of the unborn baby, that the mother acquires and
Righetti & Sette, 2000; Stainton, 1985). Cranley (1981) describes the nature
of the mother’s experiences as ‘physical and kinesthetic awareness of the
fetus’, and an ‘intellectual knowledge of her child’.
Nowadays, the concept of antenatal/prenatal attachment is more
accurately defined (Righetti, 2003) and it generally refers to the maternal–
fetal relationship, which normally develops during pregnancy; it represents
the earlier internalized representation of the fetus that both parents
typically acquire and elaborate.
Condon (1993) suggests a way of understanding attachment in terms of
quality
of
the
affective
experiences
(closeness/distance,
tenderness/irritation, pleasure in interaction, distress at fantasized loss,
and conceptualization of the fetus as a ‘little person’) and intensity of
preoccupation (amount of time spent thinking about, talking to, dreaming
about or palpating the fetus).
Researchers have demonstrated that prenatal attachment develops
regardless of maternal age (Bloom, 1995), although middle-aged women
aged over 35 show significantly lower prenatal attachment scores.
Furthermore, no significant differences are found in prenatal attachment
levels between primiparous and multiparous groups of women (Condon &
Esuvaranathan, 1990).
The favourable prospective use of antenatal attachment is underlined by
Condon’s statements (1997): ‘Maternal–fetal attachment is of a potential
significance from both theoretical and clinical perspectives. It represents
the development of the earliest, most basic form of human intimacy
involving an object characterized by a curious admixture of fantasy and
reality.’
Pregnancy can also represent a critical period for many women, with
manifest effect on antenatal attachment. Condon and Corkindale (1997)
explore the hypothesis that feelings of anxiety or depression and lack of
social support would be an interference
issue in the development of maternal antenatal attachment. Women
characterized by low attachment are associated with high levels of
depression and anxiety, weak external social support, and high control and
criticism in the partner relationship. From a clinical perspective, the
incidence and the implication of low levels of prenatal attachment are also
investigated; approximately 8% of women develop minimal attachment to
their unborn child (Condon, 1986; Condon, 1987). Pollock and Percy (1999)
found an association between the low attachment group and self-reported
risk to the fetus and dimension of personality disorder. Thus, it seems not
implausible that the antenatal attachment may be of critical importance
for the early mother–infant relationships.
Maternal feelings and sensitivity towards the child develop continuously
throughout pregnancy (Leifer, 1997), and a loving relationship with the
fetus would continue to be a good, sensitive interaction postnatally. In a
study of 100 pregnant mothers, Siddiqui and Hagglof (2000) indicate that
mothers who experienced greater affection during pregnancy and
fantasized more about the unborn babies at about 12 weeks postpartum,
showed more overall involvement during interaction, in particular
in stimulating their infants. Consequently, interventions which result in
better antenatal attachment may have durable positive consequences.
The role of antenatal care, ultrasound scanning technique in particular, has
not been satisfactorily investigated, although fetal ultrasound screening
has progressively become routine practice in many countries. Studies from
the early 1980s (Reading, Cox,
Sledmere, & Campbell, 1984) demonstrated that women liked the moving
image of scans, above all ‘seeing the baby on scan is a high spot of the
pregnancy, an event to be shared with the baby’s father and siblings’
(Marteau & Richards, 1996, p.122). In fact, women generally consider
ultrasound a pleasant experience and one of the best aspects of their
antenatal care (Brown, Lumley, Small, & Astbury, 1994); moreover, women
and their partners find ultrasound very attractive because it offers a visual
confirmation of pregnancy, and it represents a new form of contact with
the unborn baby (Clement, Wilson, & Sikorski, 1998).
2. AIMS OF THE STUDY
This thesis has three aims:
1)to assess association between antenatal attachment and demographic
characteristics
2) to investigate the role of maternal attachment (as MAAS) on the
development of depression (EPDS>12) , anxiety symptoms (STAI-Y >40)
and risk factors (PDPI-R) during pregnancy
3) to assess the specific role of antenatal attachment as risk factor for
depression (EPDS>12), and anxiety symptoms (STAI>40) during pregnancy
3. METHOD
3.1 Participants
A sample of 456 pregnant women was recruited as part of a larger study
conducted at Pisa in the framework of the Perinatal Research and
Screening Unit Study (PND-ReScU). The Perinatal Depression-Research and
Screening Unit (PND-ReScU) is based on an ongoing collaboration between
the Department of Obstetrics and Gynecology and the Department of
Psychiatry, Neurobiology, Pharmacology, and Biotechnologies of the
Azienda Ospedaliera Universitaria Pisana. The primary aim of the
PND-ReScU is to evaluate the effectiveness of screening for early identification
and the intervention strategies to reduce mood disorders in the perinatal
period. Furthermore, PND-ReScU aims at defining a battery of instruments
that can be easily administered in a primary prevention setting strategy.
The women included in this study were recruited during pregnancy when
the pregnancy book was delivered to them. Central to our recruitment plan
was a letter to be given to each pregnant woman who came to the local
health service to receive a booklet of information issued by the region of
Tuscany describing the various aspects of pregnancy and maternal health.
This letter was meant to provide a brief description of perinatal depression
and inform women about the possibility of participating in a study aimed at
September 2009 and ended in august 2011. Study should last 24 months
with a recruitment period of 6 months. To be included in the study,
Women had to be at the third month of their pregnancy
, be willing to sign
an informed consent statement and be available to be contacted by phone.
Exclusion criteria for the study were age
18 years, poor knowledge of the
Italian language or other limitations to communication and no fixed
residence. The Ethics Committee of the Azienda Ospedaliera Universitaria
Pisana approved the study protocol and the assessment procedures. The
Committee also required the provision of psychological counseling for
women with mild depressive symptomatology and/or for all women who
requested it. Provisions of drug treatment for women with
moderate/severe depression, were also provided according to
international guidelines (U.S. Food and Drug Administration, 1979;
American Academy of Pediatrics, 2000). All subjects were written in the
informed consent providing participants with a full description of the study
and the opportunity to ask questions. The Ethics Committee allowed us to
collect information only after the informed consent statement was signed,
as prescribed the Italian law (art. n. 675 of December 31, 1996) on privacy.
Therefore, socio-demographic characteristics of women who refused to
participate in the study are not available. This study was supported by the
3.2 Instruments
Several instruments were administered to evaluate a broad range of
different aspects related to the perinatal period that might represent
potential risk factors for the development of PND.
Symptoms of maternal depression were assessed using the 10-item
Edinburgh Postnatal Depression Scale (Cox et al., 1987). Originally designed
as a screening instrument for postnatal depression, the EPDS has been
since then validated for use during pregnancy (Murray and Cox, 1990). The
EPDS is a 10-item self-report scale designed as a screening instrument for
postnatal depression but has also been validated in non-postnatal women
(Cox et al., 1987). Each item is scored on a four-point scale (0–3), the
minimum and maximum scores being 0 and 30, respectively. Five of the
items explore dysphoric mood, two explore anxiety and three assess guilt
and suicidal thoughts. The total is calculated by summing up the item
scores. A score of 13 and above is used to identify probable cases with a
sensitivity of 86% and a specificity of 78% (Cox et al., 1987). The scale does
not provide a clinical diagnosis of depression, but a score above 13 is
widely used to indicate the presence of probable depressive disorder. The
EPDS rates the intensity of depressive symptoms present over the previous
7 days (see Appendix 2 for a description of the items). A cut-off score of 13
has been found to identify most seriously depressed women, although in
case of a score of 9 or more, clinical assessment has been recommended
(Cox et al., 1983). In 1992, the EPDS was translated into Italian and was
found to have good psychometric properties (Carpiniello et al., 1997).
When women exceeded the threshold score (total scores ≥13) of EPDS,
suggesting the probable presence of depression, we have re-administered
section A of SCID to confirm the diagnosis of depressive disorders. Scores
on EPDS item 3, “blamed myself unnecessarily”, item 4, “anxious or worried
for no good reason”, and item 5, “scared or panicky for no very good
reason”, were extracted for further analysis. These items were clustered as
“Anxiety EPDS”. Scores on EPDS item 1, “I have been able to laugh and see
the funny side of things”, item 2, “I have looked forward with enjoyment to
things”, and item 8, “I have felt sad or miserable”, were extracted for
further analysis. These items were clustered as “Depression EPDS”.
Information on socio-economic status was drawn from the Postpartum
Depression Predictors Inventory-Revised (PDPI-R) (Beck, 2002), which is a
self-report instrument designed to identify the risk factors for postpartum
depression. The PDPI-R categorizes socio-economic status on 3 levels: -low,
medium, and high, without providing anchor points related to the income
per year. The 13 PDPI-R factors are (1) marital status, (2) socio- economic
unwanted/unplanned pregnancy, (7) history of previous depression, (8)
social support, (9) marital dissatisfaction, (10) life stress, (11) childcare
stress, (12) infant temperament, and (13) maternity blues. The first 10
predictors comprise the prenatal version of the PDPI-R. The last 3 risk
factors are specific to the postpartum period. The total score on the
prenatal version of the PDPI-R ranges between 0 and 32, while the PDPI-R
Full Version (Prenatal plus Postpartum Versions) is used after delivery and
includes all 10 factors of the Prenatal Version plus three additional risk
factors: childcare stress, infant temperament and maternity blues. The total
score of the Full Version ranges between 0 and 39 (Beck et al., 2006). The
higher the score, the more risk factors for PPD a subject has.
Maternal attachment was
assessed using
the Maternal Antenatal Attachment Scale (MAAS).These 19-item (for mother) scales consist of two underlying
dimensions: the quality and the preoccupation of antenatal attachment
derived from factor analysis studies. The first dimension refers to affective
experiences and positive feelings about the fetus, the second one assessed
the intensity of preoccupation with the fetus, such as the strength of
feelings, the amount of time spent thinking about or dreaming about the
baby. Participants’ responses are made on 5-point scales: the higher
values designate a good antenatal attachment
. Generally, higher scores for
both the subscales indicate the most adaptive mother–fetus attachment
style.
Anxiety symptoms were assessed using STAI-Y ( state trait anxiety
Inventory form Y-1. Self report measures of state and trait anxiety are
regularly used in studies with childbearing and, in the last time, validated
for use with pregnant and postnatal women (Grant et al., 2008). STAI-Y is a
self-administrated test that is composed by 2 parts: the state anxiety scale
consist of 20 items that evaluate current feelings of tension and anxiety,
while the 20-item trait scale assesses anxiety levels in general.
Scores over 40 on both the state and trait scales were adopted; this value
corresponding to the point at which false positive and negative results
were minimal (Barnett and Parker, 1986; Hart and McMahon, 2006).
Tab1. Schedule of Assessment
Pregnancy Post Partum
T Month T0 I T1 III T2 VI T3 VIII T4 I T5 III T6 VI T7 IX T8 XII EPDS x x x x x x x x X STAI_ Y X x x x x x x x x MAAS x x PDPI x x x x x x x x x
3.3. Statistical analysis
Data are presented as means (standard deviations), or percentages.
Chi-square tests were used to compare percentages and ANOVA were
used to compare mean scores.
Using analysis of variance (ANOVA) it was possible to compare two or more
groups of data comparing the internal variability in these groups with the
variability between groups.
Furthermore, the relationship between anxiety, depression, risk factors
and maternal attachment during pregnancy were analysed using a
bivariate correlation model
4.RESULT
4.1 Demographic characteristics of the sample study
Demographic characteristics of pregnant women are provided in Table 2.
Our sample composed by 456 women whose 393 (86.2%) italian nationality
and 401 (87.9%) had a spontaneous pregnancy. Moreover 61.6% of the
sample is composed by women in first pregnancy.
In order to evaluate if the women who completed the T2 were different
from those who did not, a t-test for indipendent sample was performed.
Women who completed the T2 had the same age of those who did not
complete it (32.6+-4.4 vs. 32.9+-5.2; t=-.48, p=.63).
The 215 ( 47.1%) women who completed the sixth month evaluation (T2)
did not differ from those who did not complete T2 evaluation (241
52.9%)on marital status, socio-economic status, employment, living area,
Pregnancy features .
In terms of educational levels we can observe same difference between
women who complete T2 evaluation and those who did not complete.
Age (mean ± SD) 32.75±4.84 Marital Status n (%) Single 26 (5.7) Married/Cohabiting 293 (64.3) Divorced 11 (2.4) Widowed 1 (0.2) Missing 37 (8.1) Employment status n (%) Student 8 (1.8) Unemployed 35 (7.7) Employed 262 (57.5) Housewife 46 (10.1) Other (lavoratore autonomo) 67 (14.7) Missing 38 (8.3) Educational level n (%) Primary school 5 (1.1) Secondary school 74 (16.2) High school (completed) 206 (45.2) University degree 132 (28.9) Missing 39 (8.6) Socioeconomic status n (%) Low 33 (7.2) Medium 373 (81.8) High 5 (1.1) Missing 45 (9.9) Living Area n (%) Urban 176 (38.6) Suburban 225 (49.3) Rural 13 (2.9) Missing 42 (9.2) First pregnancy n (%) Yes 253 (55.5) No 158 (34.6) Missing 45 (9.9) Pharmacological
In particular we have seen that women who completed T2 evaluation have
an higher educational levels (High school and university degree) than
those who didn’t complete the same evaluation (primary and secondary
school).
4.2 Prevalence of depression during pregnancy.
At T0, we can observe that 4.8% of women have an high score on EPDS
(EPDS ≥13) while at T1 the percentage of the output decreases to .9%. At
T2 decreases further to .4%, while the T3 is increased up to 1.1%
4.3 Prevalence of anxiety symptoms during pregnancy.
At T0, the prevalence of anxiety is 18%, while we can observe that the
percentage decrease at the next T: T1 (6.1%), T2 (4.4%), T3 (3.9%).
4.4 Prevalence
good antenatal attachment.
The average of the MAAS total scores at T2 is 76.95 ± 6.3, while at T3, the
average is 78.54 ± 6.29. Considering the MAAS preoccupation subscales at
T2 the average is 28.12 ± 4.2 and 29.33 ± 4.21 at T3. Considering the
Quality of Attachment subscale MAAS, at T2, the average is 47.2 ± 3.29,
while the T3 is 47.71 ± 2.98.
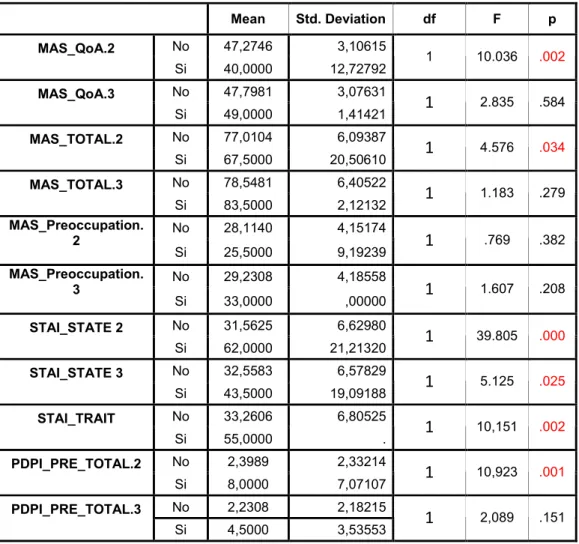
4.5 Association during pregnancy between depression, and
anxiety symptoms good antenatal attachment , and risk factors
This table 2 was made by using EPDS ≥ 13 at T2 like independent variable
Tab. 2 Mean Std. Deviation df F p No 47,2746 3,10615 MAS_QoA.2 Si 40,0000 12,72792 1 10.036 .002 No 47,7981 3,07631 MAS_QoA.3 Si 49,0000 1,41421 1 2.835 .584 No 77,0104 6,09387 MAS_TOTAL.2 Si 67,5000 20,50610 1 4.576 .034 No 78,5481 6,40522 MAS_TOTAL.3 Si 83,5000 2,12132 1 1.183 .279 No 28,1140 4,15174 MAS_Preoccupation. 2 Si 25,5000 9,19239 1 .769 .382 No 29,2308 4,18558 MAS_Preoccupation. 3 Si 33,0000 ,00000 1 1.607 .208 No 31,5625 6,62980 STAI_STATE 2 Si 62,0000 21,21320 1 39.805 .000 No 32,5583 6,57829 STAI_STATE 3 Si 43,5000 19,09188 1 5.125 .025 No 33,2606 6,80525 STAI_TRAIT Si 55,0000 . 1 10,151 .002 No 2,3989 2,33214 PDPI_PRE_TOTAL.2 Si 8,0000 7,07107 1 10,923 .001 No 2,2308 2,18215 PDPI_PRE_TOTAL.3 Si 4,5000 3,53553 1 2,089 .151This table 3 was made by using EPDS ≥ 13 at T3 like independent variable
Tab 3 Mean Std. Deviation df F p No 47,413 2,78 MAS_QoA.2 Si 38,000 11,789 1 25,186 .000 No 47,791 2,958 MAS_QoA.3 Si 45,800 3,563 1 2.143 .146 No 77,288 5,918 MAS_TOTAL.2 Si 65,666 14,640 1 10.246 .002 No 78,625 6,336 MAS_TOTAL.3 Si 76,800 6,379 1 .398 .529 No 28,192 4,210 MAS_Preoccupation. 2 Si 25,666 4.041 1 1.051 .308 No 29,333 4,276 MAS_Preoccupation. 3 Si 29.600 3,049 1 .019 .891 No 31,817 7.275 STAI_STATO.2 Si 45,000 7.549 1 9.560 .003 No 32,570 6,595 STAI_STATO.3 Si 50.800 8.700 1 35.829 .000 No 33,533 6,736 STAI_TRATTO Si 47.250 15.924. 1 14,389 .000 No 2,270 2,304 PDPI_PRE_TOTAL.2 Si 5,0000 3.605 1 14,389 .049 No 2,231 2,249 PDPI_PRE_TOTAL.3 Si 8.750 5.315 1 28, 801 .000This table 4 was made by using STAI-Y ≥ 40 at T2 like independent variable
Tab 4 Mean Std. Deviation df F p No 47.585 2,454 MAS_QoA.2 Si 43.631 6.651 1 27.948 .000 No 47,828 3.136 MAS_QoA.3 Si 47.750 1.488 1 .005 .945 No 77,471 5,686 MAS_TOTAL.2 Si 72.000 9.469 1 13.620 .000 No 78.606 6,544 MAS_TOTAL.3 Si 79.375 3.420 1 .107 .744 No 28,289 4,181 MAS_Preoccupation. 2 Si 25,526 4.350 1 3.026 .084 No 29,262 4,282 MAS_Preoccupation. 3 Si 30.125 2.295 1 .315 .576 No 2.337 2.520 EPDS T2 Si 8.736 5.576 1 80.956 .000 No 2.252 2.700 EPDS T3 Si 8.750 4.026 1 39.618 .000 No 2,057 1.778 PDPI_PRE_TOTAL.2 Si 6.368 4.016 1 72.571 .000 No 1.949 1.825 PDPI_PRE_TOTAL.3 Si 5.444 3.395 1 25.495 .000This table 5 was made by using STAI-Y ≥ 40 at T3 like independent variable
Tab.5 Mean Std. Deviation df F p No 47.536 2.646 MAS_QoA.2 Si 44.538 6.715 1 9.691 .002 No 47.798 3.060 MAS_QoA.3 Si 47.176 2.429 1 .637 .426 No 77,218 5,986 MAS_TOTAL.2 Si 75.320 9.248 1 1.126 .291 No 78.541 6.546 MAS_TOTAL.3 Si 78.588 4.528 1 .001 .976 No 27.981 4.306 MAS_Preoccupation. 2 Si 29.000 3.763 1 .665 .416 No 29.238 4.394 MAS_Preoccupation. 3 Si 29.941 2.771 1 .408 .524 No 2.605 3.466 EPDS T2 Si 6.769 2.919 1 17.255 .000 No 2.045 2.374 EPDS T3 Si 9.235 5.706 1 83.426 .000 No 2,093 1.950 PDPI_PRE_TOTAL.2 Si 4.500 3.371 1 13.845 .000 No 2.178 2.177 PDPI_PRE_TOTAL.3 Si 5.000 4.082 1 18.086 .0004.6 Association during pregnancy beetween antenatal maternal
attachment and demographic characteristics
In our sample we don’t find any association between antenatal maternal
attachment and demographic characteristics except for women in their
first pregnancy in which we discover higher MAAS scores than other
women in sample. These data are shown in Table 6
Tab.6 N Mean DeviationStd. df F p No 59 46,5424 3,23942 MAS_QoA.2 Si 123 47,6179 3,32531 1 4.241 .041 No 40 46,9000 4,21110 MAS_QoA.3 Si 78 48,2436 1,91498 1 5.685 .019 No 59 74,9831 6,70433 MAS_TOTAL.2 Si 123 77,9837 6,02724 1 9.181 .003 No 40 76,2250 7,87885 MAS_TOTAL.3 Si 78 79,8718 4,81707 1 9.694 .002 No 59 26,7288 4,70814 MAS_Preoccupation.2 Si 123 28,7886 3,87563 1 9.766 .002 No 40 27,7250 4,71216 MAS_Preoccupation.3 Si 78 30,1538 3,69653 1 9.433 .003
As a result of these data, we further investigated the possible relationship
between primiparous, anxiety, depression and risk factors. These data are
Tab.7
4.7 Correlation between antenatal attachment, anxiety,
depression and risk factors during pregnancy
The results below represent (table 8) the values of correlation between the
variables of antenatal attachment, depression, anxiety and risk factors in
the antenatal:
Tab 8.1 Eta MAS_ TOTA L.2 MA S_ Qo A.2 MAS _Pre occu patio n.2 MAS _TO TAL. 3 MAS _Qo A.3 MAS_ Preoc cupati on.3 Eta Pe ars on Co rrel ati on 1 ,263(* -*) -,17 8(*) -,272( **) -,313( **) -,258( **) -,300(* *) Sig . (2-tail ed) ,000 ,017 ,000 ,001 ,005 ,001 N Mean DeviationStd. df F p EPDS_TOT.2 No 59 3,3220 3,01399 Si 122 2,6721 3,58934 1 1.442 .231 EPDS_TOT.3 No 40 3,9750 4,64917 Si 78 2,3846 3,33899 1 4.560 .035 STAI_STATO.2 No 60 32,8333 6,65408 Si 128 31,4063 7,57788 1 1.823 .179 STAI_STATO.3 No 43 35,3256 7,86106 Si 92 31,9783 6,91388 1 1.715 .193 PDPI_PRE_TOTAL.2 No 57 2,8596 2,51736 Si 124 2,3226 2,47113 1 1.562 .213 PDPI_PRE_TOTAL.3 No 38 2,9737 2,89909 Si 81 2,2963 2,49722 1 6.287 .013Tab8.2 Eta STAI _ST ATO. 0 STAI _ST ATO. 1 STAI _ST ATO. 2 STAI _ST ATO. 3 STAI _ST ATO. 4 STAI _TR ATT O Eta Pe ars on Co rrel ati on 1 ,119(*) ,206(**) ,134 ,026 ,307(**) ,100(*) Sig . (2-tail ed) ,018 ,004 ,069 ,761 ,009 ,046 Tab 8.3 EPD S_T OT.1 EPD S_T OT.2 EPD S_T OT.3 EPD S_T OT.4 MA S_ TO TA L.2 Pe ars on Co rrel ati on -,245( **) -,223( **) -,295( **) -,022 Sig . (2-tail ed) ,002 ,002 ,002 ,891 N 152 195 107 42 MA S_ Qo A.2 Pe ars on Co rrel ati on -,403( **) -,378( **) -,469( **) -,011 Sig . (2-tail ed) ,000 ,000 ,000 ,947 N 152 195 107 42
Tab8.4 STAI _ST ATO. 0 STAI _ST ATO. 1 STAI _ST ATO. 2 STAI _ST ATO. 3 STAI _ST ATO. 4 STAI _TR ATT O MA S_ TO TA L.2 Pe ars on Co rrel ati on -,192( **) -,291( **) -,360( **) -,164 -,433( **) -,243( **) Sig . (2-tail ed) ,008 ,000 ,000 ,070 ,001 ,001 N 189 155 195 123 58 190 MA S_ Qo A.2 Pe ars on Co rrel ati on -,283( **) -,364( **) -,450( **) -,314( **) -,465( **) -,286( **) Sig . (2-tail ed) ,000 ,000 ,000 ,000 ,000 ,000 N 189 155 195 123 58 190 Tab 8.5 EPD S_T OT.0 EPD S_T OT.1 EPD S_T OT.2 EPD S_T OT.3 EPD S_T OT.4 STAI _ST ATO. 0 STAI _ST ATO. 1 STAI _ST ATO. 2 STAI _ST ATO. 3 STAI _ST ATO. 4 STAI _TR ATT O MA S_ TO TA L.3 Pe ars on Co rrel ati on -,117 -,092 -,004 ,192( -*) -,505( **) -,153 -,101 ,068 -,136 -,483( **) -,169 Sig . (2-tail ed) ,205 ,391 ,969 ,032 ,000 ,092 ,342 ,486 ,128 ,000 ,063 N 120 90 106 125 47 122 91 107 126 62 122 MA S_ Qo A.3 Pe ars on Co rrel ati on -,181( *) -,256( *) -,148 -,291( **) -,561( **) -,186( *) -,203 -,012 -,213( *) -,500( **) -,194( *) Sig . (2-tail ed) ,048 ,015 ,131 ,001 ,000 ,040 ,054 ,900 ,017 ,000 ,032 N 117 107 107 107 126 126 126 120 90 106 125
Tab8.6
Eta EPD S_T OT.0 EPD S_T OT.1 EPD S_T OT.2 EPD S_T OT.3 EPD S_T OT.4 STAI _ST ATO. 0 STAI _ST ATO. 1 STAI _ST ATO. 2 STAI _ST ATO. 3 STAI _ST ATO. 4 STAI _TR ATT O MA S_ Pre occ up ati on. 2 Pe ars on Co rrel ati on -,272( **) -,096 -,100 -,052 -,072 -,024 -,079 -,186( *) -,205( **) -,004 -,297( *) -,149( *) Sig . (2-tail ed) ,000 ,195 ,220 ,468 ,460 ,882 ,279 ,020 ,004 ,962 ,024 ,040 MA S_ Pre occ up ati on. 3 Pe ars on Co rrel ati on -,300( **) -,045 ,057 ,101 -,078 -,381( **) -,098 -,006 ,092 -,057 -,395( **) -,115 Sig . (2-tail ed) ,001 ,627 ,595 ,302 ,387 ,008 ,282 ,958 ,346 ,526 ,001 ,208 N 117 120 90 106 125 47 122 91 107 126 62 122Tab 8.7
PDPI _PR E_T OTA L.0 PDPI _PR E_T OTA L.1 PDPI _PR E_T OTA L.2 MA S_ TO TA L.2 Pe ars on Co rrel ati on -,196( **) -,189( *) -,295( **) Sig . (2-tail ed) ,009 ,019 ,000 N 179 154 186 MA S_ TO TA L.3 Pe ars on Co rrel ati on -,213( *) -,164 -,051 Sig . (2-tail ed) ,022 ,121 ,608 N 116 91 103Tab 8.8
PDPI _PR E_T OTA L.0 PDPI _PR E_T OTA L.1 PDPI _PR E_T OTA L.2 PDPI _PR E_T OTA L.3 MA S_ Qo A.2 Pe ars on Co rrel ati on -,290( **) -,291( **) -,399( **) -,460( **) Sig . (2-tail ed) ,000 ,000 ,000 ,000 N 179 154 186 107 N 116 91 103 112 MA S_ Qo A.3 Pe ars on Co rrel ati on -,178 ,233( -*) -,101 -,273( **) Sig . (2-tail ed) ,056 ,026 ,312 ,004 N 116 91 103 112Tab 8.9
EPD S_T OT.0 EPD S_T OT.1 EPD S_T OT.2 EPD S_T OT.3 EPD S_T OT.4 PDPI _PR E_T OTA L.0 PDPI _PR E_T OTA L.1 PDPI _PR E_T OTA L.2 PDPI _PR E_T OTA L.3 PDPI _PR E_T OTA L.4 ST AI_ ST AT O. 0 Pe ars on Co rrel ati on ,564( **) ,415(**) ,320(**) ,407(**) ,072 ,489(**) ,470(**) ,376(**) ,472(**) ,497(**) Sig .ST AI_ ST AT O. 1 Pe ars on Co rrel ati on ,440( **) ,722(**) ,616(**) ,463(**) ,406(**) ,389(**) ,528(**) ,547(**) ,560(**) ,626(**) Sig . (2-tail ed) ,000 ,000 ,000 ,000 ,008 ,000 ,000 ,000 ,000 ,000 N 194 199 155 91 42 189 202 155 90 55 ST AI_ ST AT O. 2 Pe ars on Co rrel ati on ,388( **) ,706(**) ,704(**) ,502(**) ,187 ,327(**) ,432(**) ,594(**) ,502(**) ,642(**) Sig . (2-tail ed) ,000 ,000 ,000 ,000 ,235 ,000 ,000 ,000 ,000 ,000 N 191 156 194 107 42 185 158 193 108 59 ST AI_ ST AT O. 3 Pe ars on Co rrel ati on ,470( **) ,459(**) ,444(**) ,743(**) ,326(*) ,389(**) ,363(**) ,373(**) ,524(**) ,561(**) Sig . (2-tail ed) ,000 ,000 ,000 ,000 ,024 ,000 ,000 ,000 ,000 ,000 N 137 104 122 126 48 133 105 119 128 63 ST AI_ ST AT O. 4 Pe ars on Co rrel ati on ,423( **) ,484(**) ,620(**) ,485(**) ,625(**) ,471(**) ,527(**) ,600(**) ,703(**) ,635(**) Sig . (2-tail ed) ,000 ,000 ,000 ,000 ,000 ,000 ,000 ,000 ,000 ,000 N 75 55 57 62 53 74 54 58 52 73 ST AI_ TR AT TO Pe ars on Co rrel ati on ,534( **) ,547(**) ,527(**) ,441(**) ,080 ,407(**) ,414(**) ,435(**) ,459(**) ,461(**) Sig . (2-tail ed) ,000 ,000 ,000 ,000 ,565 ,000 ,000 ,000 ,000 ,000 N 415 192 189 122 54 402 196 187 123 72
ST AI_ ST AT O. 4 Pe ars on Co rrel ati on ,423( **) ,484(**) ,620(**) ,485(**) ,625(**) ,471(**) ,527(**) ,600(**) ,703(**) ,635(**) Sig . (2-tail ed) ,000 ,000 ,000 ,000 ,000 ,000 ,000 ,000 ,000 ,000 N 75 55 57 62 53 74 54 58 52 73 ST AI_ TR AT TO Pe ars on Co rrel ati on ,534( **) ,547(**) ,527(**) ,441(**) ,080 ,407(**) ,414(**) ,435(**) ,459(**) ,461(**) Sig . (2-tail ed) ,000 ,000 ,000 ,000 ,565 ,000 ,000 ,000 ,000 ,000 N 415 192 189 122 54 402 196 187 123 72
Tab 8.10
PDPI _PR E_T OTA L.0 PDPI _PR E_T OTA L.1 PDPI _PR E_T OTA L.2 PDPI _PR E_T OTA L.3 EP DS _T OT .0 Pe ars on Co rrel ati on ,417( **) ,358(**) ,334(**) ,535(**) Sig . (2-tail ed) ,000 ,000 ,000 ,000 N 398 191 182 121 EP DS _T OT .1 Pe ars on Co rrel ati on ,363( **) ,512(**) ,587(**) ,455(**) Sig . (2-tail ed) ,000 ,000 ,000 ,000 N 183 195 152 89 EP DS _T OT .2 Pe ars on Co rrel ati on ,249( **) ,416(**) ,582(**) ,383(**) Sig . (2-tail ed) ,001 ,000 ,000 ,000 N 178 154 185 106 EP DS _T OT .3 Pe ars on Co rrel ati on ,415( **) ,330(**) ,401(**) ,557(**) Sig . (2-tail ed) ,000 ,001 ,000 ,0005. DISCUSSION
Including a study as a protective factor: The results suggest that women who
have been taken over by the service from the Perinatal Research Unit and
Screening Study (PND-Rescue). seem to be affected to a lesser extent than
epidemiological data, anxiety and depression during the pregnancy period.
This could, presumably, depend on the actual quality of the service that
performs in a continuous and constant monitoring by staff and experienced
and qualified professionals in the recognition, diagnosis and subsequent
treatment of specific diseases encountered during pregnancyn particular, this
service provides, in addition to the primary observation, the possibility of
specific treatment as support the psychological and psychopharmacological
customized to each pregnancy. Earlier diagnosis seems to be able to provide
fast care of pregnant women with an immediate administration (T0) of
specific screening tests.
Trend of Depression and Anxiety during pregnancy:
Although at the time of initial evaluation (T0), levels of anxiety and
depression scores found were similar to those described in the literature,
in the following months (T1, T2) we have seen a gradual but significant
decrease in these values due partly to the inclusion in the study with the
same treatments related to it.
Specifically, with the approaching time of delivery (T3), we can see a slight
increase the depressive component . The anxiety component, however,
does not seem to be sensitive to these issues by maintaining a progressive
decrease throughout pregnancy (T0-T3). This finding might suggest that the
same participation in the study represents a protective factor that can
influence the size more anxious than depressive.
Antenatal attachment, depression and anxiety:
Analysis of the results obtained from the assessment of attachment between
mother and fetus, possible to examine the protective role with respect to the
onset of diseases of anxiety or depression. In particular, the qualitative
dimension of attachment appear to affect, in the vicinity of the sixth month
of gestation, the component of depressive and anxious, because a better
quality of attachment seems likely to be a protective factor with respect to
the manifestation of symptoms of depression / anxiety during pregnancy. It
does not appear to affect the quality of attachment , however , the symptoms
anxious /depressives near delivery .
From our data, we can see also that the variable Attachment Preoccupation
component does not seem to influence either the anxious or depressive. So
we can assume that all the concerns about the fetus does not represent a
clear risk factor. On the contrary, it is conceivable that the quality of
attachment represents a risk factor to be taken into account during the early
stage of screening. This hypothesis suggests the possible need to perform
more frequent monitoring on pregnant women in order to better specify a
number of risk factors can that be inserted in a specific screening protocol
on the quality attachment.
Primiparous versus Multiparous:
Contrary to previous reports (Condon & Esuvaranathan, 1990).
mothers in their first pregnancy seem to have higher levels of attachment
compared
to
multiparae.
This result may be partly explained by differences in lifestyle (quantity and
quality of time spent with your thoughts on the developing fetus) and seems
to affect depressive symptoms in the last trimester of gestation, confirming
the hypothesis that 'maternal attachment toward the fetus can be considered
a protective factor. This finding is strengthened by the fact/result from
having found that first-time mothers found to have lower scores due to risk
factors compared to multiparous near term (T3).
To check the intensity and direction of the relationships between depression,
anxiety, attachment to the fetus and risk factors, was performed Pearson
bivariate correlation.
First we found a positive correlation between age and levels of state anxiety
at the time of inclusion in the study, in the first quarter and after the birth of
children (T0, T1 and T4) and stroke. This finding allows us to hypothesize
that increasing age, the woman is suffering more anxiety related to the
management of pregnancy and childbirth.
Was also noted that younger women establish a better attachment with the
fetus, probably because they are less anxious towards the course of
gestation.
The MAAS tot recorded during the second trimester of pregnancy (T2)
seems to confirm the data obtained previously, noting a negative correlation
between levels of attachment, values of depression and anxiety throughout
the pregnancy period.
Furthermore, the data collected, suggest that treatment of anxiety can be
predictive of a correct development of attachment to the fetus as well as
suffer from a few specific risk factors (recorded by PDPI).
Finally, with regard to the levels of attachment to the third trimester (T3),
confirming the trend towards a negative correlation with levels of
depression even in the postpartum period (T4).
Going in particular, the analysis of the qualitative aspects of attachment, in
the second and third trimesters of pregnancy, the data collected confirm a
negative correlation between attachment and depressive symptoms, anxiety
(state and trait) and risk factors throughout the gestation period and after
childbirth.
As for issues of concern in the area of attachment during the third quarter, it
is possible that they may constitute potential risk factors for the onset of
depression or anxiety in post-partum.
As confirmed by the literature, there is a positive correlation between
anxiety, depression and risk factors.
From the collection of all of these data, it can be concluded that the third
trimester of pregnancy appear more likely to be sensitive to the period
throughout the pregnancy. This might be justifiable in terms of
metabolic-hormonal changes, the possibility that the mother steps from a idealized
image of their child to a realistic representation of their child. In addition, a
further factor of significant importance can be represented by the net change
in terms of lifestyle where pregnant women are facing near most recently
stored data trimester of pregnancy.
Limitations of present study
The limitations of present study primarily consists of
the scarcity of data
collected in the postpartum period (T4) and the absence of definitive
follow-up to a year after delivery.
Furthermore, another limitation is the difficulty of having to draw together
data that describe qualitative and quantitative in the post-partum period,
in order to observe a continuity between attachment to the fetus or child.
A further limitation is the absence of a control group of pregnant women
because it is impossible
ethically
to exclude from the treatment of these
women.
6. CONCLUSION
Many of the physiological sensations that occur during pregnancy closely
resemble anxiety symptoms; thus, these disorders may be masked in
pregnant women. For this reason it is essential that treatment providers in
obstetric offices, primary care settings, and mental health clinics be
attuned to the signs of anxiety disorders (Weisberg and Paquette, 2002).
Moreover, it is important to differentiate between manageable antenatal
anxiety and depression occurring as transition to parenthood and the
more debilitating antenatal anxiety and depression condition that require
specific assessment and treatment by a mental health professional as
others have noted (Austin, 2003; Austin et al., 2005; Glover and O’Connor,
2002), it may be just as important to focus on the detection and treatment
of perinatal anxiety, given its significant association with the development
of subsequent postnatal depression.
Pregnancy may be an ideal time for
intervention, to mitigate the mother’s suffering and to reduce the
long-term consequences of an untreated mental disorder.
Carrying out
antenatal screening of established risk factors and accurate evaluation of
attachment during pregnancy
may help to plan adequate treatment in
natal attachment during pregnancy and its link with Post-Partum
Depression in order to
identify a specific subgroup of women warranting
special attention.
7. BIBLIOGRAPHY:
Adewuya AO, Ola BA, Aloba OO and Mapayi BM. Anxiety disorders among Nigerian women in late pregnancy: a controller study. Arch Women Mental Health 2006; 9: 325-328.
Agenzia Regionale Sanità Toscana. Nascere in Toscana anni 2002–2004 documenti ars 21, 2006.
Altshuler L, Hendrick V, Cohen L. Course of mood and anxiety disorders during pregnancy and the postpartum period. J Clin Psychiatry 1998; 2:29-33.
American Psychiatric Association. Diagnostic and Statistical Manual of Mental Disorders, Fourth Edition. Washington, DC: American Psychiatric Association 1994. Andersson L, Sundström-Poromaa I, Bixo M, Wulff M, Bondestam K, åStröm M. Point prevalence of psychiatric disorders during the second trimester of pregnancy: a population-based study. Am J Obstet Gynecol 2003; 189(1):148–154.
Andersson L, Sundstrom-Poromaa I, Wulff M, Astrom M, Bixo M. Depression and anxiety during pregnancy and six months postpartum: a follow-up study. Acta Obstet Gynecol Scand. 2006; 85: 937–944.
Andrade L, Eaton WW, Chilcoat H. Lifetime comorbidity of panic attacks and major depression in a population-based study: symptom profiles. Br J Psychiatry 1994; 16: 363–369.
Andrade L, Eaton WW, Chilcoat HD. Lifetime co-morbidity of panic attacks and major depression in a population-based study: age of onset. Psychol Med 1996; 26 (5): 991–6. Angst J. Comorbidity of mood disorders: a longitudinal prospective study. Br J Psychiatry 1996; 168 (30): 31–37.
Ainsworth, M. D. S., Blehar, M. C., Waters, E., & Wall, S. (1978). Pattern of attachment: A psychological study of the strange situation. Hillsdale, NJ: Erlbaum.
Appleby, L., Warner, R., Whitton, A., & Faragher, B. (1997). A controlled study of fluoxetine and cognitive-behavioural counselling in the treatment of postnatal depression. British Medical Journal, 314, 932-936.
Austin, MP, Tully L, Parker G. Examining the relationship between antenatal anxiety and postnatal depression. J Affect Disord 2007; 101 (1–3): 169–174.
Bandelow B, Amering M, Benkert O, Marks I, Nardi AE, Osterheider M, Tamock Ch, Tremper J, Versiani M. Cardio-respiratory and other symptom clusters in panic disorder.
Bandelow B, Wedekind D, Pauls J, Broocks A, Hajak G, Rüther E. Salivary cortisol in panic attacks. Am J Psychiatry 2000; 157(3): 454–6.
Bandelow B, Wedekind D, Sandvoss V, Broocks A, Hajak G, Pauls J, Peter H, Rüther E. Diurnal variation of cortisol in panic disorder. Psychiatry Res 2000; 95(3): 245–50. Bandelow B, Sojka F, Broocks A, Hajak G, Bleich S, Rüther E. Panic disorder during pregnancy and postpartum period. European Psychiatry 2006; 21: 495-500.
Barber, J. P. (2009). Towards a working through of some core conflicts in psychotherapy research. Psychotherapy Research, 19, 1-12.
Beal, D. J., Corey, D. M., & Dunlap, W. P. (2002). On the bias of Huffcutt and Arthur's (1995) procedure for identifying outliers in the meta-analysis of correlations. Journal of Applied Psychology, 87, 583-589
Beck, A. T., Rush, A. J., Shaw, B. F., & Emery, G. (1979). Cognitive Therapy of Depression. New York: Guilford Press.
Beck CT. Postpartum onset of panic disorder. Image J Nurs Sch 1998;30: 131-135. Beck CT. Predictors of postpartum depression: an update. Nurs Res 2001; 50: 275–285. Beck, CT. Revision of the postpartum depression predictors inventory. J Obstet Gynecol Neonatal Nurs 2002; 31: 394–402.
Beck CT, Records K, Rice M. Further development of the postpartum depression predictors inventory-revised. J Obstet Gynecol Neonatal Nurs 2006; 35 (6): 735–745. Bekker MHJ: Agoraphobia and gender: a review. Clin Psychol Rev 1996; 16: 129–146. Bennett, H. A., Einarson, A., Taddio, A., Koren, G., & Einarson, T. R. (2004a). Depression during pregnancy: Overview of clinical factors. Clinical Drug Investigation, 24, 157-179. Bennett, H. A., Einarson, A., Taddio, A., Koren, G., & Einarson, T. R. (2004b). Prevalence of depression during pregnancy: Systematic review. Obstetrics & Gynecology, 103, 698-709.NJ
Berryman, J. C., & Windridge, K. C. (1996). Pregnancy after 35 and attachment to the fetus. Journal of Reproductive and Infant Psychology, 14, 133–143.
Bittner A, Goodwin RD, Wittchen HU, Beesdo K, Höfler M, Lieb R. What Characteristics of Primary Anxiety Disorders Predict Subsequent Major Depressive Disorder? J Clin Psychiatry 2004; May, 65: 5.
Bledsoe, S. E., & Grote, N. K. (2006). Treating depression during pregnancy and the postpartum: A preliminary meta-analysis. Research on Social Work Practice, 16(2), 109-120
Bloom, K. C. (1995). The development of attachment behaviours in pregnant adolescents. Nursing Research, 44, 284–288.
Borenstein, M., Hedges, L., Higgins, J., & Rothstein, H. (2005). Comprehensive Meta-analysis Version 2,
Biostat, Englewood Bloch M, Schmidt PJ, Danaceau M, Murphy J,
Nieman L, Rubinow DR. Effects of gonadal steroids in women with a history postpartum depression. Am J Psychiatry 2000; 157(6): 924–30.
Briggs AC, Strech DD, Brandon S. Subtyping of panic disorder by symptom profile. Br J Psychiatry 2003; 163: 201-209.
Brown, S., Lumley, J., Small, R., & Astbury, J. (1994). Missing voices: The experience of motherhood. Oxford: Oxford University Press.
Brouwers EPM, Van Baarb AL, Popc VJM. Does the Edinburgh Postnatal Depression Scale measure anxiety? J Psychosom Research 2001; 51: 659– 663.
Buckwalter JG, Stanczyk FZ, McCleary CA, Bluestein BW, Buckwalter DK, Rankin KP, Chang L, Goodwin TM. Pregnancy, the postpartum, and steroid hormones: effects on cognition and mood. Psychoneuroendocrinology 1999; 24(1): 69–84.
Cameron O, Kuttesch D, McPhee K, Curtis G. Menstrual fluctuation in the symptoms of panic anxiety. J Affect Disord 1988; 15(2): 169-74.
Cameron OG, Hill EM. Women and anxiety. Psychiatr Clin North Am 1989; 12: 175–186. Carpiniello B, Pariante CM, Serri F, Costa G, Carta MG. Validation of the Edinburgh Postnatal Depression Scale in Italy. J Psychosom Obstet Gynaecol. 1997; Dec 18(4): 280-5.
Cassano GB, Petracca A, Perugi G, Toni C, Tundo A, Roth M. Derealization and panic attacks: A clinical evaluation on 150 patients with panic disorder/agoraphobia. Compr Psychiatry 1989; 30: 5-12.
Cassano GB, Michelini S, Shear MK, Coli E, Maser JD, Frank E. The Panic-Agoraphobic Spectrum: a descriptive approach to the assessment and treatment of subtle symptoms. Am J Psychiatry 1997; 154: 27-38.
Cassano GB, Rotondo A, Maser JD. The Panic-Agoraphobic Spectrum: rationale, assessment, and clinical usefulness. CNS Spectrums 1998; 3: 35-48.