International Journal of Engineering Business Management
The Effect of Slot-Code Optimization
in Warehouse Order Picking
Regular Paper
Andrea Fumi
1,*, Laura Scarabotti
1and Massimiliano M. Schiraldi
11 University of Rome “Tor Vergata”, Department of Enterprise Engineering Operations Management Research Group, Roma, Italy * Corresponding author E-mail: [email protected]
Received 27 March 2013; Accepted 20 May 2013 DOI: 10.5772/56803
© 2013 Fumi et al.; licensee InTech. This is an open access article distributed under the terms of the Creative Commons Attribution License (http://creativecommons.org/licenses/by/3.0), which permits unrestricted use, distribution, and reproduction in any medium, provided the original work is properly cited.
Abstract This work presents the effect, in terms of travel distance and material handling time reductions, of an optimal rather than a uniform item allocation in one-block picking warehouses, both with and without the use of a simple picking heuristic. Since developing efficient product-location strategies represents a critical issue in Operations Management, due to the impact on warehouse performance in terms of both service level and operation costs, this paper focuses on an effective quantification of obtainable travel time reductions, obtaining a significant result for manufacturing companies aiming to determine the most appropriate material handling resource configuration. Building on previous work on the effect of slot-code optimization on travel times in single/dual command cycles, the authors broaden the scope to include the most general picking case, thus widening the range of applicability and realising former suggestions for future research.
Keywords Order Picking, Travel Distance, Random/Optimized Product Allocation, One-Block Warehouse, Material Handling, Slot-Code Allocation Optimization, Storage Assignment
1. Introduction
According to several reports, about 23% of logistics costs in the US [1] and 39% in Europe [2] are due to warehouse capital and operating costs. Given the extent of this impact on companies’ supply chains, cost-effective management of warehouses has always been considered as critical to the success of businesses [3, 4, 5, 6, 7, 8]. It has been suggested that an efficient layout configuration and material handling system are, from the warehouse perspective, mainly detectable at the organizational stage [9, 10, 11, 12]. The linked costs seem to be mostly induced by the use of tracing technologies [13, 14, 15] besides appropriate item allocation [ 16, 17, 18, 19, 20, 21, 22]. Order picking is the most labour-intensive and time-consuming task in most warehouses [23], and improving its performance can generally involve huge investments. Indeed, up to 55% of total warehouse operating costs results from order picking operations [24]. Correct management of warehouse storage and picking actions can instantly impact the success of logistics operations in most manufacturing companies and play a vital role in their survival [25]. Each picking order contains a subset of items stored in a warehouse; a picking tour specifies the sequence in which items will be picked. Thus, an order
picking cycle means that workers travel from a common pickup/deposit (P/D) or input/output (I/O) point to a specific location on the picking list, pick the required items and move them back to the I/O point. As Christofides underlined in 1975 [26], the routing of manual pickers within the aisles of a warehouse can be considered as a special case of the well-known travelling salesman problem, based on the hypothesis that forklifts move following a “Manhattan” (i.e., “rectilinear”,
“right-angle” or “L1”) metric [27]. From an organizational
perspective, performances of a storage area are based on two variables: the space required for item allocation and the time needed for their handling [28, 29]. Considering the aforementioned warehouse typology, three key factors mainly influence the overall travelled distance: warehouse space, layout and picking list size [30], based on the assumption that workers process only one order at a time and that each order does not exceed the forklift’s capacity. Due to the great relevance of warehouse operations cost savings, this paper focuses on the estimation of material handling distance reductions for order picking cycles in one-block warehouses; to this end, the results of several simulations carried out assuming a variable picking list size with optimal item allocation and a uniform distribution of storing and picking positions, with and without use of a picking heuristic, will be shown and analysed.
2. Previous research
In pursuit of savings on order pickers and equipment optimizing order picking routes – thus choosing the best sequence for the order picker to visit specific locations, minimizing the distance travelled – several studies have been carried out over the past years. Given that the order
picker has to collect a number of products in specified
quantities at known locations, the problem of finding the shortest order picking route for warehouses with a central depot can be solved in running time as linear in the number of aisles and the number of pick locations [31].
Many authors have focused on modelling approaches to improve the efficiency of material handling times to gain better performance in the supply chain; several scientific contributions have aimed to minimize material handling costs or picking operations, evaluating new optimization criteria [32, 33, 34, 35, 36, 37, 38]. Lots of studies have centred on the general case of the order picking cycle due to its importance in increasing operation efficiency and decreasing labour workload [39]. The main aims of many publications have been the determination of the shortest travel distance and the optimal pick tour for a given set of pick locations in warehouses with two cross aisles [31] or more [40] with a dynamic programming approach. Roodbergen and De Koster [41] applied the Ratliff/Rosenthal algorithm to warehouses with middle
cross-aisle warehouses. Focusing on the non-random storage policy perspective instead, Hwang et al. [442] and Caron et al. [43] modelled an analytical expression assuming turnover-based storage policies. Comparisons on the optimal routing and heuristics for picking problems, however, have rarely been presented [44, 45, 46].
In 1994, Gelders and Heeremans [47] solved the order picking problem by using the branch-and-bound algorithm of Little et al. [48] for a simplified warehouse layout: reductions gained in terms of total walking distance varied between 9% and 40%, depending on the number of products to be picked. The problem of finding order picking routes in a storage area is often solved by the so-called S-shape heuristic, in which order pickers move in an S-shaped curve along the pick locations, skipping the aisles where nothing has to be picked. More advanced heuristics can be found, however, in Hall [49]. Roodbergen and De Koster [50] later applied the Ratliff and Rosenthal’s algorithm considering warehouses with middle cross aisles. Hwang et al. [42] and Caron et al. [43], on the other hand, modelled an analytical expression assuming a non-random storage policy. Petersen [44] and De Koster and Van der Poort [45] made an important contribution by providing some comparisons on the optimal picking tour and heuristics for picking problems. As Pohl, Meller and Gue underlined [51], however, a closed-form equation to estimate the optimal tour for a general number of picks seems not to be available in the literature. To forecast an optimal picking tour length, simulations using routing heuristics based on the hypothesis of a random storage policy have been performed [52, 53, 54]. Some authors have also developed a procedure for reducing order picking travel distance through an order batching optimization heuristic based on integer programming. This methodology combines several orders into batches to reduce the overall travel time [55, 56, 58, 59] but implies high-level computation efforts [59].
Based on an integer programming approach, a possible mechanism for reducing order picking travel distance through a class-based storage method was developed by Muppani and Adil [60]. In 2008 the same authors [61] presented a possible way to reduce order picking operations for class-based storage arrangement, developing a nonlinear integer programming method using the branch and bound algorithm. In the same year, Ho et al. [62] proposed an additional methodology aiming at the development of distance or area-based rules to minimize the travel distance of pickers; this technique is based on order batching procedures for an order-picking warehouse. In the last two years, Burinskiene [63] has proposed the volume-based storage method and the
usage of correlation between order picking efficiency and stock accuracy to achieve an optimization of order picking processes; Ene and O¨ztu¨rk [64] have instead used both the batching and routing problems to minimize travel costs in warehouse operations.
A brief summary of some of the main complete papers on travel distance for stacking and picking procedures inside warehouses is presented below.
Staking Picking
Mayer [65], Francis [66], Hausman et al. [67], Graves et al. [68], Schwarz et al. [69], Bassan et al. [70], Bozer and White [71], Malmborg et al. [72], Malmborg [73], Hwang and Ko [74], Pandit and Palekar [75], Koh, Kim, and Kim [76], Pohl, Meller, and Gue [51], Chen and Li [77], Salah [78, Pohl et al. [79], Azzi et al. [80], Fumi et al. [38]
Ratliff and Rosenthal [31], Hall [49], Petersen [44], De Koster et al. [45], Vaughan and Petersen [40], Petersen and Schmenner [81], Caron et al. [43], Roodbergen et al. [41], Hwang, Oh, and Lee [42], Roodbergen and Vis [52], Le-Duc and De Koster [53], Roodbergen, et al. [54], Muppani and Adil [60], Muppani and Adil [61], Ho, et al. [62], Burinskiene [63], Qiana and Jie, [39], Pan, et al. [46], Ene and Ozturk [64]
Table 1. Literature review of travel distance models for different
warehouse systems
Generally speaking, optimal routing algorithms are infrequently used. Indeed, it seems that the application of the algorithm to layouts different to the model containing parallel aisles and a central depot has not been considered at all in the literature. The savings produced by using optimal algorithms are not clear in advance. It is also to be underlined that there are extra expenses and risks related to the implementation of the optimal algorithm, mainly because of its complexity.
Without any loss of generality, it seems that no closed-form evaluation technique is yet available to estimate the optimal tour length for a general number of picks [51] and that so far, the simulation required to forecast this length has been performed using routing heuristics while assuming a random storage policy [52, 53, 54]. It is well known that, in most contexts, different heuristics may lead to extremely different results [82].
This paper seems to be the first to contribute to the estimation of material handling time reduction for picking operations, using optimal item allocation rather than a uniform distribution of picking and storage locations. Results are calculated through simulations, based on a variable picking list size, with the aim of underlining the effect of different slot-code optimization levels on the reduction of average distances travelled. The comparison is carried out both with and without the most commonly used heuristic.
3. Warehouse layout design and routing methodologies
A warehouse is usually organized with a number of aisles of equal length with products stored on both sides; in most cases, forklifts or trucks can traverse the aisles in both directions. Each order consists of a number of products; these may be located in different aisles. In this paper we assume that the items of each order must be picked in a single route, that the warehouse has a single I/O point and that the picking area has a cross aisle both at the front and the rear to enable aisle changes: these are generic assumptions that fit most industrial cases. Generally speaking, an order is received from the company and transformed into a picking list. This arrives at the warehouse and an order picker is sent into the picking area with the list to retrieve the requested items from storage. The process of picking products consists of a series of actions, ranging from positioning the vehicle to putting the picked items on a product carrier; most of the efforts to improve the operational efficiency of order picking are focused on routing, batching, and storage assignment: usually, however, a large part of an order picker’s time is spent travelling.
Research regarding storage assignment is mainly concerned with rules for the assignment of products to storage locations. Existing rules vary from random policies, where storage locations are randomly assigned to products, to fast/slow-movers storage, where items with the highest pick frequency are assigned to the most accessible locations. Products may be divided into A, B, C classes according to their picking frequency, in order to simplify the slot-code allocation [81].
In this work, we consider a manual order picking operation where the order picker travels through a picking area to retrieve items from storage. In the literature, as stated above, a uniformly distributed item location is usually assumed. However, random storage is seldom used in practice: it may only occur in situations where the product assortment changes too fast to produce reliable statistics about demand frequency [57].
In this paper, travel times under a uniform distribution assumption are compared with those obtained under the hypothesis of an optimal allocation. The maximum level of optimality is reached when the items with the highest picking frequency (“fast-movers”) are located nearer to the I/O point. Three levels of “optimality” are assumed, i.e., “low”, “medium” and “high” optimization, and are formalized in the following paragraphs. The estimates presented in this work may provide an easy-to-use criterion to obtain a rough evaluation for the expected picking travel distance and time in practical cases.
Different warehouse layouts have been analysed in the literature, by Gu, Goetschalckx, and McGinnis [83] as well as by Meller and Gue [84], showing different aisle designs such as “Flying-V”, “Fishbone” and “Chevron”. Due to their widespread use in industry, this paper concentrates on one-block unit-load warehouses (Figure 1).
Figure 1. One-block warehouse vs. two-block warehouse A detailed description of order-picker routing policies, such as the “s-shape”, “return”, “mid-point”, “largest gap”, “combined” and “optimal” methods, was presented by De Koster, Le-Duc, and Roodbergen [24].
Figure 2. Order picking routing policies
All of these techniques were originally developed for one-block warehouses but can be used in a multiple-one-block context by implementing specific changes. According to Vaughan and Petersen [40] and Roodbergen and De Koster [30, 41], the combined heuristic returns the best results in 93% of analysed instances. According to this methodology, a decision whether to entirely traverse an aisle with at least one pick, or enter and leave the aisle from the same side, should be computed using dynamic programming [41].
Despite using complex dynamic programming algorithms, industrial companies prefer to solve their picking routing problem with simple and easily manageable heuristics. Usually, the heuristic involves a preordination of the picks required by the picking list, starting from one side of the warehouse and proceeding on the basis of nearer picks. Thus, starting from the selected I/O point of the warehouse, unloaded material handling vehicles first horizontally and vertically move to the leftmost (or rightmost) location of the picking list; then, once they have reached this location and performed the picking operation, they horizontally and vertically move to the next nearest location for the second pick, accessing it from the front or the back cross aisle, depending on the minimum travel distance (Figure 2).
After having performed all the picks of the picking list, they exit from the output point. Obviously, the vehicle does not enter aisles without picks. This heuristic is the one most commonly adopted in real contexts due to its simplicity: it is therefore also the heuristic considered in this analysis.
Figure 3. Example of paths for selected picking cycle
4. Simulation technique
The main purpose of this work is to analyse the differences, in terms of picking distances and times, between three optimized slot-code location (OPT) scenarios and a random location (RAN) inside a warehouse. Warehouse management systems are currently used to gain an optimization of slot-code allocation, which clearly reduces stacking/picking travel times. Nevertheless, an exact estimation of this time reduction is considered to be of great significance for manufacturing, distribution and retailing companies, because it can help in the design of the warehouse as well as in determining the right type and number of handling vehicles. The comparison will be carried out through simulation over 100,000 runs, offering an original contribution to estimate the effects of picking heuristics on the reduction of picking average distances, varying the warehouse slot-code optimization level together with its I/O position and shape simulation.
A generic stacking warehouse was considered. According to the literature, the rectangular shape is the optimal geometric shape to store pallets [85]; the initial storage area was therefore assumed to be rectangular, with one input and one output point:
Xthe storage area longitudinal width; Y the storage area lateral depth;
(xout ; yout)the output coordinates;
(xin; yin)the input coordinates.
where xout ≤ X and yout ≤ Y, xin ≤ X and yin ≤ Y.
All these variables are independent and could be varied to perform multiple what-if analyses. In order to consider the most common warehouse case, all simulation runs have been performed assuming a single input/output point located in the middle of the warehouse’s long side: this choice is also supported by evidence shown by Bassan, Roll, and Rosenblatt [70]: indeed. These authors
show how this configuration represents the best solution to minimize storage/retrieval travel times in warehouses with a longitudinal width twice the lateral depth. The 2-D coordinates of a single storage location in the warehouse can thus be identified by a pair (x;y). Forklifts are assumed to move following the “Manhattan” (i.e.,
“rectilinear”, “right-angle” or “l1”) metric [27]; thus,
workers are able to travel along the two main orthogonal aisles at the front and back of the storage area as well as along cross aisles.
4.1 Random generation of input variables
Depending on the number of picks considered, one or
more picking (xpick ; ypick ) points inside the warehouse are
randomly identified for each run. The random generation rule, as performed by Hall [49] in the development of a heuristic to estimate a shortest tour length lower bound, followed a uniform distribution for the case in which no slot-code allocation optimization was performed; correspondingly, a specific custom distribution was used for the case with fast-mover items located near the input/output point. Thus, for the random case, for each pick point i:
xpicki =ξxi where ξxi is a random variable 0 ≤ ξxi ≤ X
ypicki = ξyi where ξyi is a random variable 0 ≤ ξyi ≤ Y In the second case, in order to represent an optimized slot-code allocation, the x and y coordinates of the picking points were generated with a random inverse transform sampling from Normal distribution. Considering that simulations assumed a single input/output point located on the warehouse front side (xin = xout; yin = yout = 0), we have:
xpick1 results from
1 2 pick in 1 x x x (x x ) 1 exp 2 2 ξ σ σ π − − = ⋅ ⋅ ⋅
where ξ x1 is a random variable 0 ≤ ξ x1 ≤ 1
y pick1 results from
1 2 pick 1 y y y (y ) 1 exp 2 2 ξ σ σ π − = ⋅ ⋅ ⋅
where ξ y1 is a random variable 0 ≤ ξ y1 ≤ 1 and analogously, for each pick point i,
x picki results from
i i 1 2 pick pick i x x x (x x ) 1 exp 2 2 ξ σ σ π − − − = ⋅ ⋅ ⋅
where ξ3 is a random variable 0≤ξ xi ≤1
y picki results from
y 2 pick i y y y (y ) 1 exp 2 2 ξ σ σ π − = ⋅ ⋅ ⋅
where ξ4 is a random variable 0 ≤ξ yi ≤ 1
The user-specified input parameters σx and σy measure
the spreading of products all over the storage area. Thus, the condition
represents a case in which few or no products have been correctly assigned to slots (i.e., the slot-code allocation is far from being optimized) while
displays a situation in which few fast-mover products have been located far from the input/output point. Clearly, due to Normal distribution right and left tails, generating the random coordinates with the inverse transform method led to the unacceptability of some coordinates; more specifically, values were discarded if at least one of the following conditions was verified for each pick point i:
xpicki < 0 and xpicki > X
ypicki < 0 and ypicki > Y
4.2 Hypotheses on routing paths
In the designed warehouse, picking operations were simulated using the following approach. A forklift truck was assumed to:
1. start at the input point (xin; yin), unladen;
2. horizontally and vertically move to the first (xpicki ;
ypicki) picking location, with i = 1;
3. perform the picking operation after reaching the picking location;
4. horizontally and vertically move to the next (xpicki+1 ;
ypicki+1) picking location;
5. continue going to step 3 until the pick points are finished;
6. horizontally and vertically move to the location (xout;
yout);
7. exit from the output point.
According to the previously cited simple heuristic, the first pick will be the leftmost one on the picking list; when moving to the next pick point, the picker is assumed to
>> >> Y X y x σ σ << << Y X y x σ σ
always choose the best alternative (shorter distance) between reaching the front or rear longitudinal aisle. Thus, the overall distance OD travels to perform a cycle on n picks is equal to:
1 1 in pick in pick i i 1 pick pick n 1 i i 1 pick pick i 1 i i 1 pick pick n n
pick out pick out
OD x x y y y y ; min 2 Y y y x x x x y y + − + = + = − + − + + + + ⋅ − − + − + − + −
∑
An overall number of more than 100,000 runs have been simulated, considering 2-pick, 6-pick and 10-pick cases varying the optimality of the warehouse slot-code allocation. When calculating picking distances in the best optimized slot-code location case, a high percentage of the 100,000 samples was discarded in each simulation run, due to picking coordinates outside warehouse boundaries. As a consequence, the relative picking distances were calculated basing on acceptable values only.
5. Simulation results
The presented results refer to simulations performed under the hypothesis of a unique input/output point located in the middle of the warehouse’s rear side, assuming a longitudinal width twice the lateral depth, thus:
(xin ; yin)= (xout ; yout) = (X/2; Y)
X = 2 ⋅Y
The generation rule followed a uniform distribution for the random case, while a random inverse transform sampling from the Normal distribution was used to represent the optimal slot-code allocation case. Results of the forklift’s travel distance simulations are summarized in the following tables, comparing the optimized slot-code allocation case (OPT) and the random case (RAN). In the former, three scenarios were considered, according to the methodology presented in Fumi et al. [38].
– A first scenario (LOW) characterized by a “low
effective” slot-code optimization (e.g., fast-mover items turnover ratio similar to slow-movers) represented by σx = σy = 26.6;
– A second scenario (MED) characterized by a
“medium effective” slot-code optimization,
represented by a σx = σy = 30.0 value;
– A third scenario (HI) characterized by a “high
effective” slot-code optimization (e.g., fast-mover item turnover ratio deeply different from
slow-mover ratio), represented by σx = σy = 16.0 value.
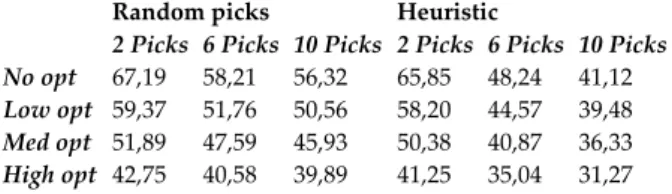
Despite the fact that this paper does not focus on picking techniques but on the effect of slot-code optimization, for the sake of completeness the consequences of the heuristic adoption are presented in Table 2 and Table 3. Table 2 shows the average distances per pick considering an 80x40–metres rectangular storage area for a 2-pick, 6-pick and 10-6-pick case, analysing either when the 6-pick sequence is random or when it follows the described heuristic, both for optimized and un-optimized slot-code allocations.
Random picks Heuristic
2 Picks 6 Picks 10 Picks 2 Picks 6 Picks 10 Picks No opt 67,19 58,21 56,32 65,85 48,24 41,12 Low opt 59,37 51,76 50,56 58,20 44,57 39,48 Med opt 51,89 47,59 45,93 50,38 40,87 36,33 High opt 42,75 40,58 39,89 41,25 35,04 31,27
Table 2. Simulation results of average travelled distance in
metres on an 80x40 m area
The effects of the adoption of this simple picking heuristic following a higher or lower slot-code optimization are summarized in Table 3 as the:
- percentage decrease from RAN to OPT ( LOW ) case;
- percentage decrease from RAN to OPT ( MED ) case;
- percentage decrease from RAN to OPT ( HI ) case.
2 Picks 6 Picks 10 Picks
No optimization 1,99% 17,14% 26,99%
Low optimization 1,97% 13,89% 21,91%
Medium optimization 2,91% 13,66% 21,62% High optimization 3,51% 13,64% 21,60%
Table 3. Reduction of average travelled distance as a result of
heuristic adoption
As expected, simulation results display greater improvements as the number of picks in the picking list increases. Clearly, the percentage reduction of average distance per pick decreases if using effective slot-code allocation criteria, because improvement margins become narrower. Figure 4 and Figure 5 show this effect, representing the average distance per pick on the 80x40 m area.
Figure 4. Average distance per pick (80x40 m area), random pick
Figure 5. Average distance per pick (80x40 m area), heuristic case The following figures present the breakdown of the slot-code optimization effects, in terms of percentage decrease of the average distance per pick from the random case to each optimization degree case (LOW, AVG, HI), respectively in 2-, 6- and 10-pick cases, both with and without the use of a picking heuristic. These numeric results are highly useful for manufacturing companies wishing to determine the right type and number of material handling resources, according to their capabilities in optimizing their warehouse.
Figure 6. Reduction of average distance per pick (2-pick case)
Figure 7. Reduction of average distance per pick (6-pick case) In the 2-pick case, a highly effective slot-code optimization can lead to up to a 36.4% reduction of the average distance per pick compared to a randomized item location in the warehouse. Clearly, the heuristic adoption does not change these results, because no improvement is possible to change the sequence of two picks only.
Figure 8. Reduction of average distance per pick (10-pick case) Figure 7 and Figure 8 show that a further reduction of the average distance per pick is achieved as the number of picks increases, due to a higher pick-point density within the warehouse area. At the same time, it is possible to see that improvements due to a better slot-code optimization are reduced when the heuristic is used: this is because these percentages are computed comparing the optimized cases with the random allocation scenarios, where the heuristic has already managed to reduce the average distance per pick (as evident from the comparison of Figure 4 and Figure 5).
6. Limitations of the study
The research limitations include the assumptions of a unique size of storage locations (single shelf type) and of two-way aisles, which may not be valid for every industrial warehouse; however, these hypotheses have often been assumed in similar studies [36]. As well as removing the single shelf assumption and evaluating the influence of one-way aisles presence, future research should include simulations performed varying the shape of the storage area, the location and number of orthogonal aisles, the positions of the input and of the output point and, eventually, include material handling vehicles with different performance characteristics.
7. Conclusion
While the scientific literature mainly focuses on random slot-code allocations for traditional unit-load warehouses, the majority of companies are looking for a methodology to achieve optimal SKU placement without the need for expensive information systems. Furthermore, current research has mainly aimed to reduce warehouse operation costs through the minimization of material handling average travel distance by optimizing item location, instead of concentrating on picking operations. Given that over 50% of a warehouse’s overall expenses results from order picking operations, this paper, through multiple simulations, has aimed to be the first to address a precise and measurable estimation of picking material handling distances varying the slot-code assignment optimality – both when a simple picking heuristic is used and when it is not. Overcoming the single/dual command
hypothesis of the authors’ original work, the main purpose of this paper is thus to underline and quantify the advantages that emerge from using a slot-code optimization rather than a random one, comparing material handling systems performance for 2, 6 and 10-picking cycles. Each comparison was carried out considering three different scenarios, respectively representing a null, low, medium and high level of slot-code optimization. Notwithstanding an expectable decrement of travel distances from the random scenario to the optimal one, simulations helped in an exact determination of these reductions. The importance of these results is crucial, especially for manufacturing, distribution and retailing companies seeking both an efficient design for their warehouse and the most appropriate type and number of material handling vehicle [82].
8. References
[1] Davis, H.W. (edited by) , 2011. Logistic Cost and Service. Annual global conference, Council of Supply Chain Management Professionals, Philadelphia. [2] Groothedde, B., 2012. European Warehousing Labour
Cost [online], Argusi, Supply Chain Management: Market Intelligence, Optimization and Collaboration. Available from: http://www.argusi.org/2011/11/28/ european-warehousing-labour-cost/
[3] Morton, R.J., 1974. An approach to warehouse design – matching the concept to the throughput.
International Journal of Retail and Distribution Management, 2 (6), 42–45.
[4] Kamarainen, V., Smaros, J., Holmstrom, J., Jaakola, T., 2001. Cost-effectiveness in the e-grocery business.
International Journal of Retail and Distribution Management, 29 (1), 41–48.
[5] Frazelle, E.H., 2002. Supply Chain Strategy. New York: McGraw-Hill.
[6] Richards, G., 2011. Warehouse Management – A Complete Guide to Improving Efficiency and Minimizing Costs in the Modern Warehouse. Kogan Page Publishers, London (UK).
[7] Pettersson, A.I. and Segerstedt, A., 2012. Measuring supply chain cost. International Journal of Production
Economics, 143 (2), 357-363.
[8] Falsini, D., Fondi, F. and Schiraldi, M., 2012. A logistics provider evaluation and selection methodology based on AHP, DEA and linear programming integration. International Journal of
Production Research, 50 (17), pp. 4822–4829.
[9] McKibbin, B.N., 1981. Mothercare’s mail order warehouse picking system – Its systems design and performance. International Journal of Retail and
Distribution Management, 9 (1), 53–60.
[10] Rouwenkorst, B., Reuter, B., Stockrahm, V., Van Houtum, G., Mantel, R. and Zijm, W., 2000. Warehouse Design and Control: Framework and
literature review. European Journal of Operational
Research, 122 (3), 515–533.
[11] Strack, G., Pochet, Y., 2009. An integrated model for warehouse and inventory planning. European Journal
of Operation Research, 204, 35-50.
[12] Goetschalckx, G.J. and McGinnis, M., 2010. Research on warehouse design and performance evaluation: a comprehensive review. European Journal of Operational
Research, 203 (3), 539–549.
[13] Busato, D., Fera, M., Iannone, R., Mancini V. and Schiraldi M.M., 2013. Evaluating RFID opportunity through process analysis. International Journal of RF
Technologies: Research and Applications (in press).
[14] Mancini, V., Pasquali, M. and Schiraldi, M., 2012. Opportunities for using RFID in the aircraft production process. International Journal of RF Technologies: Research
and Applications, 3 (4), pp. 243–255.
[15] Scotti, P., Fera M., Iannone R., Mancini V. and Schiraldi M.M., 2013. Economical evaluation of RFID technology in production environment, International
Journal of Engineering Business Management
[16] Bowlby, S., Breheny, M., Foot, D., 1984. Store location – problems and methods. Is locating a viable store becoming more difficult? International Journal of Retail
and Distribution Management, 12 (5), 31–33.
[17] Gagliardi, J.P., Renaud, J., Ruiz, A., 2007. Proceedings of the 39th Conference on Winter Simulation, New York: IEEE Press Piscataway.
[18] Grant, D.B., Fernie, J., 2008. Research note: exploring out-of-stock and on-shelf availability in non-grocery, high street retailing. International Journal of Retail and
Distribution Management, 36 (8), 661–672.
[19] Cagliano, A.C., DeMarco, A., Rafele, C., Volpe, S., 2011. Using system dynamics in warehouse management: a fast-fashion case study. Journal of
Manufacturing Technology Management, 22 (2), 171-188.
[20] Bottani, E., Cecconi, M., Vignali, G., Montanari, R., 2012. Optimisation of storage allocation in order picking operations through a genetic algorithm.
International Journal of Logistics Research and Applications, 15 (2), 127-146.
[21] Battista, C., Fumi, A., Laura, L. and Schiraldi, M.M., 2013. Multiproduct slot allocation heuristic to minimize storage space. International Journal of Retail
and Distribution Management (in press).
[22] Fumi A., Scarabotti L. and Schiraldi M.M., 2013. Minimizing warehouse space with dedicated storage policy, International Journal of Engineering Business
Management
[23] Tompkins, J.A., White, J.A., Bozer, Y.A. and Tanchoco, J.M. 2002. Facilities Planning. USA: Wiley India Pvt.
[24] De Koster, R., Le-Duc, T. and Roodbergen, K J., 2007. Design and control of warehouse order picking: A literature review. European Journal of Operational
[25] Qichang, L., 2005. Logistics distribution center of picking system selection and design. Machinery Industry Press, Beijing.
[26] Christofides, N., 1975. Graph Theory: An Algorithmic Approach. London: Academic press.
[27] De Rezende, P., Lee, D. and Wu, Y., 1985. Rectilinear shortest paths with rectangular barriers. SCG '85
Proceedings of the first annual symposium on computational geometry, June 5-7, Baltimore,
Maryland, USA.ACM Edition, New York, 204-213. [28] Cecil-Wright, J., 1986. How the boardroom can
influence warehousing costs. International Journal of
Retail and Distribution Management, 14 (3), 67–69.
[29] Segerstedt, A., Pettersson, A.I., 2012. Measurements of excellence in a supply chain. International Journal of
Logistics Systems and Management, 13 (1), 65-80.
[30] Roodbergen, K.J. and De Koster, R., 2001 b. Routing order pickers in a warehouse with a middle aisle.
European Journal of Operational Research, 133, 32–43.
[31] Ratliff, H. and Rosenthal, A., 1983. Order picking in a rectangular warehouse: A solvable case of the traveling salesman problem. Operations Research, 31 (3), 507–521.
[32] Hou, J. L., Wu, Y. J. and Yang, Y. J., 2010. A model for storage arrangement and re-allocation for storage management operations. International Journal of
Computer Integrated Manufacturing, 23(4), pp. 369–390.
[33] Kutzelnigg, R., 2011. Optimal Allocation of Goods in a Warehouse: Minimizing the Order Picking Costs under Real-life Constraints. Vienna, Logistics and
Industrial Informatics (LINDI), 3rd IEEE
International Symposium, 65-70.
[34] Ceylan, A., Gunal, M. and Bruzzone, A. G., 2012. A new approach to simulation modeling of unit-load warehouses. San Diego (Chicago), EAIA ‘12 Symposium on Emerging Applications of M&S in Industry and Academia, Article n°2.
[35] Routroy, S., Prashanth, T. and Ippili, R. S., 2011. Study of one way product substitution on supply chain performance. International Journal of Services and
Operations Management, 8(4), pp. 405–417.
[36] Sangwan, K. and Kodali, R., 2009. FUGEN: A tool for the design of layouts for cellular manufacturing systems. International Journal of Services and Operations
Management, 5(5), pp. 595–616.
[37] Zhang, A., Guo, X. and Zhang, Z., 2009. Inventory decision models with competition existing between two parallel supply chains. International Journal of
Services and Operations Management, 5(5), pp. 717–736.
[38] Fumi, A., Scarabotti, L. and Schiraldi, M.M., 2013. The Effect of Slot-Code Optimization on Travel Times in Common Unit-Load Warehouses.
International Journal of Services and Operations Management, 15 (4), 507-527.
[39] Qiana, Q. and Jie, Z., 2011. Order Picking: A Literature Review. Singapore, Energy Procedia, pp. 6545–6550.
[40] Vaughan, T. and Petersen, C. 1999. The effect of warehouse cross aisles on order picking efficiency.
International Journal of Production Research, 37 (4), 881–
897.
[41] Roodbergen, K.J. and De Koster, R., 2001 a. Routing methods for warehouses. International Journal of
Production Research, 39 (9), 1865–1883.
[42] Hwang, H., Oh, Y. and Lee, Y., 2004. An evaluation of routing policies for order-picking operations in low-level picker-to-part system. International Journal of
Production Research, 42 (18), 3873–3889.
[43] Caron, F., Marchet, G. and Perego, A., 2000. Optimal layout in low-level picker-to-part systems.
International Journal of Production Research, 38 (1), 101–
117.
[44] Petersen, C., 1997. An evaluation of order picking routing policies. International Journal of Operations and
Production Management, 17 (11), 1098–1111.
[45] De Koster, R. and Van der Poort, E., 1998. Routing orderpickers in a warehouse: A comparison between optimal and heuristic solutions. IIE Transactions, 30, 469–480.
[46] Pan, J. C.-H., Shih, P.-H. and Wu, M.-H., 2012. Storage assignment problem with travel distance and blocking considerations for a picker-to-part order picking system. Computers and Industrial Engineering, 62(2), pp. 527–535.
[47] Gelders, L. and Heeremans, D., 1994. Het traveling salesman probleem toegepast op orderpicking.
Tijdschrift voor Economie en Management, 19, 381–388.
[48] Little, J., Murty, K., Sweeney, D. and Karel, C.,1963. An algorithm for the traveling salesman problem.
Operations Research, 11, 972–989.
[49] Hall, R.W.,1993. Distance approximations for routing manual pickers in a warehouse. IIE Transactions, 25 (4).
[50] Roodbergen, K.J. and De Koster, R.,2001. Routing methods for warehouses. International Journal of
Production Research, 39 (9), 1865–1883.
[51] Pohl, L.M., Meller, R.D. and Gue, K.R., 2009. An analysis of dual-command operations in common warehouse designs. Transportation Research, 45, 367– 379.
[52] Roodbergen, K.J. and Vis, I.F., 2006. A model for warehouse layout. IIE Transactions, 10 (38), 799–811. [53] Le-Duc, T. and De Koster, R.M., 2007. Travel time
estimation and order batching in a 2-block warehouse. European Journal of Operational Research, – 176, 374–388.
[54] Roodbergen, K.J., Sharp, G.P. and Vis, I.F., 2008. Designing the Layout Structure of Manual Order. IIE
Transactions, 40 (11), 1032–1045.
[55] Gibson, D. and Sharp, G., 1992. Order batching procedures. European Journal of Operational Research, 58 (1), 57–67.
[56] Petersen, C., 2000. An evaluation of order picking policies for mail order companies. Production and
[57] De Koster, R., Van der Poort, E. and Wolters, M., 1999. Efficient orderbatching methods in warehouses.
International Journal of Production Research, 37 (7),
1479–1504.
[58] Armstrong, R., Cook, W. and Saipe, A., 1979. Optimal batching in a semi-automated order picking system.
Journal of the Operational Research Society, 30, 711–720.
[59] Chih-Ming, H., Kai-Ying, C., Mu-Chen, C. , 2005. Batching orders in warehouses by minimizing travel distance with genetic algorithms. Computers in
Industry, 56, 169–178.
[60] Muppani, V. and Adil, G., 2008 a. Efficient Formation of Storage Classes for Warehouse Storage Location Assignment: A Simulated Annealing Approach.
International Journal of Management Science, 36(4), pp.
609–618.
[61] Muppani, V. and Adil, G., 2008 b. A Branch and Bound Algorithm for Class-Based Storage-Location Assignment. European Journal of Operations Research, 189(2), p. 492–507.
[62] Ho, Y., Su, T. and ZB, S., 2008. Order Batching Methods for an Order-Picking Warehouse with Two Cross Aisles. Computers and Industrial Engineering, 55(2), pp. 321–347.
[63] Burinskiene, A., 2010. Order picking process at warehouses. International Journal of Logistics Systems
and Management, 6(2), pp. 162–178.
[64] Ene, S. and O¨ztu¨rk, N., 2012. Storage location assignment and order picking optimization in the automotive industry. International journal of advanced
manufacturing technology, 60(5–8), pp. 787–797.
[65] Mayer, J.H., 1961. Storage and retrieval of material.
The Western Electric Engineer, 5 (1), 42–48.
[66] Francis, R., 1967. On Some Problems of Rectangular Warehouse Design and Layout. Journal Of Industrial
Engineering, 17 (10).
[67] Hausman, W., Schwarz, L. and Graves, S., 1976.
Optimal storage assignment in automatic
warehousing systems. Management Science, 22 (6), 629–638.
[68] Graves, S., Hausman, W. and Schwarz, L., 1977.
Storage-Retrieval Interleaving in Automatic
Warehousing Systems. Management Science, 23 (9), 935–945.
[69] Schwarz, L., Graves, S. and Hausman, W., 1978. Scheduling policies for automatic warehousing systems: Simulation results. AIIE Trans., 10 (3), pp. 260–270.
[70] Bassan, Y., Roll, Y. and Rosenblatt, M.J., 1980. Internal layout design of a warehouse. AIIE Transactions, 12 (4), 317–322.
[71] Bozer, Y.A. and White, J.A. (1984). Travel-Time Models for Automated Storage/Retrieval Systems. IIE
Transactions, 16 (4), 329–338.
[72] Malmborg, C. and Krishnakumar, B., 1987. On the optimality of the cube per order index for conventional warehouses with dual command cycles.
Material Flow, 4, 169–175.
[73] Malmborg, C.J., Krishnakumar, B. and Simons, G.R., 1988. A mathematical overview of warehousing systems with single/dual order-picking cycles. Appl.
Math. Modelling, 12, 2–8.
[74] Hwang, H. and Lee, M.-K., 1988. Order batching algorithms for a man on-board automated storage and retrieval system. Engineering Cost and Production
Economics, 13, 285–294.
[75] Pandit, R. and Palekar, U., 1993. Response time considerations for optimal warehouse layout design.
Transactions of the ASME, 115, 322–328.
[76] Koh, S., Kim, B. and Kim, B., 2002. Travel time model for the warehousing system with a tower crane S/R machine. Computers and Industrial Engineering, 43, 495–507.
[77] Chen, Z. and Li, X., 2011. A RFID-based dual-command method for unit-load warehouse systems. IEEE International Conference on Systems, Man and Cybernetics, Anchorage, AK.
[78] Salah, B., 2011. Design, optimization and analysis of Stewart-Gough platform based automated storage / retrieval system. , IEEE International Conference on Automation and Logistics (ICAL), Chongqing. [79] Pohl, L., Meller, R. and Gue, K., 2011. Turnover-based
storage in non-traditional unit-load warehouse designs. IIE Transactions, 43 (10), pp. 703–720.
[80] Azzi, A., Battini, D., Faccio, M., Persona, A., Sgarbossa, F., 2011. Innovative travel time model for dual-shuttle automated storage/retrieval systems.
Computers and Industrial Engineering, 61 (3), pp. 600–
607.
[81] Petersen, C. and Schmenner, R., 1999. An evaluation of routing and volume-based storage policies in an order picking operation. Decision Sciences, 30 (2), 481– 501.
[82] Baciarello, L., D’Avino, M., Onori, R. and Schiraldi, M., 2013. Lot Sizing Heuristics Performance.
International Journal of Engineering Business Management, 5 (6), 1-10.
[83] Gu, J., Goetschalckx, M. and McGinnis, L.F., 2010. Research on warehouse design and performance evaluation: A comprehensive review. European Journal
of Operational Research, 203, 539–549.
[84] Meller, R. and Gue, K., 2009. The Application of New Aisle Designs for Unit-Load Warehouses. NSF
Engineering Research and Innovation Conference.
Honolulu, Hawaii.
[85] Berry, J., 1968. Elements of Warehouse Layout. The
International Journal of Productions Research, 7 (2), 105–