R E V I E W
Open Access
Biomarkers of food intake for nuts and
vegetable oils: an extensive literature
search
Mar Garcia-Aloy
1,2, Paul J. M. Hulshof
3, Sheila Estruel-Amades
1, Maryse C. J. Osté
4, Maria Lankinen
5,
Johanna M. Geleijnse
3, Janette de Goede
3, Marynka Ulaszewska
6, Fulvio Mattivi
6,7, Stephan J. L. Bakker
4,
Ursula Schwab
5,8and Cristina Andres-Lacueva
1,2*Abstract
Nuts and vegetable oils are important sources of fat and of a wide variety of micronutrients and phytochemicals.
Following their intake, several of their constituents, as well as their derived metabolites, are found in blood
circulation and in urine. As a consequence, these could be used to assess the compliance to a dietary intervention
or to determine habitual intake of nuts and vegetable oils. However, before these metabolites can be widely used
as biomarkers of food intake (BFIs), several characteristics have to be considered, including specificity, dose
response, time response, stability, and analytical performance. We have, therefore, conducted an extensive literature
search to evaluate current knowledge about potential BFIs of nuts and vegetable oils. Once identified, the strengths
and weaknesses of the most promising candidate BFIs have been summarized. Results from selected studies have
provided a variety of compounds mainly derived from the fatty fraction of these foods, but also other components
and derived metabolites related to their nutritional composition. In particular,
α-linolenic acid, urolithins, and
5-hydroxyindole-3-acetic acid seem to be the most plausible candidate BFIs for walnuts, whereas for almonds they
could be
α-tocopherol and some catechin-derived metabolites. Similarly, several studies have reported a strong
association between selenium levels and consumption of Brazil nuts. Intake of vegetable oils has been mainly
assessed through the measurement of specific fatty acids in different blood fractions, such as oleic acid for olive oil,
α-linolenic acid for flaxseed (linseed) and rapeseed (canola) oils, and linoleic acid for sunflower oil. Additionally,
hydroxytyrosol and its metabolites were the most promising distinctive BFIs for (extra) virgin olive oil. However,
most of these components lack sufficient specificity to serve as BFIs. Therefore, additional studies are necessary to
discover new candidate BFIs, as well as to further evaluate the specificity, sensitivity, dose-response relationships,
and reproducibility of these candidate biomarkers and to eventually validate them in other populations. For the
discovery of new candidate BFIs, an untargeted metabolomics approach may be the most effective strategy,
whereas for increasing the specificity of the evaluation of food consumption, this could be a combination of
different metabolites.
Keywords: Nuts, Oils, Biomarker, Intake, Metabolomics
* Correspondence:[email protected]
1Biomarkers and Nutrimetabolomics Laboratory, Department of Nutrition, Food Sciences and Gastronomy, XaRTA, INSA, Faculty of Pharmacy and Food Sciences, Campus Torribera, University of Barcelona, Barcelona, Spain 2CIBER de Fragilidad y Envejecimiento Saludable (CIBERFES), Instituto de Salud Carlos III, Barcelona, Spain
Full list of author information is available at the end of the article
© The Author(s). 2019 Open Access This article is distributed under the terms of the Creative Commons Attribution 4.0 International License (http://creativecommons.org/licenses/by/4.0/), which permits unrestricted use, distribution, and reproduction in any medium, provided you give appropriate credit to the original author(s) and the source, provide a link to the Creative Commons license, and indicate if changes were made. The Creative Commons Public Domain Dedication waiver (http://creativecommons.org/publicdomain/zero/1.0/) applies to the data made available in this article, unless otherwise stated.
Background
Western diets contain significant but varying amounts of
nuts and vegetable oils. Both are natural plant foods rich
in fat. Nuts have been a component of the human diet
since pre-agricultural times [
1
]. In Western countries,
nuts are consumed either raw or roasted as part of
meals, as snacks, or as desserts. They are eaten whole
(fresh or roasted), in salads, spreads (in both sweet and
salty spreads), as oils or hidden in products, such as
sauces, dairies, pastries, and baked goods [
2
]. Vegetable
oils, which can be defined as
“oils composed primarily of
glycerides of fatty acids being obtained only from plant
sources,” have been introduced more recently in Europe.
Until the late nineteenth century, the olive was the only
edible oil-bearing crop and its use was virtually
re-stricted to the Mediterranean area, while the rest of the
continent used animal fats as the principal source of
cooking oil [
3
]. Due to technological developments,
large-scale food production, and easier and cheaper
transport, the consumption of olive oil and other
vege-table oils increased [
4
].
Nuts are nutrient-dense foods and are rich sources of
dietary fatty acids with a high ratio of unsaturated to
sat-urated fatty acids [
2
]. Moreover, they contain many
other nutrients and bioactive compounds, including
high-quality proteins, fibers, minerals, tocopherols,
phy-tosterols, and phenolic compounds [
2
]. The main fatty
acids in nuts are oleic acid (C18:1), linoleic acid (C18:2),
and
α-linoleic acid (C18:3) [
5
,
6
]. Vegetable oils are
an-other important source of dietary fatty acid intake.
Glo-bally, the main oils in the human diet are derived from
soya, palm, sunflower, and rape [
7
], although there is
high variability depending on the local tradition of each
region. These oils are mostly used for baking, frying, or
as salad dressing [
8
]. Vegetable oils are rich sources of
(n-9) monounsaturated fatty acids (MUFAs) and (n-6
and n-3) polyunsaturated fatty acids (PUFAs).
Hydroxy-tyrosol [
9
] is a specific compound associated with olive
oil consumption, which is believed to contribute to
sev-eral of its beneficial health effects [
10
].
Many studies have investigated the potential health
ef-fects of nuts and vegetable oils. Previous epidemiologic
studies on the health effects of nuts have shown that nut
consumption is associated with a lower incidence of
coronary heart disease in both men and women [
11
].
Additionally,
intervention
studies
have
shown
an
LDL-cholesterol-lowering effect of nut consumption,
usually without any effect on HDL-cholesterol and
tri-glycerides [
12
–
14
]. Likewise, it is known that isocaloric
replacement of saturated fatty acids (SFAs) by MUFAs
and PUFAs, which are most common in vegetable oils,
is associated with a lower risk of developing
cardiovascu-lar diseases, which is partly mediated by lowering
LDL-cholesterol [
15
].
Given the potential health benefits of both nuts and
vegetable oils, it is important to find specific biomarkers
of their intake. Currently, food frequency questionnaires
(FFQs), food diaries, and 24-h dietary recalls are used as
dietary assessment tools in studies on nutrition.
How-ever, these assessment tools are based on self-reporting
by subjects and some of the drawbacks associated with
self-reporting food consumption are, among others, that
they rely on a correct estimation of portion size.
Add-itionally, surveys based on retrospective methods (such
as 24-h dietary recalls or FFQ) depend on the memory
of the subject, which could lead to food omissions, while
the prospective surveys (such as food diaries) could
cause changes in eating behavior. They often focus on
type, frequency, and serving size, but do not take into
account information on food sources, food processing,
or storage conditions. To illustrate, usually the presence
of oil in processed foods or receipts is disregarded by
consumers, whereas nuts are often hidden in processed
foods (for example, in sauces, spreads, dairy products,
etc.) and as such these products are easily missed with
self-reported dietary assessment methods. Therefore,
there is a growing interest in biomarkers of food intake
(BFIs), which are a more objective reflection of dietary
intake [
16
]. These biomarker-based measurements of
dietary intake are independent of subjects’ memory,
mis-reporting, or limitations of food composition databases
and can improve intake measurements, contributing to
better estimates of associations between diet and health
outcomes. Therefore, the use of BFI as a complementary
or alternative tool of the traditional instruments is one
of the focus of current and future research topics in
nu-tritional sciences.
This review has been developed as part of the Food
Biomarkers Alliance (FoodBAll) consortium, supported
by the Joint Programming Initiative
“A Healthy Diet for
a Healthy Life” [
17
]. The objective of this paper was to
perform an extensive literature search of both
observa-tional and human intervention studies in order to
de-scribe which BFIs of both nuts and vegetable oils have
been described until now.
Methodology
This review is focused on the most widely consumed
types of nuts and vegetable oils. For nuts, walnuts,
hazel-nuts, pistachios, pecan hazel-nuts, macadamia hazel-nuts, cashews,
and Brazil nuts were selected. Additionally, almonds and
peanuts, although they are botanically classified as
drupes and legumes, respectively, have also been
in-cluded because of their nutritional profile. Among
vege-table oils, olive, sunflower, flaxseed, and rapeseed oils
were covered.
The review was conducted following the methodology
harmonized within the FoodBAll consortium (
http://
foodmetabolome.org/
) and recently described [
18
]. The
search was conducted in three databases (PubMed,
Sco-pus, and Web of Science) using the following
combina-tions of grouped search terms: (biomarker* OR marker*
OR metabolite* OR biokinetics OR biotransformation)
AND (trial OR experiment OR study OR intervention)
AND (human* OR men OR women OR patient* OR
vol-unteer* OR participant*) AND (urine OR plasma OR
serum OR blood OR excretion OR
“adipose tissue” OR
“fat tissue” OR “erythrocyte membrane*” OR
phospho-lipid* OR
“cholesterol ester*” OR “cholesteryl ester*” OR
triglyceride* OR triacylglycerol*) AND (intake OR meal
OR diet OR ingestion OR consumption OR eating OR
drink* OR administration), together with specific
key-words related to each food group, since searches were
carried out separately for each food group. For nuts
these were (nut OR nuts OR walnut* OR hazelnut* OR
almond* OR pecan* OR macadamia* OR peanut* OR
pistachio* OR cashew* OR
“brazil nut”), whereas for
vegetable oils they were (oil*) AND (olive* OR coconut*
OR rapeseed* OR canola* OR sunflower* OR palm* OR
flaxseed* OR linseed* OR sesame* OR corn* OR
soy-bean* OR safflower* OR seed*). The mentioned
key-words were used in the default fields of each database.
They were [All fields], [Article Title/Abstract/Keywords],
and [Topic] for PubMed, Scopus, and Web of Science,
respectively.
Firstly, titles and abstracts were screened to determine
whether they met the selection criteria. In case of doubt,
the papers were also kept in the list of selected
refer-ences, which were further evaluated using information
included in the full text. Additional papers were
identi-fied from reference lists of selected papers and relevant
reviews. Only papers in the English language were
con-sidered eligible, while no restriction was applied for
pub-lication dates (the last search was done in December
2017). Those papers identifying or using potential BFIs
of nuts or vegetable oils measured in human biological
samples were selected (i.e., animal studies were
ex-cluded). Those papers reporting duplicated data from
the same study were excluded, with only one paper
be-ing retained for each study. The research papers
identi-fying or using potential BFIs were selected by one or
more skilled researchers. All candidate BFIs were
merged in a unique list, which was further split
accord-ing to their potentiality as promisaccord-ing candidate BFIs,
ei-ther used alone (as a single BFI) or within a combination
in a multi-metabolite biomarker panel. Those potentially
good candidate BFIs were included in a first table
to-gether with the description of the corresponding studies
where they were measured, while the others were
grouped in a second table along with their associated
references where the association with the food intake
was described, as well as the main reason for exclusion.
Finally, a score system also developed within the
Food-BAll consortium [
19
] was applied for those BFIs retained
as potentially good candidates in order to systematically
assess their current validity, as well as to pinpoint
whether additional studies were still needed. It included
eight items related to both analytical and biological
aspects.
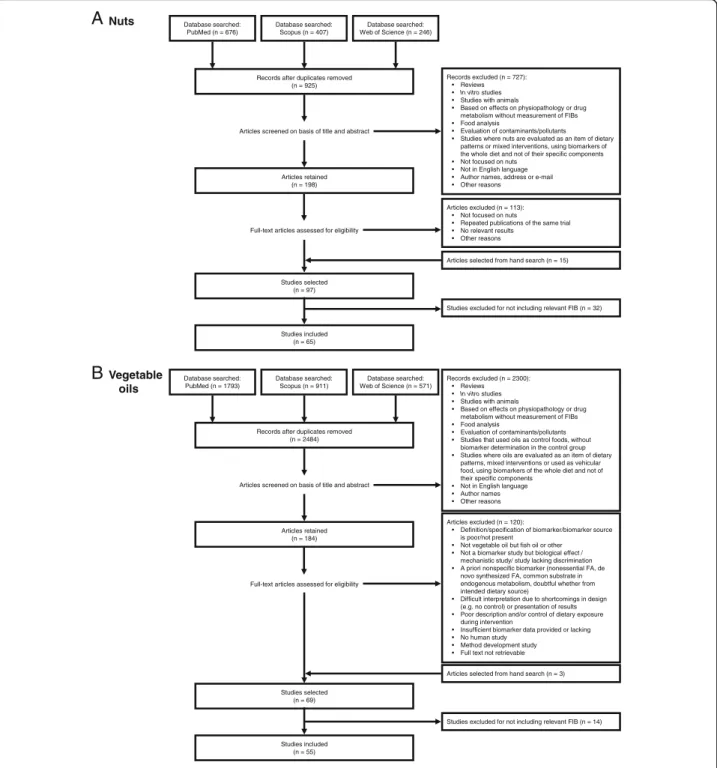
Results and discussion
The literature has been extensively reviewed
independ-ently for nuts and vegetable oils intake biomarkers.
Fig-ure
1
presents an overview of the review and study
selection process. Firstly, electronic searches were
con-ducted using the Web of Science, PubMed, and Scopus
databases. After excluding duplicated references, a
total of 925 and 2484 articles were screened for nuts
and vegetable oils, respectively. After title and
ab-stract screening, a total of 97 and 69 articles were
selected for providing information on potential
candi-date BFIs of consumption of nuts and vegetable oils,
respectively. Further evaluation of the full-text papers
reduced the results to 65 and 55 eligible papers to be
included in the sections of nuts and vegetable oils,
respectively. The results are successively presented
below.
Biomarkers of nut consumption
A description of selected studies reporting
associa-tions between nut intake and potentially relevant BFIs
is given in Table
1
. They are organized according to
the types of nuts (walnuts, almonds, hazelnuts,
pista-chios, Brazil nuts, and mixed nuts), the study design
[acute study (i.e., single-dose study), chronic
interven-tion (i.e., follow-up after a continued supplementainterven-tion
for a specific frame of time) or observational study],
the types of discriminating metabolites (fatty acids,
polyphenol-derived metabolites, etc.) and the
publica-tion date. Most of the selected studies were focused
on walnuts [
12
,
20
–
51
], followed by Brazil nuts [
52
–
64
],
while a lower number of studies were found for almonds
[
65
–
72
], hazelnuts [
73
–
75
], pistachios [
76
–
78
], and
mixed nuts [
79
–
83
]. The initial search also retrieved
studies on pecan nuts [
84
,
85
], macadamia nuts [
86
–
88
],
cashews [
89
,
90
], and peanuts [
91
–
94
], but none of them
included any potentially relevant BFIs (see Additional file
1
:
Table S1 for the corresponding reasons). Therefore,
they were not included in Table
1
. Selected papers
presented data from studies with different designs:
most of them reported data from nutritional
interven-tion studies, with acute [
20
–
26
,
52
,
53
] or chronic
[
12
,
27
–
49
,
54
–
62
,
65
–
76
,
79
–
83
] intake of nuts,
while four of them reported data from observational
cohorts [
50
,
51
,
63
,
64
]. The current available knowledge
about different biological and analytical parameters that
summarize the potential usefulness of each metabolite
as a potential BFI is presented in Table
2
, while the
information on the food intake biomarkers of nuts
considered nonrelevant is presented in Additional
file
1
: Table S1.
Although most of the studies applied targeted
ap-proaches, the search strategy also retrieved some
untar-geted studies. Their inclusion or not in the present
review was done based on the potentiality of the
reported BFI, regardless of the analytical approach used.
Therefore, some of the selected papers that used an
untargeted strategy were retained as being particularly
interesting because they discovered potentially relevant
BFIs of nuts, whereas others were not further considered
because they did not report any specific BFI. They were
focused on walnuts [
50
,
51
], almonds [
95
], pistachios
[
96
], peanuts [
97
], and mixed nuts [
81
,
83
,
98
,
99
]. Some
of these studies reported results similar to the targeted
Records excluded (n = 727): • Reviews • In vitro studies
• Studies with animals
• Based on effects on physiopathology or drug metabolism without measurement of FIBs • Food analysis
• Evaluation of contaminants/pollutants • Studies where nuts are evaluated as an item of dietary
patterns or mixed interventions, using biomarkers of the whole diet and not of their specific components • Not focused on nuts
• Not in English language • Author names, address or e-mail • Other reasons
Articles excluded (n = 113): • Not focused on nuts
• Repeated publications of the same trial • No relevant results • Other reasons Database searched: PubMed (n = 676) Database searched: Scopus (n = 407) Database searched: Web of Science (n = 246)
Articles selected from hand search (n = 15) Records after duplicates removed
(n = 925)
Studies selected (n = 97)
Articles screened on basis of title and abstract
Full-text articles assessed for eligibility Articles retained (n = 198) Nuts
A
B
Studies included (n = 65)Studies excluded for not including relevant FIB (n = 32)
Records excluded (n = 2300): • Reviews • In vitro studies
• Studies with animals
• Based on effects on physiopathology or drug metabolism without measurement of FIBs • Food analysis
• Evaluation of contaminants/pollutants • Studies that used oils as control foods, without
biomarker determination in the control group • Studies where oils are evaluated as an item of dietary
patterns, mixed interventions or used as vehicular food, using biomarkers of the whole diet and not of their specific components
• Not in English language • Author names • Other reasons Database searched: PubMed (n = 1793) Database searched: Scopus (n = 911) Database searched: Web of Science (n = 571)
Articles selected from hand search (n = 3) Records after duplicates removed
(n = 2484)
Studies selected (n = 69)
Articles screened on basis of title and abstract
Full-text articles assessed for eligibility Articles retained (n = 184) Vegetable oils Studies included (n = 55)
Studies excluded for not including relevant FIB (n = 14) Articles excluded (n = 120):
• Definition/specification of biomarker/biomarker source is poor/not present
• Not vegetable oil but fish oil or other • Not a biomarker study but biological effect /
mechanistic study/ study lacking discrimination • A priori nonspecific biomarker (nonessential FA, de
novo synthesized FA, common substrate in endogenous metabolism, doubtful whether from intended dietary source)
• Difficult interpretation due to shortcomings in design (e.g. no control) or presentation of results • Poor description and/or control of dietary exposure
during intervention
• Insufficient biomarker data provided or lacking • No human study
• Method development study • Full text not retrievable
Table 1 Studies reporting associations between consumption and potential candidate food intake biomarkers for nuts
Dietary factor [reference]
Study design Number of subjects
Analytical method
Sample type Discriminating metabolites/candidate biomarkers
Walnutsa[20] Acute study 8 GC Large TAG-rich
lipoproteins α-Linolenic acid Walnutsa[21] Acute study 20 GC LDL cholesteryl
esters
α-Linolenic acid
Walnuts [22] Acute study 40 LC-MS Urine Urolithin B glucuronide Walnutsa[23] Acute study 16 HPLC Urine Urolithin A
Walnuts [24] Acute study 8 Spectro-photometry
Urine 5-Hydroxyindoleacetic acid
Walnuts [25] Acute study 3 HPLC Urine 5-Hydroxyindoleacetic acid Walnuts [26] Acute study 31 LC-MS Serum 5-Hydroxyindoleacetic acid Walnutsa[12] Sustained intervention 18 GC Serum cholesteryl esters α-Linolenic acid Walnutsa[27] Sustained intervention
16 GC Plasma α-Linolenic acid
Walnutsa[28] Sustained intervention
21 GC Plasma TAG α-Linolenic acid
Walnutsa[29] Sustained intervention
55 GC LDL cholesteryl
esters α-Linolenic acid Walnutsa[30] Sustained
intervention
18 GC Plasma α-Linolenic acid
Walnuts [31] Sustained intervention
10 TLC LDL proteins α-Linolenic acid
Walnutsa[32] Sustained intervention 40 GC Serum cholesteryl esters α-Linolenic acid Walnuts [33] Sustained intervention
90 NR Erythrocytes α-Linolenic acid
Walnutsa[34] Sustained intervention
10 GC Blood drops α-Linolenic acid
Walnuts [35] Sustained intervention
39 NR Erythrocytes α-Linolenic acid
Walnutsa[36] Sustained intervention
25 GC Erythrocytes Linolenic acid
Walnuts [37] Sustained intervention
50 GC Erythrocytes α-Linolenic acid
Walnuts [38] Sustained intervention 25 NR Plasma phospholipids α-Linolenic acid Walnutsa[39] Sustained intervention
21 GC Erythrocytes Linolenic acid
Walnuts [40] Sustained intervention
283 GC Erythrocytes α-Linolenic acid
Walnutsa[41] Sustained intervention
18 GC Plasma α-Linolenic acid
Walnuts [42] Sustained intervention 25 GC-FID Plasma phospholipids α-Linolenic acid Walnuts [43] Sustained intervention
109 GC-FID Serum α-Linolenic acid
Walnutsa[44] Sustained intervention
45 GC-FID Erythrocytes α-Linolenic acid
Walnutsa[45] Sustained intervention
Table 1 Studies reporting associations between consumption and potential candidate food intake biomarkers for nuts (Continued)
Dietary factor [reference]
Study design Number of subjects
Analytical method
Sample type Discriminating metabolites/candidate biomarkers
Walnutsa[46] Sustained intervention
40 GC Plasma α-Linolenic acid
Walnutsa[47] Sustained intervention
63 LC-MS Plasma / Urine / Prostate gland
Urolithin A glucuronide, urolithin B glucuronide (only in prostate gland)
Walnuts [48] Sustained intervention
10 LC-MS Urine / Feces Urolithin A, urolithin A 3-glucuronide (only urine), isourolithin A, isourolithin A 3-glucuronide (only urine), urolithin B, urolithin B glurcuronide (only urine), urolithin C (only feces)
Walnutsa[49] Sustained intervention
20 LC-MS Urine / Feces Urolithin A, urolithin A glucuronide (only urine), isourolithin A, isourolithin A glucuronide (only urine), urolithin B, urolithin B glucuronide (only urine), urolithin C (only feces)
Walnuts [50] Observational study
107 LC-MS Urine 5-Hydroxyindole-3-acetic acid
Walnutsa[51] Observational study
381 LC-MS Urine Urolithin A glucuronide / sulfate / sulfoglucuronide, urolithin B glucuronide, urolithin C sulfate, urolithin C glucuronide, hydroxyindoleacetic acid sulfate
Brazil nuts [52] Acute study 3 LC-MS Urine Selenium Brazil nuts [53] Acute study 2 LC-ICP-MS Urine Selenium Brazil nuts [54] Sustained
intervention
15 AAS Plasma Selenium
Brazil nuts [55] Sustained intervention
59 AAS Plasma Selenium
Brazil nuts [56] Sustained intervention
81 AAS Plasma /
Erythrocytes
Selenium
Brazil nuts [57] Sustained intervention
37 AAS Plasma /
Erythrocytes
Selenium
Brazil nuts [58] Sustained intervention
91 AAS Plasma Selenium
Brazil nuts [59] Sustained intervention
91 ICP-MS Plasma Selenium
Brazil nuts [60] Sustained intervention
82 AAS Plasma /
Erythrocytes / Urine (24 h) / Hair / Nails
Selenium
Brazil nuts [61] Sustained intervention
31 AAS Plasma Selenium
Brazil nuts [62] Sustained intervention
32 NS Plasma Selenium
Brazil nuts [63] Observational study
155 ICP-MS Blood Selenium
Brazil nuts [64] Observational study
219 ICP-MS Whole-blood Selenium
Almonds [65] Sustained intervention 16 HPLC Plasma / Erythrocytes α-Tocopherol Almonds [66] Sustained intervention 20 HPLC Plasma α-Tocopherol Almonds [67] Sustained intervention 60 HPLC Serum α-Tocopherol Almonds [68] Sustained intervention 24 NR Plasma α-Tocopherol Almonds [69] Sustained intervention 65 HPLC-FLD Plasma α-Tocopherol Almonds [70] Sustained intervention 22 HPLC Plasma α-Tocopherol
approaches, confirming the relationships between walnut
intake and urolithins, fatty acids and serotonin-derived
metabolites [
50
,
51
,
81
,
83
], and almond intake and
catechin-derived metabolites [
95
] (see the corresponding
subsections for more detailed information). Neither the
latter study on catechin-derived metabolites nor
tar-geted studies reporting results in the same direction
[
100
–
102
] were retained among the studies reporting
relevant
candidate
BFIs.
This
was
because
catechin-derived metabolites have broadly been
re-ported
to
increase
after
the
intake
of
other
flavan-3-ol-rich food sources, including tea, cocoa, and
red wine [
103
]. Guertin et al. (2014) [
97
] analyzed the
correlations between serum metabolic profiles and
pea-nut consumption according to data from FFQs in
par-ticipants from the Prostate, Lung, Colorectal, and
Ovarian Cancer Screening Trial (PLCO). With this
ap-proach, tryptophan betaine and 4-vinylphenol sulfate
were proposed as candidate biomarkers of peanut
take. Both metabolites were also associated with nut
in-take in a case-control study [
99
]. Tryptophan betaine is
an indole alkaloid previously also associated with
pea-nut consumption after being detected in the breast milk
of breastfeeding mothers [
92
]. However, it is also
de-tected in legumes [
104
–
106
]. 4-vinylphenol is a
catabol-ite
generated
by
the
direct
decarboxylation
of
p-coumaric acid [
107
]. It would be interesting to go
into greater depth with these metabolites in order to
work out whether they could be considered as potential
BFIs of peanuts. However, with the current knowledge,
they could not be included in the list of the most
prom-ising candidate BFIs due to potential low specificity.
Walnuts
Nuts in general are a rich source of dietary fatty acids
with a high unsaturated-to-saturated ratio. The main
Table 1 Studies reporting associations between consumption and potential candidate food intake biomarkers for nuts (Continued)
Dietary factor [reference]
Study design Number of subjects
Analytical method
Sample type Discriminating metabolites/candidate biomarkers
Almonds [71] Sustained intervention 60 HPLC Plasma α-Tocopherol Almonds [72] Sustained intervention 45 HPLC Plasma α-Tocopherol Hazelnuts [73] Sustained intervention 48 HPLC Plasma α-Tocopherol Hazelnutsa[74] Sustained intervention 21 HPLC Serum / Isolated LDL α-Tocopherol Hazelnuts [75] Sustained intervention 72 HPLC Plasma α-Tocopherol Pistachios [77] Sustained intervention 28 GC Serum β-Sitosterol Pistachiosa[78] Sustained intervention 28 HPLC Serum Lutein Pistachiosa[76] Sustained intervention 54 LC-MS Plasma Lutein-zeaxanthin
Mixed nuts (walnuts, almonds and hazelnuts) [79]
Sustained intervention
27 GC Plasma α-Linolenic acid
Mixed nuts (walnuts, almonds and hazelnuts) [80]
Sustained intervention
375 GC Plasma α-Linolenic acid
Mixed nuts (walnuts, almonds and hazelnuts) [81]
Sustained intervention
42 LC-MS Urine Urolithin A glucuronide / sulfate / sulfoglucuronide, hydroxyindoleacetic acid
Mixed nuts (walnuts, almonds and hazelnuts) [82]
Sustained intervention
41 LC-MS Urine Urolithin A, urolithin B
Mixed nuts (walnuts, almonds and hazelnuts)a[83]
Sustained intervention
47 LC-MS Plasma Urolithin A glucuronide
AAS atomic absorption spectrometry, FID flame ionization detector, FLD fluorometric detection, GC gas chromatography, HPLC high-performance liquid chromatography, ICP inductively coupled plasma, MS mass spectrometry, NR not reported, TAG triacylglycerides, TLC thin-layer chromatography
a
fatty acids in nuts are oleic acid (C18:1), linoleic acid
(C18:2), and
α-linolenic acid (C18:3, ALA). Walnuts are
characterized by considerably higher amounts of ALA
than other types of nuts (11.6% of total fatty acid
com-position for walnuts compared to < 0.7% for the others)
[
5
,
6
]. Such a composition explains the fact that among
the different types of nuts, only walnut intake has been
associated with ALA in blood both in studies only
fo-cused on consumption of walnuts [
12
,
20
,
21
,
27
–
46
],
and in studies with mixed nut intake that included
wal-nuts [
79
,
80
]. Linoleic acid (C18:2, LA) is the major
PUFA present in most types of nuts (40–60% of total
fatty acid composition for walnuts, pecans, peanuts, and
Brazil nuts) [
5
,
6
]. Therefore, it was consistently found
in blood after walnut intake [
12
,
27
–
30
,
32
,
36
,
39
,
41
,
45
,
46
,
108
], and in studies with mixed nuts that
in-cluded walnuts in their composition [
109
,
110
].
Add-itionally, its presence in biological fluids was also
associated with consumption of cashews [
89
], for which
it is the second most abundant type of fatty acid (20.8%)
[
6
]. Looking at the above-mentioned studies, ALA seems
a better candidate biomarker of walnut intake than LA.
Nevertheless, there are other food sources of ALA and
LA, such as vegetable oils (flaxseed, linseed and rapeseed
oils for ALA, and safflower, sunflower, soybean, and corn
oil for LA), seeds, and animal products (see the section
below dedicated to vegetable oils). This clearly means
that the presence of neither ALA nor LA in biological
fluids can solely indicate intake of nuts or walnuts.
Add-itionally, both ALA and LA undergo biotransformations
in the human body to longer-chain fatty acids [
111
],
giv-ing rise to eicosapentaenoic acid (C20:5, EPA) and
doco-sahexaenoic acid (C22:6, DHA), respectively. Indeed,
both of them have been reported after the intake of
wal-nuts [
27
,
34
,
109
]. Also, in this case, a confounding
fac-tor may occur, as EPA and DHA are also related to fish
consumption [
112
].
Oleic acid (C18:1) is the major MUFA present in most
types of nuts (walnuts, almonds, peanuts, hazelnuts,
macadamia nuts, and pecan nuts [
5
,
6
]). As a
conse-quence, higher amounts of this fatty acid have been
ob-served in blood and urine after the intake of walnuts
[
28
], almonds [
113
], hazelnuts [
74
,
114
], pecan nuts [
85
],
macadamia nuts [
88
], cashews [
89
,
90
], and mixed nuts
[
98
,
115
]. This common presence in many types of nuts
excludes oleic acid as a direct link to specific nut intake.
Moreover, oleic acid has also been associated with olive
oil intake (see the corresponding section below). In some
targeted investigations, myristic acid (14:0) [
12
] and
ste-aric acid (18:0) [
44
,
46
], which are the major saturated
fatty acids (SFAs) in walnuts, were reported in biological
fluids after walnut intake [
5
]. However, myristic acid is
also abundant in dairy products and has been proposed
as a potential biomarker of dairy fat intake [
116
]. In
Table 2 Validation scheme of potential food intake biomarkers for nuts
Dietary factor [references] Compound/metabolite HMDB ID Sample type
Criteria
1 2 3a 3b 4 5 6 7 8 Walnuts [12,20,21,28–45,
27,46,79,80]
α-Linolenic acid HMDB0001388 Plasma /
serum / erythrocytes N U U U U U U Y U Walnuts [22,23,48,47,49, 51,82,81,83] Urolithins: urolithin A (and phase II metabolites), isourolithin A
(and phase II metabolites),
urolithin B (and phase II metabolites), urolithin C (and phase II metabolites)
HMDB0013695 / HMDB0029222 / HMDB0060022 / HMDB0013696 / HMDB0041787 / HMDB0029218 Urine / plasma N U Y U Y U U Y U
Walnuts [24,50,51,81] 5-Hydroxyindole-3-acetic acid HMDB0000763 Urine / serum
N Y Y U Y U U Y U
Almonds/hazelnuts [66–72] α-Tocopherol HMDB0001893 Plasma / serum / erythrocytes
N U U U U U U Y U
Pistachios [77] β-Sitosterol HMDB0000852 Serum N U U U U U U Y U
Pistachios [76,78] Lutein-zeaxanthin HMDB0003233/HMDB0002789 Plasma / serum
N U U U U U U Y U
Brazil nuts [53–61] Selenium HMDB0001349 Urine /
plasma
N Y Y Y Y U U Y U
HMDB human metabolome database, N no, U unknown, Y yes. Criteria: C1—Plausibility, Is the marker compound plausible as a specific BFI for the food or food group?; C2—Dose response, Is there a dose-response relationship at relevant intake levels of the targeted food?; C3—Time response, Is the biomarker kinetics described adequately to make a wise choice of sample type, frequency and time window?; C3a, single dose; C3b, multiple doses; C4, Robustness, Has the marker been shown to be robust after intake of complex meals reflecting dietary habits of the targeted population?; C5, Reliability, Has the marker been shown to compare well with other markers or questionnaire data for the same food/food group?; C6, Stability, Is the marker chemically and biologically stable during biospecimen collection and storage, making measurements reliable and feasible?; C7, Analytical performance, Are analytical variability (CV%), accuracy, sensitivity and specificity known as adequate for at least one reported analytical method?; C8, Reproducibility, Has the analysis been successfully reproduced in
summary, among the different types of fatty acids in
nuts, ALA is the most suitable candidate BFI for
wal-nuts, although it is not specific for this food. For this
reason, it seems necessary to perform a complementary
search for other potential BFIs of walnuts that are not
detected after the consumption of the other ALA food
sources [
117
]. Importantly, McKay et al. [
39
] analyzed
the percentage change in ALA levels compared to
base-line levels following an ingestion of 21 g/day or 42 g/day
of walnuts for 6 weeks. Although the magnitude of
changes in ALA levels after 6 weeks seemed to be higher
with the 42 g/day dose (which was the only dose that
reached statistical significance compared to baseline),
the authors did not make any reference to the potential
differences (or not) between the two doses. Therefore,
the dose-response association between walnut
consump-tion and ALA levels needs to be further explored. Also,
the time-response relationship needs to be further
inves-tigated, since neither of the available acute studies
reporting levels of ALA after walnut consumption
pro-vided a kinetics description [
20
,
21
], but rather they only
provided data on one specific time point after
consump-tion. Although the results of the present review did not
find any observational study reporting positive
associa-tions between levels of ALA and walnut intake, the
par-ticipants in the study of McKay et al. [
39
] were not
instructed to limit the consumption of other n-3
fatty-rich foods (including fatty fish), thereby reflecting
the robustness of this potential BFI in the general
popu-lation, regardless of the background diet. As regards the
analytical performance, various quantification methods
using gas chromatography platforms have been
devel-oped [
118
,
119
]. However, we could not find any report
regarding the reliability (comparison with other BFIs or
reference methods), stability during sample collection,
storage and processing, or interlaboratory variation.
The appearance in biofluids of urolithins has been the
subject of investigations by several authors. In terms of
nuts, they have only been reported after intake of
wal-nuts [
22
,
23
,
47
–
49
,
51
] or mixed nuts including walnuts
[
81
–
83
]. In most of these studies, the aglycone or phase
II metabolites of urolithin A and B were the most
fre-quently reported metabolites. Urolithins are the product
of polymeric ellagitannins (ETs) metabolized by gut
microbiota. Among different types of nuts, they are
spe-cific for walnuts, but they have also been reported after
the intake of pomegranate, strawberries, raspberries, and
blackberries. However, these additional foods do not
provide important amounts of fatty acids. Therefore,
through the employment of a multi-metabolite model,
the presence of urolithins and fatty acids at the same
time could reveal walnut intake with higher specificity
[
117
]. With regard to the dose-response associations,
al-though there are no studies with different doses of
walnuts, one of the selected studies provided
partici-pants with different doses of ETs [
22
]. In that
investiga-tion, the subjects consumed different ET amounts
through the intake of raspberries (422 mg of ellagic acid,
EA), walnuts (191 mg of EA), strawberries (190 mg of
EA), or red wine (5.4 mg of EA). The mean highest
ex-cretion of urolithins was observed in the walnut group
and the lowest in the red wine group. Therefore, the
ex-cretion was not directly proportional to the amount of
ETs consumed. Instead, it seems that the food matrix
has an impact on the bioavailability and metabolism of
ETs, which is expected since they exhibit a considerable
structural diversity according to food source (i.e.,
pedun-culagin is the major ET found in walnuts; while
punica-lagins and punicalins predominate in pomegranates;
sanguiin H6, sanguiin H10, and lambertiancin C are the
main ETs found in berries) [
120
]. Also, in this study,
re-searchers detected these metabolites in samples collected
16 h after intake, whereas only trace amounts were
de-tected in samples collected before this time point. The
complete clearance of ET metabolism could not be
esti-mated since these metabolites were still detected during
the following 40 h, when the last sample was collected
[
22
]. Urolithins have also been shown to be a
discrimin-ant of walnut consumption in observational studies [
51
],
also highlighting their robustness as BFIs of walnuts in
free-living conditions without dietary restrictions, and
demonstrating that their levels from potential
confound-ing foods are low. Also in this case, analytical methods
have been reported for the quantification of these
me-tabolites in biological samples [
121
], but we could not
find any information related to their stability or
interla-boratory reproducibility.
Finally, walnut consumption has also been associated
with an increase in the levels of 5-hydroxyindole-3-acetic
acid (5-HIAA) [
24
–
26
,
50
,
51
,
81
], which is a metabolite
of the serotonin pathway. Walnuts have a higher serotonin
content than other foods [
24
], and 5-HIAA has been
de-scribed as a discriminant metabolite of walnut
consump-tion in two independent observaconsump-tional studies [
50
,
51
],
which reinforces its plausibility as a robust BFI for
wal-nuts. Feldman and Lee [
24
] reported a dose-dependent
re-lationship between the ingested amount of walnuts and
the urinary 5-HIAA excretion: 16 units of walnut
con-sumption caused an excretion of 26.0 mg of 5-HIAA in
24 h in urine, while double the amount of walnuts caused
excretion of 59 mg/24 h of 5-HIAA. A parallel observation
was made when serotonin was provided by other food
sources [
25
]. Additionally, in a more recent study, the
au-thors also used different serotonin food sources [
26
].
However, the serum levels of 5-HIAA were higher in
sam-ples from subjects who consumed the richest source of
serotonin (i.e., walnuts) in an amount proportional to the
amount provided by each food source. It has been
demonstrated that the levels of this metabolite increase
within 2 h after the consumption of serotonin-containing
foods, and from that moment the concentrations start to
decrease, reaching the baseline values within 24 h [
25
,
26
].
Again, analytical methods for the quantification of this
metabolite in biological samples have been published [
26
],
but we could not find any data about its stability during
sample collection, storage and processing, or
interlabora-tory reproducibility. However, it has also been reported
after intake of other foods such as bananas [
24
]. Although
the contents of serotonin are much higher in walnuts
(> 50
μg/g) than in these other potential sources (for
in-stance, bananas contain about 15
μg/g) [
24
], it is
import-ant to consider also the size of a typical serving, since it
will influence in the final absolute consumption. For
ex-ample, the ingestion of serotonin through a typical dose of
30 g walnuts is approximately the same than the one
ob-tained by the consumption of an average-sized banana of
120 g. Furthermore, 5-HIAA has also been reported after
the consumption of a Jerte Valley cherry product [
122
].
The concentration of serotonin in other common nuts
like almonds is low (≤ 0.6 μ/g) [
24
].
Therefore, as already highlighted in the previous
para-graph, this is a clear example where multi-metabolite
biomarker models may help to overcome the challenge
of having a specific measurement [
117
]. This concept is
outlined in Fig.
2
, where it is schematized that although
none of the candidates as BFIs for walnuts are highly
specific when used as a single BFI (the most frequently
used approach until now), the panel of them might be
characteristic of no common food source other than
walnuts.
Almonds and hazelnuts
Another important group of nuts revised in this paper
are almonds and hazelnuts, which are associated with
in-creased levels of
α-tocopherol [
65
–
75
]. Almonds and
hazelnuts, respectively, have the highest concentrations
of
α-tocopherol among nuts [
5
,
6
]. However, seeds and
vegetable oils, green leafy vegetables, fortified cereals,
and tomatoes are also important dietary sources of
α-tocopherol [
65
].
Additionally, flavan-3-ol-derived metabolites have also
been associated with almond consumption, although
they are also characteristic for tea, wine, and cocoa
intake
[
103
].
Therefore,
joint
measurements
of
α-tocopherol and flavan-3-ol-derived metabolites could
be used to obtain more specific information about
al-mond intake. Nevertheless, additional untargeted
meta-bolomics
studies
would
be
useful
for
proposing
complementary metabolites to build multi-metabolite
biomarker panels [
117
].
Pistachios
Among nuts, pistachios contain the highest levels of
po-tassium,
γ-tocopherol, vitamin K, phytosterols (mainly
β-sitosterol), and xanthophyll carotenoids (lutein and
ze-axanthin). The number of studies considering pistachio
consumption and further metabolite measurements in
biological fluids is very limited [
76
–
78
]. Lutein and
zea-xanthin are particularly interesting compounds as they
are very characteristic of pistachios, among other nuts,
although they are also frequently present in a wide range
of fruits, vegetables [in particular maize (corn) and green
leafy vegetables such as spinach], and egg yolk [
123
,
124
]. Two studies included a targeted quantitative
ana-lysis of these compounds in plasma after a dietary
inter-vention with pistachios [
76
,
78
]. An investigation by
Hernandez-Alonso et al. [
76
] focused on the relationship
between pistachio consumption and the improvement of
cardiometabolic risk markers. In this crossover clinical
trial, lutein and zeaxanthin, together with
α-tocopherol,
were proposed as indicators of pistachio intake to monitor
the compliance with the dietary intervention. Volunteers
were assigned to control diet or a pistachio-supplemented
diet (57 g/day) for 4 months. These compounds were
measured in fasting plasma at baseline, after a 2-week
run-in period and then monthly until the end of each
intervention period, and were shown to be statistically
sig-nificant in the pistachio-supplemented group. However,
different
results
were
reported
in
a
crossover,
dose-response study performed by Kay et al. [
78
]. In this
case, the researchers only found significant increases of
lu-tein in serum after adding one or two daily servings of
pis-tachios to their diets, whereas no changes from baseline
levels in the concentrations of either zeaxanthin or
α-tocopherol were observed.
In a study by Holligan et al. (2014),
β-sitosterol in
plasma was used to verify compliance with the diet
(con-trol diet vs diet with one serving of pistachios vs diet
with two servings of pistachios for 4 weeks) [
77
]. The
levels of
β-sitosterol increased dose dependently and
were found to be consistent with dietary approximations
from daily questionnaires.
In summary, the above-mentioned reported
investiga-tions used the measurement of lutein, zeaxanthin,
β-sitosterol, and α-tocopherols (pistachio components)
to verify compliance with diets rich in pistachios. All of
these compounds are common for many fruits and
vege-tables, as well as for other types of nuts, and thus cannot
be considered specific metabolites of pistachio intake.
Only one study was found that used an untargeted
meta-bolomics approach to study the metabolic response in
biological fluids after pistachio consumption [
125
].
How-ever, it could not be included in the present review
be-cause it only reported on changes in endogenous
metabolites. Therefore, additional complementary
hu-man trials with the use of untargeted metabolomics
might reveal additional compounds or metabolites that
could be suggested as potential biomarkers of intake.
Brazil nuts
Brazil nuts are one of the food sources with the highest
contents of selenium. Accordingly, high levels of
selen-ium have been reported in several studies after intake of
Brazil nuts [
52
–
64
]. Although this essential mineral is
found in many foods, the most relevant dietary source
of selenium is Brazil nuts. However, it is important to
keep
in
mind
that
it
is
also
used
in
dietary
supplements or in enriched foods, as well as that
dif-ferent geographical factors, such as selenium
concen-tration in the soil (which varies from region to
region), impact on the selenium content [
126
].
Selen-ium has also been observed to be a discriminant of
Brazil nut consumption, independently of the
back-ground diet [
63
,
64
]. The highest urinary selenium
concentrations have been measured 4 h after
con-sumption of Brazil nuts and even higher
concentra-tions have been observed after repeated intakes [
52
].
Therefore, it remains to be clarified whether the use
of only this compound is enough to measure the
con-sumption of Brazil nuts or whether other
complemen-tary metabolites should be used jointly for reliable
intake assessment.
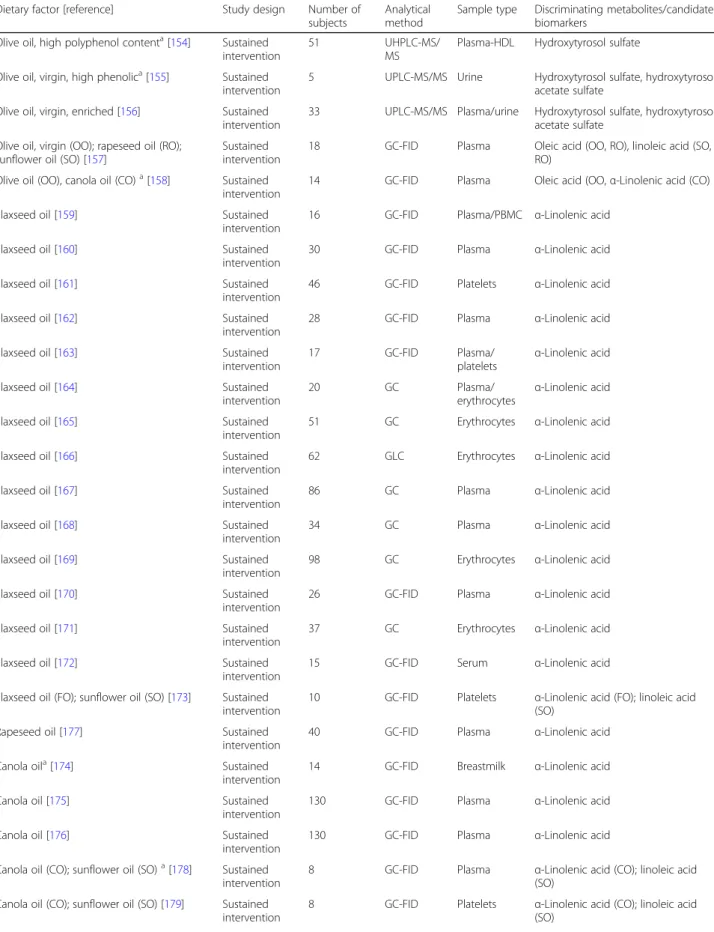
Biomarkers of intake of vegetable oils
Biomarkers of vegetable oil intake have been studied
most often by linking the intake of fatty acids from these
oils to blood plasma and cell responses using controlled
intervention studies [
127
–
134
]. The main oils studied
were olive oil [
127
–
158
], flaxseed oil [
159
–
173
],
rape-seed (canola) oil [
157
,
158
,
174
–
179
], and sunflower oil
[
157
,
173
,
178
–
180
]. The study designs include acute
studies [
133
–
138
,
140
,
181
], and parallel and crossover
dietary intervention studies that vary in the level of
con-trol [
127
–
132
,
141
–
180
]. These studies were often
driven by examining the effects of fatty acids on
cardio-vascular risk factors such as changes in lipoproteins and
hemodynamic factors in low- and high-risk subjects,
thereby measuring compliance with dietary exposure.
The biological specimens analyzed included plasma
and plasma lipid fractions, such as cholesteryl esters
and phospholipids, blood platelets, erythrocytes, and
adipose tissue. In the case of (virgin) olive oil, the
ex-cretion of ingested polyphenols and their metabolites
in urine and plasma was also studied. The
informa-tion in regard to selected studies reporting
associa-tions between the consumption of vegetable oils and
potential relevant BFIs is summarized in Table
3
,
while the information regarding the putative BFIs for
vegetable oils is given in Table
4
and the information
concerning the potential BFIs of vegetable oils that
were considered nonrelevant is given in Additional
file
1
: Table S2.
Olive oil
Olive oil is obtained from the fruits of the olive tree
(Olea europaea) and its fatty acid constituent is
predom-inantly oleic acid [C18:1(n-9)], and depending on type
(refined, virgin, extra virgin oil), variable amounts of
unsaponifiable fatty acids are present [
182
].
Several markers of (virgin) olive oil consumption have
been identified in urine and blood, including tyrosol,
Table 3 Studies reporting associations between consumption and potential candidate food intake biomarkers for vegetable oils
Dietary factor [reference] Study design Number of subjects
Analytical method
Sample type Discriminating metabolites/candidate biomarkers
Olive oil [127] Sustained
intervention
11 GC-FID Erythrocytes Oleic acid
Olive oil [128] Sustained
intervention
12 GC-FID Plasma Oleic acid
Olive oila[129] Sustained
intervention
30 GC-FID Plasma Oleic acid
Olive oil [130] Sustained
intervention
21 GC-FID Plasma/
platelets
Oleic acid
Olive oil [131] Sustained
intervention
16 GC-FID Erythrocytes Oleic acid
Olive oil Sustained
intervention
30 GC-FID Plasma/PBMC Oleic acid
Olive oil, extra virgin [133] Acute study 10 GC Plasma—TAG Oleic acid Olive oil, pomace and refined [134] Acute study 10 GC Serum—TRL Oleic acid Olive oil, virgina[135] Acute study 11 UPLC-MS;
GC-MS
Urine Hydroxytyrosol
Olive oil, different phenolic contenta[136] Acute study 12 GC-MS Urine Hydroxytyrosol, 3-O-methy-hydroxytyrosol
Olive oil, enriched or virgina[137] Acute study 13 UPLC-MS/MS Plasma Hydroxytyrosol sulfate Olive oil, virgin [138] Acute study 13 UPLC-MS/MS Plasma Hydroxytyrosol sulfate Olive oil, high phenolic content [139] Acute study 12 UPLC-MS/MS Plasma Hydroxytyrosol sulfate,
hydroxytyrosol acetate sulfate Olive oil, virgin, moderate and high phenolic
content [140]
Acute study 13 UPLC-MS/MS Plasma Hydroxytyrosol sulfate, hydroxytyrosol acetate sulfate Olive oil, extra virgin [141] Sustained
intervention
10 GC-FID Plasma and
cells
Oleic acid
Olive oil, extra virgin [142] Sustained intervention
424 GC Plasma Oleic acid
Olive oil, different phenolicacompound content [143]
Sustained intervention
30 GC-MS Urine Hydroxytyrosol
Olive oil, different phenol contenta[144] Sustained intervention
200 GC-MS Urine Hydroxytyrosol
Olive oil, high-phenol vs low-phenol extra virgina[145]
Sustained intervention
10 GC-MS Urine Hydroxytyrosol
Olive oils, different phenolic contenta[146] Sustained intervention
30 HPLC Urine Hydroxytyrosol
Olive oil, different phenolic contenta[147] Sustained intervention
38 GC-MS Urine Hydroxytyrosol
Olive oil, refined, common and virgina[148] Sustained intervention
33 HPLC Urine Hydroxytyrosol
Olive oil, extra virgina[149] Sustained intervention
20 HPLC-MS Plasma Hydroxytyrosol
Olive oil, extra virgin [80] Sustained intervention
750 GC-MS Urine Hydroxytyrosol
Olive oil, different phenolic compound contenta[150]
Sustained intervention
28 GC-MS Urine Hydroxytyrosol,
O-methylhydroxytyrosol Olive oil, with different phenolic contentsa
[151]
Sustained intervention
182 GC-MS/MS Urine Hydroxytyrosol, 3-O-methylhydroxytyrosol Olive oil, virgin and refineda[152] Sustained
intervention
36 HPLC-MS/MS Plasma-LDL Hydroxytyrosol sulfate
Olive oil, virgin, enriched [153] Sustained intervention
33 UHPLC-MS/
MS
Table 3 Studies reporting associations between consumption and potential candidate food intake biomarkers for vegetable oils
(Continued)
Dietary factor [reference] Study design Number of subjects
Analytical method
Sample type Discriminating metabolites/candidate biomarkers
Olive oil, high polyphenol contenta[154] Sustained intervention
51 UHPLC-MS/
MS
Plasma-HDL Hydroxytyrosol sulfate
Olive oil, virgin, high phenolica[155] Sustained intervention
5 UPLC-MS/MS Urine Hydroxytyrosol sulfate, hydroxytyrosol acetate sulfate
Olive oil, virgin, enriched [156] Sustained intervention
33 UPLC-MS/MS Plasma/urine Hydroxytyrosol sulfate, hydroxytyrosol acetate sulfate
Olive oil, virgin (OO); rapeseed oil (RO); sunflower oil (SO) [157]
Sustained intervention
18 GC-FID Plasma Oleic acid (OO, RO), linoleic acid (SO, RO)
Olive oil (OO), canola oil (CO)a[158] Sustained intervention
14 GC-FID Plasma Oleic acid (OO,α-Linolenic acid (CO)
Flaxseed oil [159] Sustained intervention
16 GC-FID Plasma/PBMC α-Linolenic acid
Flaxseed oil [160] Sustained intervention
30 GC-FID Plasma α-Linolenic acid
Flaxseed oil [161] Sustained intervention
46 GC-FID Platelets α-Linolenic acid
Flaxseed oil [162] Sustained intervention
28 GC-FID Plasma α-Linolenic acid
Flaxseed oil [163] Sustained intervention
17 GC-FID Plasma/
platelets
α-Linolenic acid
Flaxseed oil [164] Sustained intervention
20 GC Plasma/
erythrocytes α-Linolenic acid Flaxseed oil [165] Sustained
intervention
51 GC Erythrocytes α-Linolenic acid
Flaxseed oil [166] Sustained intervention
62 GLC Erythrocytes α-Linolenic acid
Flaxseed oil [167] Sustained intervention
86 GC Plasma α-Linolenic acid
Flaxseed oil [168] Sustained intervention
34 GC Plasma α-Linolenic acid
Flaxseed oil [169] Sustained intervention
98 GC Erythrocytes α-Linolenic acid
Flaxseed oil [170] Sustained intervention
26 GC-FID Plasma α-Linolenic acid
Flaxseed oil [171] Sustained intervention
37 GC Erythrocytes α-Linolenic acid
Flaxseed oil [172] Sustained intervention
15 GC-FID Serum α-Linolenic acid
Flaxseed oil (FO); sunflower oil (SO) [173] Sustained intervention
10 GC-FID Platelets α-Linolenic acid (FO); linoleic acid (SO)
Rapeseed oil [177] Sustained intervention
40 GC-FID Plasma α-Linolenic acid
Canola oila[174] Sustained intervention
14 GC-FID Breastmilk α-Linolenic acid
Canola oil [175] Sustained
intervention
130 GC-FID Plasma α-Linolenic acid
Canola oil [176] Sustained
intervention
130 GC-FID Plasma α-Linolenic acid
Canola oil (CO); sunflower oil (SO)a[178] Sustained intervention
8 GC-FID Plasma α-Linolenic acid (CO); linoleic acid (SO)
Canola oil (CO); sunflower oil (SO) [179] Sustained intervention
8 GC-FID Platelets α-Linolenic acid (CO); linoleic acid (SO)
hydroxytyrosol, and their metabolites. Dose-response
re-lationships for the excretion of tyrosol and
hydroxytyro-sol in urine were observed in several studies using either
a 1-day [
136
] or a 3-week crossover design [
143
,
144
,
146
–
148
]. Excretion of tyrosol and/or hydroxytyrosol
was maintained when olive oil was included as an
ingre-dient in the daily diet [
80
,
143
,
145
–
147
,
149
–
151
]. For
acute intakes of extra virgin olive oil, time-response
relationships were described in plasma [
183
] and
urine [
135
]. Most of the tyrosol, hydroxytyrosol, and
metabolites were excreted within 6 h after
administra-tion of the dose. In a 4-week single-arm study,
plasma hydroxytyrosol increased about fivefold after
daily administration of 50 mL of extra virgin olive oil
[
149
]. Also, (hydroxy)-tyrosol metabolites
(3-O-methylhy-droxytyrosol, homovanillic acid, homovanillic alcohol,
and hydroxytyrosol sulfate) were identified in urine in
a dose-dependent manner [
136
,
138
,
140
,
184
]. After
3 weeks or more of daily ingestion of olive oils with
varying phenolic content, these and other metabolites
(hydroxytyrosol acetate sulfate, homovanillic alcohol
sulfate, homovanillic acid sulfate, hydroxytyrosol
sul-fate, hydroxytyrosol acetate sulsul-fate, and homovanillic
acid glucuronide) increased in plasma [
152
,
154
,
156
]
and urine [
145
,
149
–
151
]. Ingestion of a single dose
of olive oil with moderate to high phenolic content
also resulted in an increase in the amount of
metabo-lites in both urine [
135
] and plasma [
137
–
139
]. The
increase in plasma metabolites occurred within 6 h
after
dosing.
Hydroxytyrosol
and
its
metabolites
3-O-methylhydroxytyrosol, hydroxytyrosol sulfate, and
hydroxytyrosol acetate sulfate are probably specific for
(extra) virgin olive oil [
185
]. Tyrosol is not only
present in olives but also in wine. Homovanillic acid,
homovanillyl alcohol, and their conjugated metabolites
are also less specific: e.g., homovanillic acid is a
dopa-mine metabolite occurring in human body fluids,
while homovanillyl alcohol can be detected in honey
as it is a constituent of the mandibular secretion of
honeybees [
185
].
Table 3 Studies reporting associations between consumption and potential candidate food intake biomarkers for vegetable oils
(Continued)
Dietary factor [reference] Study design Number of subjects
Analytical method
Sample type Discriminating metabolites/candidate biomarkers
Sunflower oil [180] Sustained intervention
37 GC Plasma-CE/
ASAT
Linoleic acid
ASAT abdominal subcutaneous adipose tissue, CE cholesterol esters, FID flame ionization detector, GC gas chromatography, GLC gas-liquid chromatography, HPLC high-performance liquid chromatography, MS mass spectrometry, MS/MS tandem mass spectrometry, PBMC peripheral blood mononuclear cell, TAG
triacylglycerides, UHPLC ultra-high performance liquid chromatography
a
The study includes other nonrelevant metabolites (included in Additional file1: Table S2)
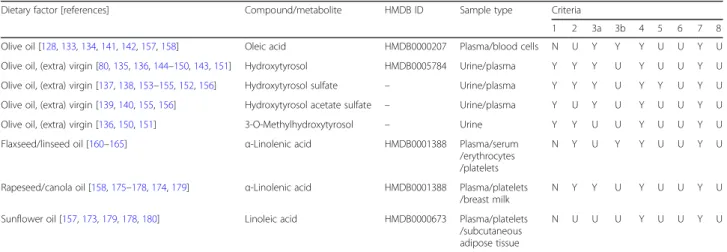
Table 4 Validation scheme of potential food intake biomarkers for vegetable oils
Dietary factor [references] Compound/metabolite HMDB ID Sample type Criteria
1 2 3a 3b 4 5 6 7 8 Olive oil [128,133,134,141,142,157,158] Oleic acid HMDB0000207 Plasma/blood cells N U Y Y Y U U Y U Olive oil, (extra) virgin [80,135,136,144–150,143,151] Hydroxytyrosol HMDB0005784 Urine/plasma Y Y Y U Y U U Y U Olive oil, (extra) virgin [137,138,153–155,152,156] Hydroxytyrosol sulfate – Urine/plasma Y Y Y U Y Y U Y U Olive oil, (extra) virgin [139,140,155,156] Hydroxytyrosol acetate sulfate – Urine/plasma Y U Y U Y U U Y U Olive oil, (extra) virgin [136,150,151] 3-O-Methylhydroxytyrosol – Urine Y Y U U Y U U Y U Flaxseed/linseed oil [160–165] α-Linolenic acid HMDB0001388 Plasma/serum
/erythrocytes /platelets
N Y U Y Y U U Y U
Rapeseed/canola oil [158,175–178,174,179] α-Linolenic acid HMDB0001388 Plasma/platelets /breast milk
N Y Y U Y U U Y U
Sunflower oil [157,173,179,178,180] Linoleic acid HMDB0000673 Plasma/platelets /subcutaneous adipose tissue
N U U U Y U U Y U
HMDB human metabolome database, N no, U unknown, Y yes. Criteria: C1—Plausibility, Is the marker compound plausible as a specific BFI for the food or food group?; C2—Dose response, Is there a dose-response relationship at relevant intake levels of the targeted food?; C3—Time response, Is the biomarker kinetics described adequately to make a wise choice of sample type, frequency and time window?; C3a, single dose; C3b, multiple doses; C4, Robustness, Has the marker been shown to be robust after intake of complex meals reflecting the dietary habits of the targeted population?; C5, Reliability, Has the marker been shown to compare well with other markers or questionnaire data for the same food/food group?; C6, Stability, Is the marker chemically and biologically stable during biospecimen collection and storage, making measurements reliable and feasible?; C7, Analytical performance, Are analytical variability (CV%), accuracy, sensitivity and specificity known as adequate for at least one reported analytical method?; C8, Reproducibility, Has the analysis been successfully reproduced in

![Table 3 Studies reporting associations between consumption and potential candidate food intake biomarkers for vegetable oils Dietary factor [reference] Study design Number of](https://thumb-eu.123doks.com/thumbv2/123dokorg/8259987.129966/12.892.83.797.144.1087/reporting-associations-consumption-potential-candidate-biomarkers-vegetable-reference.webp)