FULL TEMPORAL RECONSTRUCTION USING AN ADVANCED
LONGITUDINAL DIAGNOSTIC AT THE SPARC FEL
G. Marcus
∗, J. Rosenzweig, UCLA, Los Angeles, USA
M. Artioli, A. Bacci, M. Bellaveglia, E. Chiadroni, A. Cianchi, F. Ciocci, G. Di Pirro,
M. Ferrario, G. Gatti, L. Giannessi, A. Mostacci, A. Petralia, V. Petrillo,
M. Quattromini, J. Rau, A. Rossi, V. Surrenti, ENEA/INFN-LNF, Frascati, ITALY
Abstract
The production of ultra-short (sub 100 fs) single-spike radiation possessing full longitudinal coherence from a free-electron laser (FEL) has been the subject of intense study. The diagnosis of said pulses has proven to be chal-lenging. A Frequency-Resolved Optical Gating (FROG) diagnostic has been developed and tested at UCLA, which has the capability of providing a longitudinal reconstruc-tion of these ultra-fast pulses. This paper reports the results of the application of the diagnostic at the SPARC FEL fa-cility.
INTRODUCTION
Free-electron lasers operate on the principle that the pas-sage of a relativistic electron beam (e-beam) through a pe-riodic magnetic undulator with peak magnetic field Bucan excite tunable and narrow bandwidth radiation resonant at the wavelength λr = λu(1 + K2/2)/2γ2and its harmon-ics. Here, K = eBu/mcku is the dimensionless undula-tor parameter, ku = 2π/λuis the undulator wavenumber, and γ is the electron beam energy in units of the rest en-ergy mc2. Single pass self-amplified spontaneous emission (SASE) FELs are capable of producing sub 100 fs x-ray pulses[1], which have applications in ultra-fast time reso-lution studies[2]. These pulses can potentially be used to image material structure and dynamics at length and time scales of atomic motion. They are only partially coher-ent, however, because the emitted light results from the amplification of e-beam shot noise. Thus, the longitudinal structure of the pulse extends over the length of the e-beam and contains many uncorrelated, coherent spikes of radia-tion. Improving the longitudinal coherence of SASE FEL pulses has been the subject of intense study. A promising method relies on phase space manipulations of the e-beam to preferentially concentrate the gain along only one longi-tudinal section[3]. This method combines a energy chirped e-beam with a undulator taper such that only one coherent spike of radiation evolves to reach saturation. The diagno-sis of these ultra-short pulses, however, can be extremely challenging. The Frequency-Resolved Optical Gating[4]
(FROG) diagnostic and pulse reconstruction technique has proven to be extremely effective in analyzing ultra-fast light sources and has become a cornerstone in many ultra-fast laser labs. In this paper we discuss a Transient-Grating (TG) FROG diagnostic in particular. It has the advantage of minimal alignment degrees of freedom and is not lim-ited by bandwidth excitation constraints that plague other FROG geometries, thus making it capable of diagnosing ultra-fast pulses ranging from the ultraviolet to the infrared wavelength regions. We include preliminary results of the application of this diagnostic to the measurement of ultra-fast pulses at the SPARC facility.
ULTRASHORT PULSE GENERATION
FROM A SASE FEL
The production of ultra-fast, coherent pulses of light from a SASE FEL is challenging. The emission of sponta-neous undulator radiation is a stochastic process, thus giv-ing SASE FEL radiation the properties of chaotic light, being the result of e-beam shot-noise amplification. A method for improving the longitudinal coherence of a SASE FEL was recently realized by Giannessi et al. in [3] by imparting a energy chirp on the e-beam and sensi-bly tapering successive undulator sections such that only a short section of the e-beam experiences high gain. The energy chirp serves to detune the e-beams local resonant frequency, so the higher velocity of light brings the radia-tion spike out of resonance as it slips forward in the slower e-beam. For a e-beam with a linear chirp the energy change a radiation spike experiences as it slips forward is found to be
γ(z) = γs+ αzηωu
ωr
. (1)
Here, γs is the e-beam energy where the radiation spike begins amplification, z is the longitudinal coordinate along the undulator, α quantifies the energy chirp, η accounts for the different propagation velocities of light in differ-ent regimes of the amplification process (expondiffer-ential gain or saturation), ωu = cku, and ωr = 2πc/λr. By applying a undulator taper where
K(z) = 2 r (γs+ αzηωu ωr )2ωu ωr −1 2 (2)
Proceedings of IPAC2011, San Sebastián, Spain THPC100
02 Synchrotron Light Sources and FELs
A06 Free Electron Lasers 3119 Copyright
c○ 2011 by IP A C’11/EPS-A G — cc Cr eati v e Commons Attrib ution 3.0 (CC BY 3.0)
Beam expander
Input mask
Cylindrical lensFresnel biprism Nonlinear medium Output mask Spherical lens
Camera Grating
Input pulse from transport
Signal pulse from four-wave mixing in nonlinear medium Camera front D ela y Frequency 1 2 3
Knife edge slit
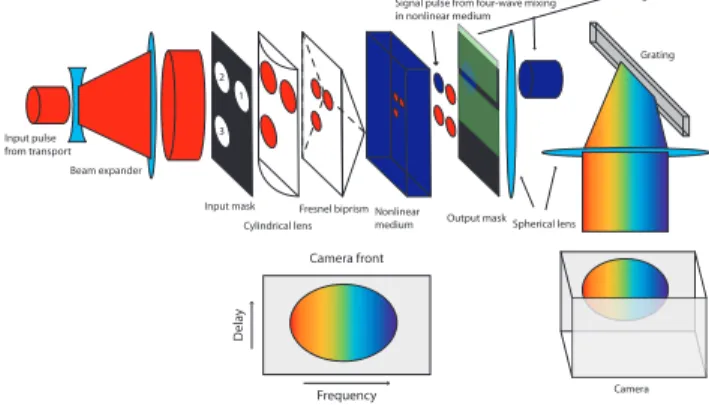
Figure 1: Transient-grating FROG geometry.
the detuning experienced by the radiation spike due to slip-page is compensated only for pulses with the appropriate propagation velocity. It becomes possible for only one sin-gle coherent spike to reach full saturation. These ultra-fast pulses of radiation require advanced longitudinal diagnos-tics to analyze their temporal structure.
FROG DIAGNOSTIC
A custom fabricated FROG diagnostic (see figure 1) was built and tested at UCLA that was designed with the unique capabilities and challenges of a FEL facility in mind, and was based off of a geometry first proposed in [5]. The pulse obtained from transport from the end of the undu-lator is expanded to a relatively large diameter and is then passed through a mask, which serves to split the pulse into three identical copies (gate and probe pulses). The pulse expansion serves two purposes. FEL pulses may contain a transverse profile that is not uniform in intensity and that also carries transverse phase information. The degree to which these effects appear depends on what stage of the gain process the light pulse is in when it is extracted. These effects will transfer to any FROG trace, making a longitudi-nal reconstruction corrupt or, in the worst case, impossible. Therefore, selecting only the center of the transverse pro-file filters out these effects and leaves a uniform and trans-versely phase-constant wavefront. It also allows the cre-ation of three identical beams without resorting to the use of multiple delay stages and beamsplitters, which would in-troduce more alignment degrees of freedom in an already position sensitive and complex diagnostic.
These three beams are then passed through a cylindri-cal lens, which brings each pulse to a line focus within the nonlinear medium. Using a short focal length cylindrical lens allows for tighter focusing resulting in a smaller spot size and greater energy density at the point of interaction. Before reaching the nonlinear medium, however, the beams are passed through a fresnel bi-prism, which serves to cross these interfering beams at a large angle. This creates a variable delay between the probe and gate pulses that is mapped along a transverse dimension, here along the
ver-tical axis. Therefore, this FROG geometry operates on a single shot basis, foregoing the need for an additional delay line. A major advantage of the bi-prism is that it is inher-ently aligned in space and time, thereby further simplifying the alignment.
The interaction of the gate and probe pulses within the nonlinear medium produces an autocorrelation signal, which is selected by the output mask and knife edge slit. The mask also obstructs the probe and gate pulses, helping to reduce the noise in the trace. The autocorrelation signal is passed through a custom fabricated spectrometer consist-ing of a collimatconsist-ing lens, diffraction gratconsist-ing and focusconsist-ing lens. The diffraction grating is oriented such that the pulse is spectrally dispersed along the transverse dimension or-thogonal to the delay direction, here horizontally. Imaging the resulting pulse into a ccd camera yields the FROG trace. While some of these properties are common to many FROG geometries, the TG FROG boasts some character-istics that make it ideal for FEL facilities. It utilizes a third order, rather than second order, nonlinear optical process, which is at once its greatest strength and greatest weak-ness. While it does not suffer from the excitation band-width constraints that second order processes do, it re-quires more field intensity. It therefore phase matches a much larger bandwidth, which is ideal for a tunable laser source, while requiring a respectable amount of energy. This is a relatively minor concern, though, for most high-gain FEL amplifiers. It also works on a single-shot basis, which is necessary for investigations into SASE FEL pulses where the longitudinal shot to shot variability in the pulse is large. The FROG diagnostic transversely filters the input pulse by selecting only the center of the transverse profile. This ensures that no transverse intensity or phase informa-tion, which is certainly relevant in FEL pulses, corrupts the FROG trace.
FROG Trace and Longitudinal Reconstruction
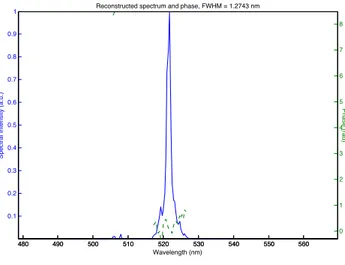
The experiment in [3] was repeated, under slightly dif-ferent operating conditions, with the goal of measuring the longitudinal intensity profile of the FEL light. After extrac-tion from vacuum and transport from the end of the undu-lator to the FROG diagnostic the FEL light produced the FROG trace found in figure 2. Computer code was written to longitudinally reconstruct the FEL light using a recon-struction algorithm based on the ”Vanilla” scheme[4]. The reconstruction yields a FROG trace found in figure 3 and shows excellent overall agreement with the experimental trace with a FROG error of ∼ 0.013. The relatively small error and convergence to a FROG trace that strongly re-sembles the experimental trace are strong indications that the reconstruction is accurate. The reconstructed longi-tudinal intensity profile and spectrum can be found in fig-ures 4 and 5. The longitudinal intensity profile has a full width half max (FWHM) of δτF W HM ∼ 112.2 fs while the spectral FWHM is δλF W HM ∼ 1.3 nm. These two values combine to yield a time bandwidth product (TBP)
THPC100 Proceedings of IPAC2011, San Sebastián, Spain
3120 Copyright c○ 2011 by IP A C’11/EPS-A G — cc Cr eati v e Commons Attrib ution 3.0 (CC BY 3.0)
02 Synchrotron Light Sources and FELs A06 Free Electron Lasers
Original (Experimental) FROG trace Delay (fs) Wavelength (nm) −500 −400 −300 −200 −100 0 100 200 300 400 500 500 505 510 515 520 525 530 535 540
Figure 2: Experimental FROG trace.
Delay (fs)
Wavelength (nm)
Reconstructed FROG trace: iter = 100 Err = 0.013124
−500 −400 −300 −200 −100 0 100 200 300 400 500 500 505 510 515 520 525 530 535 540
Figure 3: Reconstructed FROG trace.
of T BPF W HM ∼ 0.99. We also quote here the rms time bandwidth product because it more effectively represents “wings” in the pulse. We find that the T BPrms ∼ 2.04. These preliminary results agree with analytic theory and initial numerical particle simulations.
CONCLUSION
A TG FROG geometry has been developed and tested at UCLA that has the capability of accurately diagnosing ultra-fast (sub 100 fs) light pulses. This specific design was chosen with a high-gain SASE FEL in mind and has unique capabilities that makes it attractive to facilities pos-sessing such a source. It operates on a single-shot basis and works from the UV to the IR with minimal changes. Re-sults from initial experiments at the SPARC facility look promising. Future work includes further comparisons to in depth numerical particle simulations using the 3D FEL code Genesis[6]. −1000 −500 0 500 1000 0.1 0.2 0.3 0.4 0.5 0.6 0.7 0.8 0.9 1 Time (fs) Intensity (a.u.)
Reconstructed pulse Intensity and Phase, FWHM = 112.1661 fs
−1000 −500 0 500 1000 −4 −3 −2 −1 0 1 2 3 4 Phase (rad)
Figure 4: Reconstructed longitudinal intensity profile.
480 490 500 510 520 530 540 550 560 0.1 0.2 0.3 0.4 0.5 0.6 0.7 0.8 0.9 1 Wavelength (nm)
Spectral Intensity (a.u.)
Reconstructed spectrum and phase, FWHM = 1.2743 nm
480 490 500 510 520 530 540 550 560 0 1 2 3 4 5 6 7 8 Phase (rad)
Figure 5: Reconstructed sspectrum.
ACKNOWLEDGMENTS
The authors would like to thank the entire SPARC team for the long hours spent in the control room mak-ing this work possible. This research is supported by grants from Department of Energy Contract Nos. DE-FG02-07ER46272 and DE-FG03-92ER40693 and Office of Naval Research Contract No. N00014-06-1-0925.
REFERENCES
[1] P. Emma et al., Nat. Photon. 4, 641 (2010)[2] P. Corkum and F. Krausz, Nature Phys. 3, 381 (2007) [3] L. Giannessi et al., Phys. Rev. Lett. 106, 144801 (2011) [4] R. Trebino. Frequency-Resolved Optical Gating, Kluwer
Academic Publishers (2000)
[5] Dongjoo Lee, et al., Opt. Exp. 15(2), 760 (2007)
[6] S. Reiche, Nucl. Instrum. Methods Phys. Res., Sect. A 429, 243 (1999).
Proceedings of IPAC2011, San Sebastián, Spain THPC100
02 Synchrotron Light Sources and FELs
A06 Free Electron Lasers 3121 Copyright
c○ 2011 by IP A C’11/EPS-A G — cc Cr eati v e Commons Attrib ution 3.0 (CC BY 3.0)