Correction of cardiac output obtained by
Modelflow
®
from finger pulse pressure profiles
with a respiratory method in humans
Enrico TAM
∗, Marcel AZABJI KENFACK†, Michela CAUTERO
∗, Federic LADOR†,
Guglielmo ANTONUTTO
∗‡, Pietro Enrico
DIPRAMPERO
∗‡, Guido FERRETTI†
and Carlo CAPELLI
∗‡
∗
Dipartimento di Scienze e Tecnologie Biomediche, School of Medicine, P.le Kolbe 4, I-33100, Udine, Italy, †D´epartement de
Physiologie, Centre M´edical Universitaire, 1 rue Michel Servet, CH–1211 Gen`eve 4, Switzerland, and ‡Microgravity, Ageing,
Training, Immobility Center of Excellence, P.le Kolbe 4, I-33100, Udine, Italy
A
B
S
T
R
A
C
T
The beat-by-beat non-invasive assessment of cardiac output ( ˙Q, litre· min−1) based on the arterial pulse pressure analysis called Modelflow®can be a very useful tool for quantifying the cardiovas-cular adjustments occurring in exercising humans. ˙Q was measured in nine young subjects at rest and during steady-state cycling exercise performed at 50, 100, 150 and 200 W by using Modelflow® applied to the Portapres® non-invasive pulse wave ( ˙QModelflow) and by means of the open-circuit
acetylene uptake ( ˙QC2H2). ˙Q values were correlated linearly (r= 0.784), but Bland–Altman analysis revealed that mean ˙QModelflow− ˙QC2H2difference (bias) was equal to 1.83 litre· min−1with an S.D. (precision) of 4.11 litre· min−1, and 95 % limits of agreement were relatively large, i.e. from− 6.23 to + 9.89 litre · min−1. ˙QModelflow values were then multiplied by individual calibrating factors
obtained by dividing ˙QC2H2by ˙QModelflowfor each subject measured at 150 W to obtain corrected ˙
QModelflow( ˙Qcorrected) values. ˙Qcorrectedvalues were compared with the corresponding ˙QC2H2values, with values at 150 W ignored. Data were correlated linearly (r= 0.931) and were not significantly different. The bias and precision were found to be 0.24 litre· min−1 and 3.48 litre· min−1 respectively, and 95 % limits of agreement ranged from− 6.58 to + 7.05 litre · min−1. In conclusion, after correction by an independent method, Modelflow®was found to be a reliable and accurate procedure for measuring ˙Q in humans at rest and exercise, and it can be proposed for routine purposes.
INTRODUCTION
The Modelflow® method for the beat-by-beat assess-ment of cardiac output ( ˙Q; litre· min−1) makes it possible
to reconstruct instantaneous aortic blood flow from arter-ial blood pressure pulsation by simulating a three-element non-linear and time-varying model of aortic com-pliance [1]. Numerical integration of flow during systole yields the stroke volume of the heart. ˙Q can then be
com-Key words: cardiac output, cycling, open-circuit acetylene uptake, pulse pressure analysis, stroke volume, Modelflow®.
Abbreviations: ˙Q, cardiac output; ˙QC2H2, ˙Q determined by open-circuit acetylene uptake; ˙QModelflow, ˙Q determined by
Modelflow®; ˙Q
corrected, corrected ˙QModelflow.
Correspondence: Dr Carlo Capelli (e-mail [email protected]).
puted by multiplying the stroke volume by the corres-ponding heart rate.
Application of Modelflow®to pulse pressure profiles obtained non-invasively from finger tip recordings of arterial blood pressure could be of great clinical advantage. In the companion paper by Azabji Kenfack et al. [1a], however, we have shown that the ˙Q values obtained from finger-tip pressure profiles are approx. 25 % higher than those obtained invasively from the
radial artery. These results suggest that Modelflow® Q˙ values ought to be corrected by an established method for the measurement of ˙Q.
The aim of the present study was to test the hypothesis that, after appropriate correction using an independent method, Modelflow® provides reasonably accurate ˙Q values at rest and during exercise ranging from moderate to severe intensities. To this end, average steady-state
˙
Q values obtained by Modelflow® ( ˙Q
Modelflow) at rest
and exercise were independently corrected using a calibration factor obtained using the open-circuit acety-lene technique ( ˙QC2H2) [2].
METHODS
Subjects
Experiments were carried out on nine male healthy sub-jects (age, 24.6 +− 2.96 years; body mass, 74.6 +− 6.90 kg; and height, 180.4 +− 4.03 cm). All subjects were informed about the procedures and the potential risks of the experiments and they all signed an informed consent form. The study was approved by the Ethics Committee of the School of Medicine of Udine and conformed with the principles outlined in the Declaration of Helsinki [3].
Methods
Reference ˙Q ( ˙QC2H2) was measured by means of an
open-circuit acetylene technique [2]. At rest and the exercise steady state, the subject inhaled a gas mixture containing 21 % O2, 6 % helium and 1.5 % acetylene
balanced with nitrogen for a total of 20–25 breaths. Gas concentrations during breathing of the mixture were monitored continuously on a mass spectrometer (Airspec 2200, Gillingham, Kent, U.K.). Inspired and expired gas volumes were determined by an ultrasonic flow meter (Tuba; GHG, Zurich, Switzerland). Gas fractions and flow signals were calibrated before each experiment by means of gas mixtures of known composition and by means of predefined inspiratory and expiratory volumes obtained by using a calibrated 3 litre syringe (Hans Rudolph, Kansas City, MO, U.S.A.). At each ˙QC2H2
measurement, a pneumatic piston operated a shuttle valve (Hans Rudolph) placed between the ultrasonic flow meter and a two-way non-rebreathing valve. The pneumatic servomechanism (Burosoft, Udine, Italy) deviated the inflow from ambient air to the acetylene-containing gas mixture administered from a high-pressure gas cylinder via a Douglas bag. ˙QModelflow was determined
continu-ously at rest and during exercise from arterial pulse pressure profiles recorded non-invasively by using a Portapres®system (TNO-TPD Biomedical
Instrument-ation, Amsterdam, The Netherlands). The photoplethy-smographic cuff of Portapres® was positioned on the
index and middle fingers. The Portapres® signal was
calibrated following the procedure indicated by the manufacturer. The height adjustment sensor and the ref-erence were positioned according to the manufacturer’s instructions.
Pulse pressure, gas fractions and respiratory flow sig-nals were digitized by means of a 16-bit A/D converter (MP100; Biopac Systems, Santa Barbara, CA, U.S.A.) operated by commercial software (ACK100W; Biopac Systems) running on a PC. Acquisition rate was set at 100 Hz. Exercise was performed on an electromagnet-ically braked cycle ergometer (Ergomed 840L; Siemens, Erlangen, Germany).
Pulse pressure profiles were then fed to a PC run-ning the Beatscope® 1.0 software (TNO-TPD), imple-menting the Modelflow®model and making it possible
to calculate heart rate and beat-by-beat stroke volumes of the heart. The Modelflow®method for the
beat-by-beat assessment of ˙Q makes it possible to reconstruct instantaneous aortic blood flow from arterial blood pressure pulsation by simulating a three-element non-linear and time-varying model of aortic compliance [1]. Numerical integration of flow during systole yielded the stroke volume of the heart. ˙Q can then be computed by dividing the stroke volume by the corresponding R-R interval.
Protocol
Subjects were referred to the laboratory after a light meal consumed 2 h before. They were seated on the ergometer and the Portapres®cuffs were positioned. After the
cali-bration procedures were completed, the mouthpiece and the nose-clip were placed in position and the acquisition of the gas fractions, flow and blood pressure signals was started. After 4 min rest, ˙QC2H2was measured. Then, the
subject started pedalling against a 50 W workload at a constant pedalling rate of 60 revs· min−1. At the fifth
minute of exercise, ˙QC2H2was measured again. At the end
of the measurement, the subject immediately stopped and rested for 5 min. A new exercise run was then performed by increasing the workload by 50 W. Two additional exercise steps, separated by 5 min of rest, were performed up to the highest workload of 200 W.
Correction of ˙
Q
Modelflowwith ˙
Q
C2H2In order to correct measured ˙QModelflow for ˙QC2H2, a
workload was selected and, at the steady state, the average ˙QModelflowwas calculated as the mean of
beat-by-beat values over 1 min. A calibration factor was then calculated for each subject as the ratio of average
˙
QModelflow/ ˙QC2H2. The selected workload was 150 W, that
is the workload at which this ratio showed the lowest coefficient of variability. The individual calibration factors were then used to recalculate average ˙QModelflow
Figure 1 Mean values of ˙QModelflow and ˙QC2H2 plotted
against workload
Statistics
Correlation between variables was calculated by the least-squares method using the procedure of Brace [4]. Regression parameters were analysed by using the pro-cedures for the comparison of regression lines of the first kind [5]. Significant differences among average values in the different workload conditions were evaluated by means of two-way ANOVA [6]. Student’s t test for one-sample analysis was utilized to reject the hypothesis of sample mean equal to zero or one. Agreement be-tween the two methods of measurements was assessed by means of Bland–Altman analysis [7]. ANOVA for repeated measurements was applied to identify significant differences between averages related to the different workloads [8].
RESULTS
The average ˙QModelflowand ˙QC2H2values as a function of
the workload are shown in Figure 1. Linear regressions were calculated on the entire data in both cases (n= 45; ˙QModelflow: y= 7.09 + 0.092x, r = 0.926; ˙QC2H2:
y= 4.41 + 0.100x, r = 0.937). These lines had the same slopes, but significantly different y-intercepts. This means that ˙QModelflow was shifted upward with respect to
˙ QC2H2.
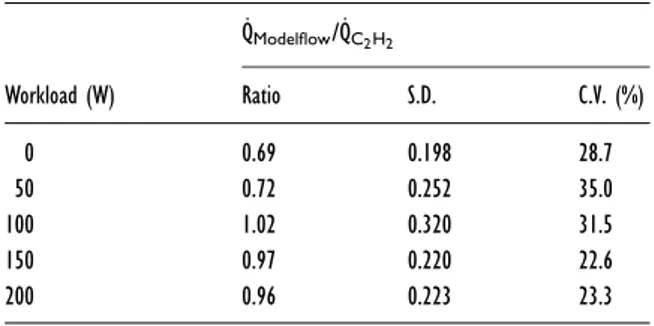
The ratios between ˙QModelflowand ˙QC2H2are shown in
Table 1. These ratios varied significantly with the work-loads. The ratios at 100, 150 and 200 W were not sig-nificantly different from 1. The smallest S.D., and thus the smallest coefficient of variation, was found at 150 W. The average of all the correction factors computed at all the workloads, including rest, was 0.87 ( +− 0.269).
Table 1 Means, S.D. and coefficient of variation (C.V.) of ˙
QModelflow/ ˙QC2H2 ratios at rest and at the four workloads
evaluated ˙QModelflow/˙QC2H2 Workload (W) Ratio S.D. C.V. (%) 0 0.69 0.198 28.7 50 0.72 0.252 35.0 100 1.02 0.320 31.5 150 0.97 0.220 22.6 200 0.96 0.223 23.3
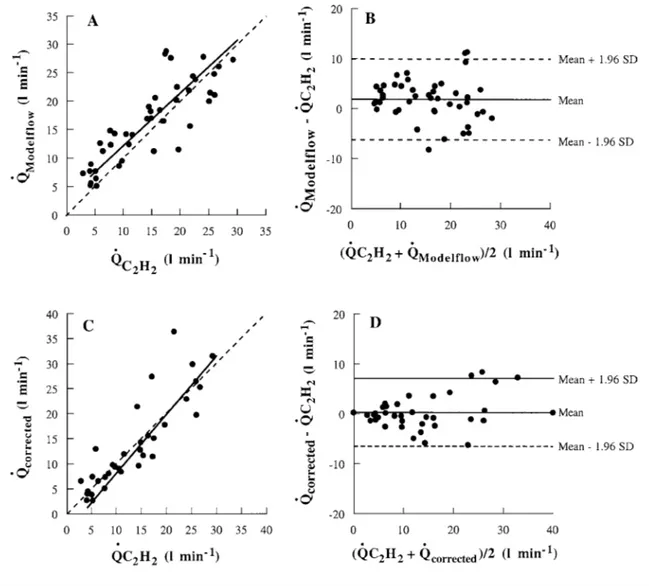
Individual mean ˙QModelflow plotted as a function of
the corresponding ˙QC2H2 is shown in Figure 2(A). The
linear relationship between these two parameters was y= 0.932x+ 2.81, indicating that the regression line was dis-placed upward with respect to the equality line (the line on which both sets of data would lie if they were identical). ˙QModelflowvalues were significantly correlated
with ˙QC2H2values (r= 0.784, P < 0.01).
The results of the Bland–Altman analysis are shown in Figure 2(B). The bias (mean ˙QModelflow− ˙QC2H2) was
1.83 litre· min−1. The bias value was significantly larger
than 0, thus confirming that the regression line was displaced upward with respect to the equality line. The S.D. (precision) was 4.11 litre· min−1and the 95 % limits of agreement ranged from− 6.23 to + 9.89 min−1.
Corrected ˙QModelflowvalues ( ˙Qcorrected) at rest and at all
workloads, except 150 W, which was used to calculate the correction factor (see the Methods section), are plotted as a function of the corresponding ˙QC2H2in
Fig-ure 2(C). The regression equation was y= 1.177x − 3.75. ˙
Qcorrectedvalues were correlated significantly with ˙QC2H2
values (r= 0.931, P < 0.01). The results of Bland–Altman analysis are shown in Figure 2(D). The bias (mean Qcorrected− QC2H2) was 0.24 litre· min−1and did not
dif-fer from 0. This indicated that the line relating Qcorrected
and QC2H2was equal to the equality line. S.D. (precision)
was 3.48 litre· min−1 and the 95 % limits of agreement
ranged from− 6.58 to + 7.05 min−1.
DISCUSSION
In the present study, the hypothesis that, after appropriate correction with an independent method, Modelflow®
provides reasonably accurate ˙Q values was tested at rest and during exercise. To this end, non-invasive ˙Q values obtained with Modelflow®were corrected for
indepen-dently established ˙Q values measured with the open-circuit acetylene technique. The main finding of the present study is that, after such a correction, Modelflow®
applied to the arterial pulse pressure measured non-invasively on the finger did indeed provide a non-biased
Figure 2 Relationship between ˙QModelflow, ˙QC2H2and ˙Qcorrected
(A) ˙QModelflowdetermined for each subject plotted against the corresponding ˙QC2H2values. (B) Difference between ˙QC2H2 and ˙QModelflowvalues plotted against
their mean. (C) ˙Qcorrectedvalues determined in each subject plotted against the corresponding ˙QC2H2 values. (D) Difference between ˙QC2H2and ˙Qcorrectedvalues
plotted against their mean. In (A) and (C), the broken lines correspond to the lines of equality, and the solid lines are the regression lines. In (B) and (D), broken lines represent the 95 % limits of agreement.
and reliable measure of ˙Q in healthy subjects at rest and during exercise, ranging from moderate to severe inten-sities, whereas uncorrected Modelflow® Q values˙ ( ˙QModelflow) were significantly different from the
cor-responding ˙QC2H2values.
To our knowledge, the present study is the first in which ˙Qcorrected values were compared with those
measured with a respiratory method ( ˙QC2H2) during
high-intensity exercise at steady state in humans. As such, the method offers a valid non-invasive approach for the assessment of ˙Q on a beat-by-beat basis to exercise phy-siologists that is applicable not only at the exercise steady state, but also during exercise transients.
The results presented in Figures 1, 2(A) and 2(B), showing uncorrected ˙QModelflow values, are consistent
with those obtained by others. Remmen et al. [9]
compared Modelflow®applied to peripheral pulse
pres-sure profiles with thermodilution and showed that Modelflow®did not yield accurate ˙Q values in healthy
elderly subjects at rest. Houtman et al. [10] showed that Modelflow® did not accurately predict ˙Q during
cycling exercise of moderate intensity compared with the CO2rebreathing procedure. Taken together, these results
underline the need for correcting ˙QModelflowvalues with a
calibration factor obtained by an independent method if the accuracy of the method is to be improved. At rest, such a correction was indeed shown to substantially improve the accuracy of ˙QModelflow values [11]. The
accuracy at rest was also increased when haemodynamic conditions were modified either pharmacologically or during surgery [1]. In none of the cited studies, however, was such a correction applied during exercise. This was
done in the present study, and this is of novelty in our study.
In order to proceed with this correction, the ˙QC2H2
assessed at 150 W was taken as the reference. The rationale of this choice was based on the results obtained from a post-hoc analysis performed on the ˙QModelflow/
˙
QC2H2 ratios at the various workloads. This analysis
showed that ˙QModelflow/ ˙QC2H2ratio at 150 W was closest
to, and not significantly different from, 1 and had the lowest coefficient of variation.
The open-circuit soluble gas method [2,12–14], used for correction in the present study, is a well-established method for ˙Q computation. It showed fairly good agree-ment with the direct Fick method both at rest and during exercise up to 90 % of maximal O2 uptake (Vo2max)
[2,12,14]. A comparison of the open-circuit acetylene uptake compared with the closed-circuit acetylene re-breathing method at exercise was recently carried out [13], showing a very good agreement between the two methods. However, investigators are not compelled to use this method for the correction of ˙QModelflowvalues: any
steady-state method, either invasive or non-invasive, may be conveniently used, provided it is at least as accurate and precise as the respiratory method used in the present study.
The present study showed that ˙QModelflow was
sig-nificantly larger than ˙QC2H2, consistent with the results
of the companion paper by Azabji Kenfack et al. [1a] and with the data from Houtman et al. [10] during cycling exercise. This overestimate of ˙Q is at least partially explained by the peripheral site of signal sampling, as de-monstrated in the companion paper by Azabji Kenfack et al. [1a]. It is noteworthy, however, that Modelflow®
relies on data from the elastic properties of thoracic and abdominal aortas obtained from post-mortem examin-ations of patients from 30- to 88-years old [15]. The age of our subjects is below this range, thus introducing a further potential source of error. However, correction was carried out with a respiratory technique and this allowed circumvention of all the problems brought about by the assumption of the given elastic characteristics of the aorta.
In conclusion, Modelflow® applied to non-invasive
recordings of pulse pressure profiles from small peri-pheral arteries can be considered a reliable procedure for measuring ˙Q on a beat-by-beat basis in resting and exercising humans, but only if a correction by a well-established independent steady-state method (open-circuit acetylene uptake in the present case) is carried out. Therefore, applied in combination with such a method, it could be accepted as an excellent alternative to invasive approaches for measuring ˙Q in dynamic conditions and exercise transients both in healthy subjects and cardiovascular patients.
The need for an independent individual recalibration of the method, however, does not allow us to apply
Modelflow® to the monitoring of large cohorts of
patients in the clinical environment. Its utilization must be restricted to the study of specific highly monitored situations, such as research protocols on a limited number of subjects, but only if access to a calibration procedure is possible.
ACKNOWLEDGMENTS
This research was supported by the Italian Space Agency grant ASI I/R/300/02 to C. C., and by Swiss National Science Foundation grants 31-64267.00 and 32-61780.00 to G. F. The research was carried out during the STBR-IP (Short Term Bed Rest-Integrative Physiology) campaign organised by the European Space Agency (ESA) and the German Space Agency (DLR) taking place from 2001 to 2003 at the Institute of Aerospace Medicine of DLR in Cologne, Germany. We greatly acknowledge the co-operation of Dr Martina Heer and Dr Andrea Boese of the Institute of Aerospace Medicine, Cologne, Germany.
REFERENCES
1 Wesseling, K. H., Jansen, J. R. C., Settles, J. J. and Schreuder, J. J. (1993) Computation of aortic flow from pressure in humans using a nonlinear, three-element model. J. Appl. Physiol. 74, 2566–2573
1a Azabji Kenfack, M., Lador, F., Licker, M. et al. (2004) Cardiac output by Modelflow®method from intra-arterial
and fingertip pulse pressure profiles. Clin. Sci. 106, 365–369 2 Barker, R. C., Hopkins, S. R., Kellogg, N. et al. (1999)
Measurement of cardiac output during exercise by open-circuit acetylene uptake J. Appl. Physiol. 87, 1506–1512
3 World Medical Association (1997) World Medical Association Declaration of Helsinki. Recomendations guiding physicians in biomedical research involving human subjects. Cardiovasc. Res. 35, 2–3
4 Brace, R. A. (1977) Fitting straight lines to experimental data. Am. J. Physiol. 233, R94–R99
5 Lentner, C. (1982) Comparison of two regressions lines of the first kind. In Geigy Scientific Tables Vol. 2:
Introduction to Statistics, Statistical Tables, Mathematical Formulae, pp. 214–215, Ciba-Geigy, Basle
6 Box, G. E. P., Hunter, W. G. and Hunter, J. S. (1978) Statistics for Experimenters. An introduction to design, data analysis and model building, Wiley & Sons, New York 7 Bland, J. M. and Altman, D. G. (1986) Statistical methods
for assessing agreement between two methods of clinical measurement. Lancet 8, 307–310
8 Daniel, W. W. (1991) Biostatistics: a foundation for analysis in the health sciences, Wiley, New York
9 Remmen, J. J., Aengevaraen, R. M., Verheugt, F. W. A. et al. (2002) Finapres arterial pulse wave analysis with Modelflow®is not a reliable non-invasive method for
assessment of cardiac output. Clin. Sci. 103, 143–149 10 Houtman, S., Oeseburg, B. and Hopman, M. T. (1999)
Non-invasive cardiac output assessment during moderate exercise: pulse contour compared with CO2rebreathing.
Clin. Physiol. 19, 230–237
11 Jellema, W. T., Wesseling, K. H., Groenvald, A. B., Stoutenbeek, C. P., Thijs, L. G. and van Lieshout, J. J. (1999) Continuous cardiac output in septic shock by simulating a model of the aortic input impedance: a comparison with bolus injection thermodilution Anesthesiology 90, 1317–1328
12 Becklake, M. R., Varvis, C. J., Pengelly, L. D., Kenning, S., McGregor, M. and Bates, D. V. (1962) Measurement of pulmonary blood flow during exercise using nitrous oxide. J. Appl. Physiol. 17, 579–586
13 Bell, C., Monahan, K. D., Donato, A. J., Hunt, B. E., Seals, D. R. and Beck, K. C. (2003). Use of acetylene breathing to determine cardiac output in young and older adults. Med. Sci. Sports Exercise 35, 58–64
14 Johnson, B. D., Beck, K. C., Proctor, D. N., Miller, J., Dietz, N. M. and Joyner, M. J. (2000) Cardiac output during exercise by the open circuit acetylene washing method: comparison with direct Fick. J. Appl. Physiol. 88, 1650–1658
15 Langewouters, G. J., Wesseling, K. H. and Goedhard, W. J. A. (1984) The static elastic properties of 45 human thoracic and 20 abdominal aortas in vitro and the parameters of a new model. J. Biomech. 17, 425–435
Received 15 September 2003/7 October 2003; accepted 7 November 2003 Published as Immediate Publication 7 November 2003, DOI 10.1042/CS20030302