Cardiac output by Modelflow
®
method
from intra-arterial and fingertip pulse
pressure profiles
Marcel AZABJI KENFACK
∗, Federic LADOR
∗, Marc LICKER†, Christian MOIA
∗,
Enrico TAM‡, Carlo CAPELLI‡§, Denis MOREL† and Guido FERRETTI
∗∗
D´epartement de Physiologie, Centre M´edical Universitaire, 1 rue Michel Servet, CH–1211 Gen`eve 4, Switzerland,
†D´epartement d’Anesth´esiologie, Pharmacologie et Soins Intensifs Chirurgicaux, Hˆopital Cantonal Universitaire, Bˆatiment Op´era,
1211 Gen`eve 4, Switzerland, ‡Dipartimento di Scienze e Tecnologie Biomediche, School of Medicine, P.le Kolbe 4, I-33100,
Udine, Italy, and §Microgravity, Ageing, Training, Immobility Center of Excellence, P.le Kolbe 4, I-33100, Udine, Italy
A
B
S
T
R
A
C
T
Modelflow®, when applied to non-invasive fingertip pulse pressure recordings, is a poor predictor of cardiac output ( ˙Q, litre· min−1). The use of constants established from the aortic elastic characteristics, which differ from those of finger arteries, may introduce signal distortions, leading to errors in computing ˙Q. We therefore hypothesized that peripheral recording of pulse pressure profiles undermines the measurement of ˙Q with Modelflow®, so we compared Modelflow® beat-by-beat ˙Q values obtained simultaneously non-invasively from the finger and invasively from the radial artery at rest and during exercise. Seven subjects (age, 24.0+− 2.9 years; weight, 81.2+− 12.6 kg) rested, then exercised at 50 and 100 W, carrying a catheter with a pressure head in the left radial artery and the photoplethysmographic cuff of a finger pressure device on the third and fourth fingers of the contralateral hand. Pulse pressure from both devices was recorded simultaneously and stored on a PC for subsequent ˙Q computation. The mean values of systolic, diastolic and mean arterial pressure at rest and exercise steady state were significantly (P< 0.05) lower from the finger than the intra-arterial catheter. The corresponding mean steady-state ˙Q obtained from the finger ( ˙Qporta) was significantly (P< 0.05) higher than that computed from the
intra-arterial recordings ( ˙Qpia). The line relating beat-by-beat ˙Qportaand ˙Qpiawas y= 1.55x − 3.02
(r2= 0.640). The bias was 1.44 litre · min−1 and the precision was 2.84 litre· min−1. The slope
of this line was significantly higher than 1, implying a systematic overestimate of ˙Q by ˙Qporta
with respect to ˙Qpia. Consistent with the tested hypothesis, these results demonstrate that pulse
pressure profiles from the finger provide inaccurate absolute ˙Q values with respect to the radial artery, and therefore cannot be used without correction with a calibration factor calculated previously by measuring ˙Q with an independent method.
INTRODUCTION
The analysis of the dynamic changes in cardiac output ( ˙Q, litre· min−1) during exercise transients requires beat-to-beat determinations of this parameter. Several methods
Key words: cycling exercise, cardiac output, intra-arterial pressure, pulse pressure analysis, Modelflow®, stroke volume. Abbreviations: cZ, characteristic impedance; Pd, diastolic blood pressure; Ps, systolic blood pressure; Pm, mean blood pressure;
˙
Q, cardiac output; ˙Qporta, ˙Q obtained by application of Modelflow®to pulse pressure profiles recorded non-invasively from a finger artery; ˙Qpia, ˙Q obtained by application of Modelflow®to pulse pressure profiles recorded invasively from the radial artery. Correspondence: Dr Carlo Capelli (e-mail [email protected]).
were proposed, including impedance cardiography [1], Doppler echocardiography [2,3] and methods derived from the analysis of the pulse pressure profile. All these methods, however, have some limitations. Impedance cardiography is limited by artefacts due to thoracic
movements: it works conveniently at rest, but it is unreliable during exercise. Doppler echocardiography depends on the subject’s cooperation, as the probe must remain fixed at a given position above the investigated artery: this can hardly be achieved during exercise.
Pulse pressure analysis is promising, but it is not yet optimized. Two methods have been proposed to calculate beat-by-beat ˙Q from pulse pressure profiles in humans, the pulse contour [4–6] and the Modelflow®
[7] methods. The latter model makes it possible to reconstruct aortic blood flow from arterial blood pressure pulses by simulating a three-element non-linear and time-varying model of aortic compliance. Numerical integr-ation of flow during systole yields the stroke volume of the heart. ˙Q can then be calculated by multiplying the stroke volume by the corresponding heart rate. ˙Q values obtained with the Modelflow® applied to
non-invasive pulse pressure recordings from the finger during moderate steady-state exercise were compared with ˙Q values obtained simultaneously by CO2 rebreathing
[8], and Modelflow® was found to be an inaccurate predictor of ˙Q. These results may be due to the fact that Modelflow® utilizes constants whose values were
established from the elastic characteristics of the aortic wall [9] and, thus, may differ from those of small arteries of the finger. The pulse wave characteristics of a peripheral artery are, in fact, remarkably different from those of a central artery [10], and this may introduce a distortion in the modelled flow signal that may cause errors in the determination of ˙Q.
In the present study, we tested the hypothesis that the results of Houtman et al. [8] were a consequence of peripheral recording of pulse pressure profiles. To test this hypothesis, beat-by-beat ˙Q values obtained by application of Modelflow® to pulse pressure profiles recorded non-invasively from a finger artery ( ˙Qporta) were
compared with the beat-by-beat ˙Q values obtained by application of the same model to the corresponding pulse pressure profiles recorded simultaneously from the radial artery ( ˙Qpia), at both rest and during exercise.
METHODS
Subjects
Seven healthy non-smoking young subjects took part in the experiments (age, 24.0 +− 2.9 years, and weight, 81.2 +− 12.6 kg). All subjects were informed about the procedures and the potential risks of the experiments and signed an informed consent form. The study was carried out after obtaining local ethical approval.
Methods
An intra-arterial catheter (Seldi Cath 3F; Plastimed, St. Leu Laf ˆoret, France) carrying a pressure head (Grass-Telefactor; Astro-Med, West Warwick, RI, U.S.A.) for continuous intra-arterial pressure recording was inserted
into the left radial artery. The photoplethysmographic cuffs of a finger pressure device (Portapres®;
TNO-TPD Biomedical Instrumentation, Amsterdam, The Netherlands) were placed on the third and fourth fingers of the contralateral hand. The subject’s arms were sustained by a scarf fixed around the neck, in order to avoid compression due to handlebar grasping.
The gain of the intra-arterial pressure head was 100 mmHg/V, with a 0 mmHg signal set at 0 V (ambient air). The Portapres®signal was calibrated following the
procedure indicated by the manufacturer. The height adjustment sensor and reference were positioned accord-ing to the manufacturer’s instructions.
Pulse pressure signals from both devices and the ECG were digitized by means of a 16-bit A/D converter (MP100, Biopac Systems, Santa Barbara, CA, U.S.A.) operated by commercial software (ACK100W; Biopac Systems) running on a PC. Acquisition rate was set at 100 Hz. Exercise was performed on an electromagnet-ically braked cycle ergometer (Ergomed 840L; Siemens, Erlangen, Germany).
The obtained pulse pressure profiles were fed to the Portapres® system and analysed off-line by a
com-putational algorithm to determine systolic (Ps), diastolic
(Pd) and mean (Pm) blood pressures. Beat-by-beat
R-R interval and stroke volume were then calculated from both pressure signals by using the procedure incorporated in the Beatscope® software program
(version 1.0; TNO-TPD Biomedical Instrumentation) and implementing the Modelflow®model [7].
Beat-by-beat ˙Q was then calculated by dividing stroke volume by the corresponding R-R interval.
Protocol
After insertion of the arterial catheter, the subject sat on the ergometer and the Portapres®cuff was positioned.
After 5 min of rest, exercise at 50 W was started for 10 min. After a 10 min recovery, the 100 W exercise started, again for a 10 min duration, followed by a 10 min recovery. The pulse pressure profiles from both the intra-arterial catheter and the Portapres®device were recorded continuously during the entire protocol.
Statistical analysis
Data are presented as means +− S.D. Each mean value is the mean of all the beats at rest and at the exercise steady-state (from fourth min of exercise onwards) recorded on all subjects, so that for each parameter n= 10048. The effects of the measurement site (radial artery compared with the fingertip) were evaluated by Student’s t test for paired observations. The effects of exercise intensity were not evaluated. Linear regression was calculated by the least-squares method using the procedure of Brace [11]. Agreement between the two methods of measurements was assessed by means of Bland–Altman analysis [12]. Significance level was set at P< 0.05.
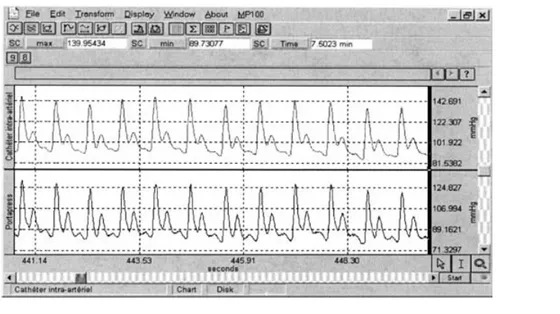
Figure 1 Example of intra-arterial (upper) and finger (lower) pulse pressure profiles recorded at rest
RESULTS
An example of pulse pressure tracings recorded simultaneously at rest from the radial artery and from the finger is shown in Figure 1. Absolute pressure values are systematically higher in the radial artery than the finger. Moreover, the shape of the pressure profiles differed between the two recordings: the tracings from the fingertip showed a larger dicrotic incision and a more rapid pressure decrease during diastole.
The mean values of Ps, Pdand Pm at rest and at the
steady state of the two investigated workloads from both the intra-arterial pressure head and the Portapres®finger
cuff are shown in Table 1. The values from the finger were significantly and systematically lower than those from the radial artery. In addition, the S.D. of Ps, Pd and
Pm obtained from the Portapres® finger cuff, with the
exception of resting Ps, were significantly greater than
those from the radial artery.
The corresponding mean values of ˙Q calculated with the Modelflow®applied to both devices are also shown in Table 1. The mean steady-state ˙Qporta values were
significantly (P< 0.05) and systematically higher than
those for ˙Qpia. In addition, as for Ps, Pdand Pm, the S.D. of
˙
Qportawere systematically larger than those of ˙Qpia. ˙Qporta
from all heart beats in all subjects are plotted in Figure 2 as a function of the corresponding ˙Qpia. The
cor-responding linear relationship is described by the fol-lowing regression equation: y= 1.55x − 3.02, R2= 0.640.
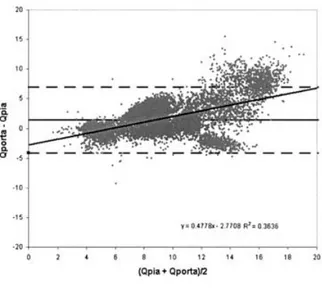
The results of the Bland–Altman analysis are shown in Figure 3. The bias (mean ˙Qporta − ˙Qpia) was 1.44 litre·
min−1, with an S.D. (precision) of 2.84 litre· min−1,
and the 95 % confidence interval ranged from − 4.12 to + 7.01 litre · min−1. The line relating the parameters shown in Figure 3 has a significant positive slope ( y= 0.48x− 2.77, r = 0.603). This indicated that the
regres-Table 1 Ps,Pd,Pmand ˙Q at rest and exercise steady state (50 and 100 W) measured from the intra-arterial pressure head and the finger device (Portapres®).
Values are means +− S.D.
Location of measurement Intra-arterial Fingertip Ps(mmHg) Rest 152.4 +− 16.4 120.4 +− 19.3 50 W 175.5+− 7.8 167.0+− 33.9 100 W 191.5 +− 0.7 172.0 +− 24.0 Pd(mmHg) Rest 96.5 +− 14.9 84.0 +− 36.8 50 W 88.5+− 5.0 77.5+− 33.2 100 W 87.4 +− 8.2 78.2 +− 12.6 Pm(mmHg) Rest 122.0 +− 21.2 100.0 +− 36.8 50 W 116.0 +− 9.9 102.0 +− 39.6 100 W 113.7 +− 1.9 100.5 +− 15.7 ˙Q (litre· min−1) Rest 6.9+
− 0.6 6.6+− 3.3 50 W 10.1 +− 1.2 11.2 +− 3.9 100 W 11.5 +− 1.9 13.4 +− 3.7
sion line between ˙Qporta and ˙Qpia has a slope
signi-ficantly higher than 1, implying that ˙Qportasystematically
overestimates ˙Q with respect to ˙Qpia.
DISCUSSION
Equivalent pulse pressure tracings from the finger and main arteries should provide equivalent ˙Q values. This being the case, the relationship between beat-by-beat ˙Q values determined from pulse pressure profiles recorded from the finger and the corresponding beat-by-beat ˙Q values from the same pulse pressure profiles recorded
Figure 2 Q˙portaas a function of ˙Qpia
All individual beats at rest and exercise are reported (n= 10048). The continuous line is the regression line, the broken line is the equality line.
Figure 3 Bland–Altman analysis of the differences between ˙
Qpiaand ˙Qportaas a function of the mean of the two values for each beat
The line relating these parameters has a significant positive slope (y= 0.48x − 2.77,r= 0.603).
simultaneously from a more proximal artery, in the present case the radial artery, would be equal to the line of equality (the line on which both sets of data would lie if they were identical). However, the main finding of the present study was that the slope of the line relating beat-by-beat ˙Qportato beat-by-beat ˙Qpiawas significantly
higher than that of the equality line, as demonstrated by a Bland–Altman analysis (Figure 3). This indicates that the pulse pressure profiles recorded from the finger yield an overestimate of beat-by-beat ˙Q. From the slope of the
regression line, this overestimate can be quantified to be of the order of 55 %.
The finding that fingertip pressure profiles provide unreliable ˙Q values has been demonstrated in a previous study [8] in which a comparison of ˙Qporta with ˙Q
determined by CO2rebreathing at rest and at the steady
state of submaximal workloads was carried out. In that study [8], the average difference (bias) between the two methods amounted to 2.27 +− 3.90 litre · min−1. In the present study, the comparison between ˙Qpia and ˙Qporta
suggested that the inaccuracy shown by Houtman et al. [8] could be, at least partially, due to an intrinsic error persisting by the peripheral site of pulse pressure recording. The radial artery was retained as the site for invasive pulse pressure profile recordings, despite the fact that the Modelflow®makes use of constants determined
on the post mortem elastic characteristics of the aorta [9]. In addition, Wesseling et al. [7] measured ˙Q by Modelflow®from the radial artery, and they concluded that the ˙Q values obtained from this site were sufficiently precise with respect to computation from the aorta, despite the changes in flow characteristics while moving from the latter to the former site. On these bases, the use of radial artery pressure profiles as a reference site in the present study is fully justified.
Non-invasive photoplethysmographic recordings of pulse pressure, however, are applied to peripheral small arteries of the finger, and possess lower absolute pressure values [13,14], as shown in Table 1, and a different pulse wave morphology [10], as indicated in Figure 1. The lower blood pressure values observed in the finger arteries may be explained either by the significant hydraulic resistance to flow with respect to more proximal arteries or by the vascular tone pre-vailing at the finger level. If the former case is correct, different relationships between pulse pressure and flow compared with the radial artery may be expected, and this may indeed explain most of the significant differences between ˙Qporta and ˙Qpia observed in the present study.
Concerning the latter case, the answer would only become apparent after performing a similar experiment following administration of a blood pressure enhancer, such as phenylephrine.
The computation algorithm implemented in the Beatscope®software includes a waveform filtering
pro-cedure aimed at reconstructing the brachial artery pressure pulse from the finger arterial pressure, and a correction for pressure level is also introduced [13,15]. This correction procedure improves the accuracy of the method by reducing the pressure level differences between the two sites. Nevertheless, the data in the present study show that these corrections are insufficient to provide equivalent values of ˙Qportaand ˙Qpia, especially
during exercise.
The so-called characteristic impedance (cZ) method is another earlier means of calculating ˙Q from pulse
pressure analysis [16–18]. Also, this method was modified in order to correct for the effect of changes in blood pressure, vascular tone, heart rate and vascular resistance that occur during exercise, hypervolaemia and application of lower body negative pressure [4–6]. However, the corrections incorporated in the cZ method are based on empirical coefficients, whereas Modelflow®, although relying on the post mortem elastic characteristics of the major aortic vessels, exploits a theoretical model of the vascular system. Finally, the coefficient of variation for resting ˙Q with the cZ method turned out to be larger than with Modelflow®[6].
When changes in ˙Q relative to baseline values are to be investigated, Modelflow®applied to non-invasive
continuous recordings of pulse pressure profiles from the finger could be a reliable method for ˙Q measurements. Because the error shown for ˙Qportais systematic, the
re-lative ˙Q changes obtained with Modelflow®are probably
accurate enough, even though it is less precise than other established steady-state methods [6–8,19]. However, absolute ˙Q values computed from non-invasive pulse pressure profiles from the finger were found to be significantly different from those obtained from the radial artery. Therefore, if radial artery pressure profiles provide accurate ˙Q values [7], absolute non-invasive ˙Q values with Modelflow®should not be used without correcting
them for a calibration factor obtained previously by means of an independent established method. This conclusion is similar to that attained by others for the cZ methods [4–6]. In the accompanying paper [20], the accuracy of Modelflow® applied to non-invasive
pulse pressure profiles is analysed and a correction pro-cedure proposed.
ACKNOWLEDGMENTS
This study was supported by a grant (no. 31-64267.00) from the Swiss National Science Foundation to G.F., and by a grant from the Italian Space Agency to C.C. (ASI I/R/300/02).
REFERENCES
1 Kubicek, W. G., Karnegis, J. N., Patterson, R. P., Witsoe, D. A. and Mattson, R. H. (1966) Development and evaluation of an impedance cardiac output system. Aerosp. Med. 12, 1208–1212
2 Colocousis, J. S., Huntsman, L. L. and Curreri, P. W. (1977) Estimation of stroke volume changes by ultrasonic doppler. Circulation 56, 914–917
3 Christie, J., Sheldahl, L. M., Tristani, F. E., Sagar, K. B., Ptacin, M. J. and Wann, S. (1987) Determination of stroke volume and cardiac output during exercise: comparison of two-dimensional and Doppler echocardiography, Fick oximetry, and thermodilution. Circulation 76, 539–547 4 Antonutto, G., Girardis, M., Tuniz, D. and di Prampero,
P. E. (1995) Noninvasive assessment of cardiac output from arterial pressure profiles during exercise. Eur. J. Appl. Physiol. 72, 18–24
5 Antonutto, G., Girardis, M., Tuniz, D., Petri, E. and Capelli, C. (1994) Assessment of cardiac output from noninvasive pressure profile in subjects at rest. Eur. J. Appl. Physiol. 69, 183–188
6 Stok, W. J., Baisch, F., Hillebrecht, A., Sculz, H., Meyer, M. and Karemaker, J. M. (1993) Noninvasive cardiac output measurement by arterial pulse analysis compared with inert gas rebreathing. J. Appl. Physiol. 74, 2687–2693
7 Wesseling, K. H., Jansen, J. R. C., Settles, J. J. and Schreuder, J. J. (1993) Computation of aortic flow from pressure in humans using a nonlinear, three-element model. J. Appl. Physiol. 74, 2566–2573
8 Houtman, S., Oeseburg, B. and Hopman, M. T. (1999) Non-invasive cardiac output assessment during moderate exercise: pulse contour compared with CO2rebreathing.
Clin. Physiol. 19, 230–237
9 Langewouters, G. J., Wesseling, K. H. and Goedhard, W. J. A. (1984) The static elastic properties of 45 human thoracic and 20 abdominal aortas in vitro and the parameters of a new model. J. Biomech. 17, 425–435 10 Remington, J. W. and Wood, E. H. (1956) Formation of
peripheral pulse contour in man. J. Appl. Physiol. 9, 433–442
11 Brace, R. A. (1977) Fitting straight lines to experimental data. Am. J. Physiol. 233, R94–R99
12 Bland, J. M. and Altman, D. G. (1986) Statistical methods for assessing agreement between two methods of clinical measurement. Lancet 8, 307–310
13 Gizdulich, P., Prentza, A. and Wesseling, K. H. (1997) Models of brachial to finger pulse wave distortion and pressure decrement. Cardiovasc. Res. 33, 698–705 14 Idema, R. N., Van den Meiracker, A. H., Imholz. B. P. et al.
(1989) Comparison of Finapres non-invasive beat-to-beat finger blood pressure with intrabrachial artery pressure during and after bicycle ergometry. J. Hypertens. 7, S58–S59
15 Bos, W. J. W., Van Goudoever, J., Van Montfrans, G. A., Van den Meiracker, A. H. and Wesseling, K. H. (1996) Reconstruction of brachial artery pressure from
noninvasive finger pressure measurements. Circulation 94, 1870–1875
16 Warner, H. R., Swan, H. J. C., Connolly, D. C., Tompkins, R. G. and Wood, E. H. (1952) Quantitation of beat-to-beat changes in stroke volume from the aortic pulse contour in man. J. Appl. Physiol. 5, 495–507
17 Kouchoukos, N. T., Sheppard, L. C. and McDonald, D. A. (1970) Estimation of stroke volume in the dog by a pulse contour method. Circ. Res. 26, 611–623
18 Alderman, E. L., Branzi, A., Sanders, W., Brown, B. W. and Harrison, D. C. (1972) Evaluation of the pulse contour method of determining stroke volume in man. Circulation 46, 546–558
19 Remmen, J. J., Aengevaeren, W. R., Verheugt, F. W. et al. (2002) Finapres arterial pulse wave analysis with Modelflow is not a reliable non-invasive method for assessment of cardiac output. Clin. Sci. 103, 143–149 20 Tam, E., Azabji Kenfack, M., Cautero, M. et al. (2004)
Correction of cardiac output obtained by Modelflow®
from finger pulse pressure profiles with a respiratory method in humans. Clin. Sci. 106, 371–376
Received 15 September 2003; accepted 7 November 2003