ANALISI DI TRANSITORI NON MITIGATI:
PERDITA DI REFRIGERANTE DA PICCOLA
ROTTURA IN PWR, PERDITA D’ACQUA DI
ALIMENTO DEL GV IN PWR E SBO IN BWR
(ANALYSES OF UNMITIGATED
TRANSIENTS: SMALL BREAK LOCA IN
PWR, LOSS OF FEEDWATER IN PWR AND
CONTENTS
ABSTRACT ... 7
1.
EXECUTIVE SUMMARY ... 9
2.
PWR TRANSIET ANALYSES ... 13
2.1
ENEA activity ... 13
2.1.1
Analysis of unmitigated SBLOCA transient ... 13
2.2
Unmitigated Loss of Feedwater ... 19
2.2.1
Analysis of calculated data ... 19
3.
BWR FUKUSHIMA DAIICHI UNIT I SEVERE ACCIDENT MODEL ... 22
3.1
Boiling Water Reactors NPP description ... 22
3.1.1
The BWR MARK 1 Containment description ... 23
3.2
BWR Main Emergency Systems ... 23
3.2.1
High Pressure Heat Removal System – Isolation Condenser system ... 23
3.2.2
High Pressure Heat Removal System
– Reactor Core Isolation Cooling
System ... 24
3.2.3
High Pressure Coolant Injection System ... 25
3.2.4
Emergency Spray Systems ... 26
3.2.5
Overpressure Protection and Automatic Depressurization System ... 27
3.2.6
Containment venting system... 28
3.3
Reference accident description ... 29
3.3.1
Fukushima Daiichi NPP site layout ... 29
3.3.2
The accident ... 31
3.3.3
Sequence of events at Fukushima Daiichi Unit 1 ... 32
3.4
MELCOR 2.1 model developing ... 33
3.4.1
MELCOR nodalization approach ... 33
3.4.2
CORE Model ... 35
3.4.3
Thermal hydraulic model ... 39
3.4.4
Containment model ... 45
3.4.5
HS ... 46
3.4.6
RN package ... 46
3.4.7
DCH ... 47
3.4.8
Cavities ... 48
3.4.9
Burn ... 50
3.5
Model results and comparison with data available from TEPCO ... 50
3.5.1
Water level into the RPV ... 50
3.5.2
RPV and DW Pressure ... 51
3.5.3
Core degradation ... 54
4.
CONCLUSIONS ... 58
5
ABBREVIATIONS ... 59
ABSTRACT
This report presents the activity performed in the framework of LP1 (Sviluppo Competenze Scientifiche nel Campo della Sicurezza Nucleare), Objective B (Safety Assessment e Valutazioni D'impatto) task B2 (Valutazioni di Rischio e Scenari Incidentali) Topic 2 (Calcolo Integrale di Scenari Incidentali) of the PAR 2016, ADP ENEA-MiSE. Considering as a reference reactor a generic PWR of 900 MWe, two different unmitigated accidents scenarios have been studied by using MELCOR code: a Small Break LOCA (SBLOCA) and a Loss of FeedWater (LFW) transient. The characterization of the thermal-hydraulic behaviour and the possible in-vessel core degradation phenomena are here analyzed. Referring to BWR, this work is a continuation of the PAR 2015 activity. A new and more detailed MELCOR thermal hydraulic nodalization of the Fukushima Daiichi Unit 1 have been developed in order to reproduce the accident scenario. Moreover, dealing with the MELCOR best practices, some input parameters have been changed to better represent the plant response to the severe accident. The Fukushima Daiichi Unit 1 severe accident (consequence of the March 11, 2011 heartquake and tsunami) was simulated by using MELCOR code and the results of the calculated data have been compared with the plant data publically available at the scientific technical community.
1. EXECUTIVE SUMMARY
Deterministic safety analysis is used to analytically characterize physical phenomena, taking place in a selected Nuclear Power Plant (NPP) during a transient progression (e.g. Design Basis Accident – DBA– and Beyond Design Basis Accident –BDBA–) due a postulated events. In general selected highest challenging cases are selected for a computational deterministic safety analyses (e.g. DBA). BDBA and severe accidents are also considered to determine possible actions to prevent significant core degradation and mitigate source term release [1-3].
Deterministic safety analyses [1-4] in general, give necessary informations to judge if selected safety requirements are fulfilled by selected NPP in transient conditions and, in the case of a postulated severe accident progression, give also the possibility to have a fission product source term estimation. Computer codes are the key tools for performing deterministic safety analyses considering their specific applications (e.g. thermal-hydraulic system code, severe accident code, etc).
When a postulated event determines an unmitigated transient, due to postulated several concurrent malfunctions, the core cooling could be not enough to maintain the fuel and flow channel geometry and the core and the related structural materials could start their degradation and consequent relocation phenomena along the core and the lower plenum. In these scenarios the core material and the cooling flow paths could lose their original geometry, well known in term of core cooling capability, and the new configuration is characterized by a mixture of molten corium and debris with a consequent geometry determining an uncertain core cooling capability. Then the evolution of the severe accident starts and will evolve considering the different postulated extreme boundary conditions and mitigation actions that are postulated to do not succeed during the accident evolution. Considering the complexity and mutual different interacting phenomena along a severe accident progression and the possible source term release to the environment, the research on severe accidents [5-10] is fundamental in order to characterize the main phenomena determining the transient evolution of the plant and to support SAM assessment. Within this regard a key role is done by the State-of-Art severe accident codes (as ASTEC [11,12], MAAP [13,14], MELCOR [15,16], etc [4]), that storing all the knowledge developed in the last decades from the experimental activities, permit the prediction of the transient behaviour of a plant, during a severe accident, and qualitatively and quantitatively can support the assessment of SAM.
Following Fukushima accident events, a particular attention on unmitigated Nuclear Power Plant (NPP) accidents and their mitigation has been addressed by the International Scientific Community. This interest has induced the study of different unmitigated accidents in order to understand their progression and, starting from a thermal-hydraulic analysis of the transient, to evaluate their consequences in terms of core damage and fission products release [17,22].
In term of research and development on severe accidents, ENEA is involved in the maintenance of a nuclear safety culture in order to have a high level technical point of view to support independent Italian national evaluations. Infact, though nuclear energy is not part of Italian energy mix, several NPPs are at the Italian border areas. Therefore Italian capability to analyse possible postulated plant accident progressions is of strategic interest for our national emergency preparedness strategy. Infact these analyses are the basis for technical-scientific prediction of potential risk scenarios, planning of response activity and possible prevention in order to minimize damage in the event of potential contamination of Italian territory.
Example of outcomes of the code applications developed in the ENEA-MiSE framework (Accordo di Programma ENEA-MiSE su Sviluppo Competenze Scientifiche nel Campo della Sicurezza Nucleare e Collaborazione ai Programmi Internazionali per il Nucleare di IV Generazione) have been reported in [17-22] In particular Figure 1.1 and 1.2 show fission product source term release (in term of group of element with similar chemical properties [15]), predicted by MELCOR code, coming out from a containment leak and from the SG SRV (due a SGTR rupture with a consequent containment bypass) respectively. Figure 1.3 shows the related primary and secondary pressure behavior during the transient progression. As a further example, Table 1.1, shows the chronology of the main events subsequent to a double ended cold leg rupture in a PWR-900 like, predicted by MELCOR code and the related collapsed coolant level in the core and lower plenum region, Figure 1.4 [21,22].
Figure 1.1: Products released from containment leak predicted by MELCOR code for an unmitigated SBO in a generic PWR-900 like [19].
Figure 1.2: Products released from SG SRVs predicted by MELCOR code for an unmitigated SBO in a generic PWR-900 like [19].
In the present work two different unmitigated PWR accidents scenarios have been studied by using MELCOR code: Small Break LOCA (SBLOCA) and a Loss of Feed Water (LFW) transient. The characterization of the thermal-hydraulic behaviour and the possible in-vessel core degradation phenomena are here analyzed. Further, in the present work, the severe accident analysis code MELCOR has been used to analyze the behaviors of the severe accident occurred at Fukushima Daiichi nuclear power plant Unit 1 (consequence of the March 11, 2011 heartquake and tsunami). A new and more detailed MELCOR thermal hydraulic nodalization of the Fukushima Daiichi Unit 1 have been developed in order to reproduce the accident scenario. Moreover, dealing with the MELCOR best practices, some input parameters have been changed to better represent the plant response to the severe accident. The Fukushima Daiichi Unit 1 severe accident was simulated by using MELCOR code and the results of the calculated data have been compared with the plant data publically available at the scientific technical community.
Figure 1.3: Primary and secondary pressure bahavior predicted by MELCOR code for an unmtigated SBO in a generic PWR-900 like [19,20].
Table 1.1: Chronology of main events subsequent to an unmitigated double ended CL 1 rupture predicted by MELCOR code [21,22].
Event Time
Steady state reactor operation < 0 s
Break opening 0 s
Reactor SCRAM ̴ 100 ms
Turbine isolation ̴ 1 s
Stop of primary pumps ̴ 2 s
Start of accumulators discharge ̴ 2 s
First total core uncovery 8 s
First gap activity release 10 s
Isolation of accumulators 34 s
Oxidation onset 875 s
First fuel rod failure 2003 s
First material slump in lower plenum 5339 s
Figure 1.4: Collapsed coolant level behavior in the core and lower plenum region in a unmitigated double ended CL break [21,22].
2. PWR TRANSIET ANALYSES 2.1 ENEA activity
In the framework of severe accident research activity developed by ENEA, funded by the Italian Ministry of Economic Development (Accordo di Programma ENEA-MiSE), a MELCOR nodalization of a generic PWR of 900 MWe [18,21,22] has been developed, by using SNAP [23], based on public information’s available from the scientific technical literature [18, 21, 22, 24-27]. A detailed description of the MELCOR nodalization is reported in [21]. An independent Source Term database based on the most severe accident sequence, due a postulated event and extreme boundary condition, is going to be developed and collected by ENEA. This source term data, as radiological release, could be input for atmospheric dispersion codes. This source term database coupled with atmospheric dispersion code could be used for Italian emergency preparedness strategy for planning of response activity and possible prevention in order to minimize damage in the event of potential contamination of Italian territory if a severe accident takes place in the NPPs at Italian border.
In parallel another generic PWR-900 three loop nodalization has been developed along the Code for European Severe Accident Management (CESAM) European Project [28,29] considering the information’s distributed by IRSN during project [30, 31]. The prediction of the MELCOR input-deck has been compared with ASTEC and MAAP predictions in relation to an unmitigated SBO [32,33] and the results have been presented at the 2017 European MELCOR User Group (EMUG) [34]. These analyses shows an independent-user codes benchmark analyses that can be used also as a sort of confirmation of the MELCOR nodalization prediction capability developed by ENEA. Considering this first analysis, a further SBLOCA in CL analyses is in progress with MELCOR code and the current results are here presented.
2.1.1 Analysis of unmitigated SBLOCA transient
The phenomenology and timings characterizing a LOCA transient depend on the size, position and orientation of the rupture in the reactor coolant system. The transients selected for this analysis is initiated by a 2’’ break in the CL 1 of the Loop 1 (loop where the PRZ is located). If a transient progression, due to postulated event, is supposed unmitigated it could determine a drastic or even total degradation of core cooling capabilities with consequent partial or total core degradation considering the different availability of ECCS and the postulated concurrent malfunctions. The hypothesis of this transient is that only accumulators are in operation. The thermal-hydraulic and possible degradation phenomena are here investigated.
In the calculations performed, the rupture is set to occur at t = 0 and the plant is set to operate at full power condition during the steady state phase before the SOT [34]. As hypothesized, the break event is coupled with i) a Loss of offsite Alternating Current (AC) power, ii) a Failure of all the diesel generators. This determines that Pressurizer (PRZ) level control, RCP seal injection, active safety injection systems (HPIS and LPIS), Motor-driven Auxiliary Feedwater (MDAFW) system are unavailable. Further the following hypotheses are also considered:
a) Independent failure of the Turbine Driven Auxiliary Feedwater (TDAFW) pump (no AFW available);
b) No RCP seals failure;
c) No primary boundary structures thermal induced degradation phenomena (SGTR not considered, HL/surge line creep rupture not considered);
d) Primary and secondary side relief valves availability throughout the accident evolution. 2.1.2 Analyses of the transient progression
After reaching a stable steady state conditions (2000s of steady state analyses) comparable with the operational point of the reference reactor [34], SOT takes place. At the SOT, as hypothesized, the SCRAM and the consequent MSIVs/MFWs closure and the start of the pump coast-down are simulated by the code. The SCRAM of the reactor (0s after the SOT) determines that core power is in
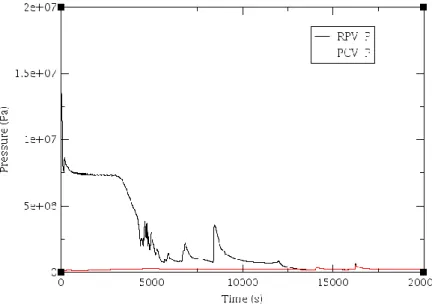
decay mode. The break opening determines a primary coolant blowdown to the containment through the simulated rupture and a depressurization of the primary system. A consequent expected containment pressure increase is predicted by the code. Figure 2.1 shows primary and containment pressure behaviour as a function of time predicted by MELCOR code.
Figure 2.1: Primary and containment pressure behavior predicted by MELCOR code.
It is to underline that primary pressure decrease is related to the break mass flow rate that in the plant is dependent from break area, position and orientation. Break position and orientation determine flow quality at the break. Fixed the break area, position and orientation in the code nodalization, break mass flow rate and the consequent primary pressure decrease is dependent also from the break modelling options, available to the code-user, as loss coefficient and flow discharge coefficients. The effect of all these parameters will be further investigated in future sensitivity analyses. A discharge coefficient of 0.9 is used for this analysis. As previously underlined, after the SOT the isolation of the SG takes place; in this phase of the transient part of residual core power is released through the break and part is removed by the three SGs with a consequent SG secondary side pressure increase. When the secondary side opening pressure set points are reached, the SGs start releasing steam to the outside atmosphere. Cycling phase inception is predicted by the code considering valve logics implemented in the MELCOR nodalization. Figure 2.2 shows SG1, SG2 and SG3 pressure versus time predicted by MELCOR code.
SGs remove part of the core power from the primary side, Figure 2.3, that it is in natural circulation regime; core and loops mass flow rate are reported in Figure 2.4. Single-phase natural circulation continues till void formation starts (two-phase natural circulation) in the primary side. In particular void formation start at about 70s in the HL of the loop 1 (where the break is located) and at about 88s in the HL of the loop 2 and 3. At about 5000s after the SOT SGs removing capability reduce drastically.
Figure 2.3: Total heat transfer between the primary to secondary predicted by MELCOR code.
Figure 2.4: Loop and core mass flow rate predicted by MELCOR code.
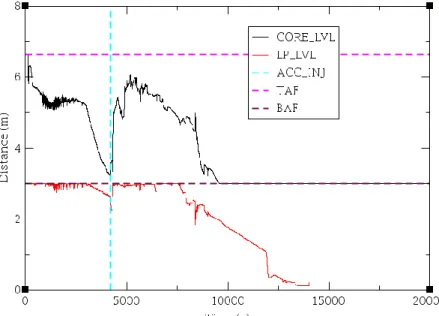
HPIS are not in operation, therefore no fed of cold borated water is available and the core level decrease as shown in figure 2.5. The water boil-off of the primary fluid causes a evaporation of the primary coolant fluid with a consequent fluid level decrease in the core; this determines a core uncovering process (TAF is uncovered) inception in the code calculations. The progressive water level decrease and the steam formation determines a decrease of the primary fluid cooling capability with a consequent decrease of the energy removed by fuel rods. A consequent increase of cladding temperature takes place. Since the energy removed from the primary coolant is less than the decay heat generated in the core a fuel cladding rods heat-up phase starts Figure 2.6. The steam formation determines the chemical reaction between the core material and the steam. In particular the oxidation
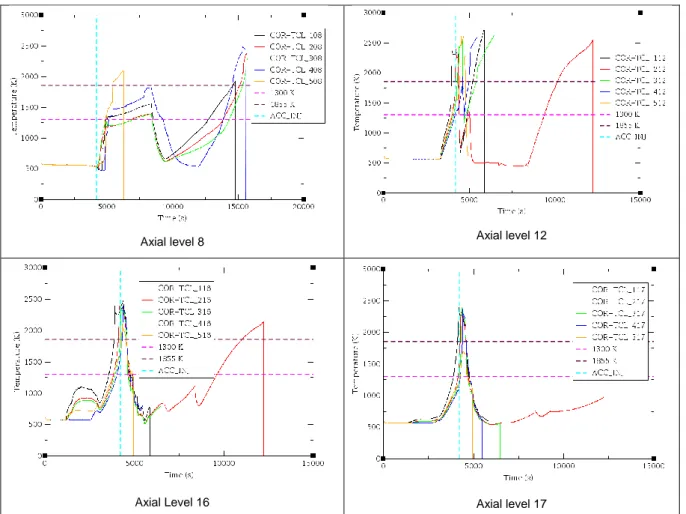
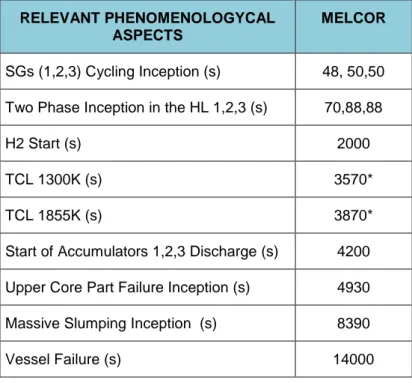
of Zircaloy is exothermic, therefore the energy released is coupled with the core residual power; this determines an acceleration of the core heat-up rate with a consequent temperature escalation; it starts the Hydrogen generation as well. The oxidation of the steel structure takes place as well but it is less significant than Zircaloy oxidation because the steel oxidation is less energetic and the area interacting with steam is less than Zircaloy area. A slightly Hydrogen generation starts at about 2000s as shown in Table 2.1. Cladding temperature reaches 1300 K at about 3570s and 1855 K at about 3870s (axial level 16 of the radial ring 1), Table 2.1. A sensible increase of the H2 generation, Figure 2.7, and in-vessel oxidation energy, Figure 2.8, is observed at about 3870s.
Figure 2.5: Core and lower plenum collapsed water level predicted by MELCOR code.
The core collapsed level decrease continue till the collapsed coolant level is partially restored (reflooding) through the coolant injected by the accumulators, which starts operating at about 4200s after the SOT in an intermittent way. The consequent core reflood starts, Figure 2.5. At about 4930s after the SOT the upper part of the core starts to fail in some cells. Figure 2.6 shows the evolution of the cladding temperature at different heights as a function of time.
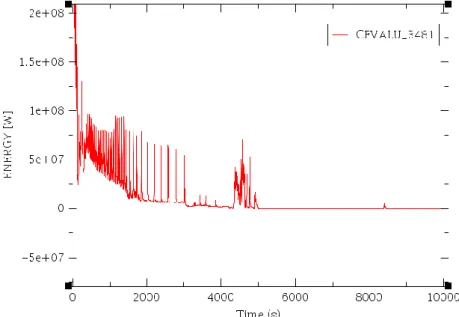
The materials with a lower melting temperature than fuel (as control rod, guide tube, grids…..) determine the starting of the melting and relocation phase of the core damage. Along the core degradation and melt progression phase, the cladding and fuel failure mechanisms and the consequent core materials transport/relocation take place. These phenomena determine a loss of core geometry with a consequent change of the coolant flow path shape. After a progressive core material relocation into the lower plenum (slumping), additional Hydrogen could be generated due to the oxidation phenomena. The Hydrogen generation and the the energy due to the oxidation are reported in Figure 2.7 and 2.8 respectively. The massive slumping inception takes place at about 8390 s after the SOT, Table 2.1. The relocation of the degraded core material in the lower plenum determines the lower head failure at about 14000s after the SOT.
Axial level 8 Axial level 12
Axial Level 16 Axial level 17
Figure 2.6: Cladding temperature at different core positions (radial ring 1,2,3,4,5; axial position 8, 12, 16, 17) predicted by MELCOR code.
Figure 2.7: Total Hydrogen mass producted by oxidation in the core predicted by MELCOR code.
Figure 2.8: Total oxidation energy generated in the core predicted by MELCOR code.
Table 2.1: Summary of the relevant phenomenological aspect sequence of events predicted by MELCOR code.
RELEVANT PHENOMENOLOGYCAL ASPECTS
MELCOR
SGs (1,2,3) Cycling Inception (s) 48, 50,50 Two Phase Inception in the HL 1,2,3 (s) 70,88,88
H2 Start (s) 2000
TCL 1300K (s) 3570*
TCL 1855K (s) 3870*
Start of Accumulators 1,2,3 Discharge (s) 4200 Upper Core Part Failure Inception (s) 4930 Massive Slumping Inception (s) 8390
Vessel Failure (s) 14000
2.2 Unmitigated Loss of Feedwater
The Loss of Feed Water (LFW) transient, has been simulated by the Università di Roma “La Sapienza”, considering a PWR 900 like MELCOR nodalization developed in the Accordo di Programma ENEA-MiSE [22]. The LFW transient has received particular attention in the PWR safety analysis due to the potential for RCS over-pressurization. LFW is a cause of a decrease of secondary system capability to remove heat generated in the reactor core. Without an auxiliary feed water available, due to the SG gradual dry-out, the core residual thermal power would heat the water in the primary system to the point where the SRV from the PRZ would open, resulting in a substantial loss of water from the RCS. Considering that the transient is unmitigated, the LPI and HPI are hypothesized not available, and the only water entering the core to compensate the loss of water coolant is that contained in the accumulators. The containment sprays are also hypothesized not available in this scenario.
State of the art operator severe accident management actions would be stopping the main coolant pumps and the SEBIM valves are opened by the operator action to avoid the over-pressurization, consequently, the core degradation occurs at low pressure due to the primary circuit depressurization via SEBIM valves; in this transient manual depressurization is considered.
This transient will be compared in future with a transient without the opening of SEBIM valves: in this transient the only valves in operation are the PRZ and steam line SRVs. In this comparative case our intention is to simulate the eventual rupture of SRVs to verify if this event is capable to depressurize the reactor and to guarantee a low pressure core degradation.
The initial and limit conditions of the scenario implemented in MELCOR are: HPI and LPI are unavailable;
Containment spray system is unavailable; At time = 0 s Main feed water loss;
At time = 0 s Auxiliary feed water unavailable;
At time = 0 s Chemical and volume control system loss; When the SG level =25% SCRAM;
At time = 1200 s Main coolant pumps stop; At time = 12000 s SEBIM valves open;
Isolation of accumulators when the pressure in the primary circuit is lower than 15bar.
2.2.1 Analysis of calculated data
After a MELCOR steady state analysis, in agreement with the full power operation values of the reference reactor, the LFW event takes place.
The loss of the main feed water, with the auxiliary feed water unavailable, lead to a dry-out in the SGs. When the level decreases to less than 25% in the SGs, the reactor scrams take place and also the turbine is isolated. The secondary system loses gradually the capability to remove the heat and, after more than one hour (during this time the reactor is into a subcritical condition) the primary circuit reaches the maximum allowable pressure and the PRZ SRVs open. The pressure in both systems, as shown in Figure 2.9, is anchored between the on/off range of the respective SRVs for the first 11000 s.
At 12000 s is hypothesized an operator action with the opening of SEBIM and the pressure in the primary circuit decreases. So when the pressure is lower than 43 bar, the accumulators start to discharge water. In this simulation, the vessel fail is predicted at 23100 s, after the depressurization of the primary circuit, and a sequence of core degradation is reported in Figure 2.10.
In the first phase the primary circuit is in a positive pressure trend, due to the complete absence of heat removal and, gradually, the temperature of water and fuel increase and the water reaches the saturation in the core zone. This phase ends with the SRVs opening; the decay heat produced is eliminated through the water mass flow rate ejected by valves. The practically continuous flow from the primary to the PRT (and after to the containment) causes a pressurizer water level decrease. 4000 s after the SOT the water level is moved in the fuel assemblies: this causes the start of massive clad
oxidation. The core melting transient shows the initial degradation (@7250 s) in the upper active part of the fuel rods, probably caused by the considerable time with no liquid water refrigerant (almost an hour). After 10000 s from SOT, a significative core degradation starts both in the central zone and in the peripherical fuel assemblies. The degradation process is similar for about an hour, and after the central core zones collapse into the lower grid. The lower core support grid maintains their function for another thousand of seconds. After, it fails, and the corium drops on the lower head. A molten pool is generated about 19000 s after the SOT, with an upper oxides layer. The molten pool causes a vessel fail (@21 300 s).
Figure 2.9: Pressure transient during LFW predicted by MELCOR code
At the rupture of the vessel, the fission products are released, first in the containment, and after, through the small leakage1, part of those are released in the atmosphere.
At almost 24000 s vessel is nearly completely empty and consequently Corium is poured in the reactor cavity.
1
The flow area of this leakage is practically zero for a containment pressure less than 3 barg, and after is considered proportional to the internal containment pressure further increment.
Figure 2.10: LFW Core degradation sequence predicted by MELCOR code FU CL PD MP1 MP2 Void SH FM PB MB1 MB2 SS NS OS HS H2O
3. BWR FUKUSHIMA DAIICHI UNIT I SEVERE ACCIDENT MODEL
3.1 Boiling Water Reactors NPP description
Boiling water reactor is characterized by a closed, direct steam cycle loop (Figure 3.1) using water as coolant and as moderator to control reactivity. The working fluid boils in the reactor core and drives turbines to generate electricity. The steam is then condensed, cooled by the condenser tubes, filled with water taken from a heat sink. The water is finally pumped back to the reactor building in the Reactor Pressure Vessel (RPV) as feed water.
Figure 3.1: BWR Plant [37]
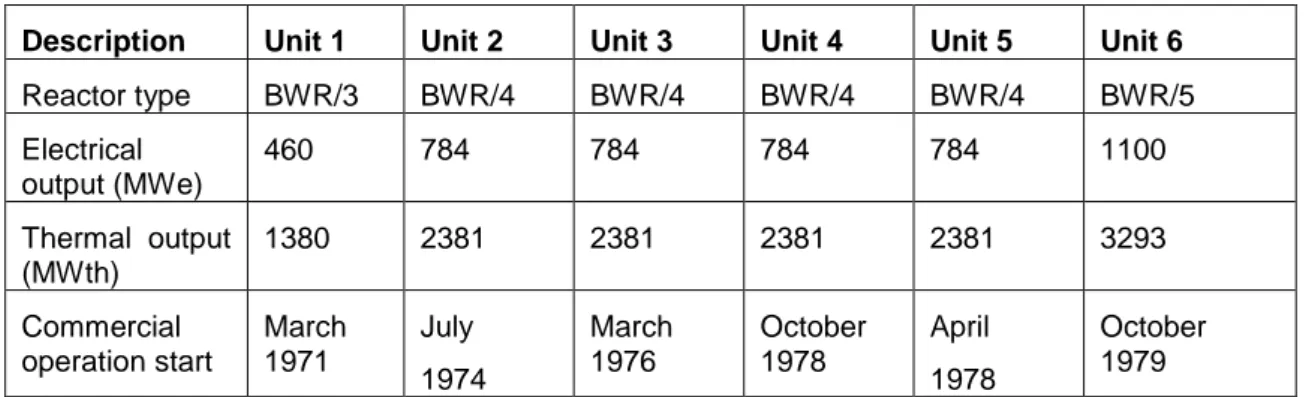
Fukushima Daiichi Nuclear Power Plant is composed by 6 units which cover the evolution of BWR technology during the 12 years from the construction of Unit 1 in 1967 until the complete operability of Unit 6 in 1979. After Unit 1, which was a BWR/3 design, Units 2-5 were BWR/4 while Unit 6 was a BWR/5 design.
Table 3.1: Fukushima Daiichi Nuclear Power Plant Specifications Description Unit 1 Unit 2 Unit 3 Unit 4 Unit 5 Unit 6
Reactor type BWR/3 BWR/4 BWR/4 BWR/4 BWR/4 BWR/5 Electrical output (MWe) 460 784 784 784 784 1100 Thermal output (MWth) 1380 2381 2381 2381 2381 3293 Commercial operation start March 1971 July 1974 March 1976 October 1978 April 1978 October 1979
The main differences between BWR types regard Recirculation Loops, Reactor Isolation Pressure and Inventory Control, Emergency Core Cooling Systems and Containment.
The containment of a BWR is a pressure suppression containment. It is composed by a wetwell, a drywell and a vent system.
3.1.1 The BWR MARK 1 Containment description
The containment of a BWR is a pressure suppression containment.
In particular the Mark I containment includes a building (drywell), where the Reactor Pressure Vessel (RPV) and primary system are located. They are connected to the water-filled suppression chamber (wet well) that can be cooled over long periods of time in order to maintain lower pressures and temperatures, guaranteeing its integrity. When this cooling method is lost, the wet well can be vented under controlled conditions by operator action to the atmosphere, where the suppression water pool filters out radioactive material before the release of gases by the vent.
The MARK 1 containment main characteristics are reported in [53].
Figure 3.2: Mark 1 containment [53]
3.2 BWR Main Emergency Systems
All BWRs have control rod drive systems that can be inserted to shut the reactor down. As a backup, there is also a standby liquid control system consisting of a neutron-absorbing water solution (borated) that can be injected to shut down the fission chain reaction.
This section analyses the main systems which occur during accidental situations, in particular those systems designed to operate during station blackout accident in high pressure conditions, such as the isolation condenser system (IC) (Fukushima Unit 1) and the reactor core isolation cooling (RCIC) (Fukushima Unit 2-6).
3.2.1 High Pressure Heat Removal System – Isolation Condenser system
BWR/3s are equipped with two isolation condenser systems that remove the decay heat by condensing the generated steam in the RPV through heat exchange with a water pool outside the drywell. The condensate returns in the reactor over a wide range of reactor pressures. However, no additional water is added, so if there are leaks in the primary pressure circuit, additional water is required from other sources.
The isolation condenser system is composed by two separate and independent loops, Train A and Train B. After the reactor isolation from the main turbine line, the IC receives steam generated in the reactor and condenses it by cooling inside heat exchanger tubes immersed in a cold water tank (one for each train) located beyond the primary containment. The condensed steam is then sent back to the RPV forced by gravity, while the evaporated steam, generated by cooling the primary water in isolation condenser pools, is vented to the atmosphere. The IC has a capacity of eight hours of cooling before requiring cold water tank refilling, which can be provided from fire water systems or other available water sources.
Figure 3.3: Isolation Condense scheme [41]
As shown in figure, the valves inside and outside the containment (inboard and outboard respectively) on the steam lines (1 and 2) are normally kept open, as the inboard valves MO-4 on the condensate lines. The outboard valves on the condensate lines are instead closed during normal operation; this allows the condensate line to be kept filled in the ready state and avoids the potential of water hammer during start-up. When the “high pressure signal” is given (7.23 MPa in Fukushima Daiichi Unit 1), the RPV is isolated from turbine and condensate return valves are opened enabling operation of IC. The intervention of inboard steam and condensate return valves are ensured by AC power, while outboard valves of steam supply and condensate return are DC powered; both outboard and inboard valves fail “as-is” to loss of actuation power.
3.2.2 High Pressure Heat Removal System – Reactor Core Isolation Cooling System
BWR/4s and BWR/5s use a Reactor Core Isolation Cooling system (RCIC), which is a single train system required for safe shut down of the plant; this system is not a part of ECCS and doesn’t have a LOCA function.
It consists of a turbine-driven pump that can add water to the RPV over a wide range of reactor pressures. The RCIC system draws water from either a large pool inside the containment, the
suppression pool, or from a tank located outside the containment, the condensate storage tank (CST). The RCIC system has the advantage that it can provide significantly more water than needed to make up for decay heat–generated steam, but it does not remove the heat. When the reactor becomes isolated from the main turbine/condenser, that heat is transported to the suppression pool via SRVs that open and close to maintain the primary system pressure within safety limits. There is sufficient heat capacity in the suppression pool for many hours of decay heat storage before the heat must be removed from the containment using pumps and heat exchangers requiring electrical power. If this does not occur, the pressure and temperature in the containment will rise as time progresses.
The start and operation of the RCIC system is guaranteed without external alternating current (AC) power sources, since the turbine is driven by steam generated in the reactor core and all the valves are actuated by direct current (DC) from the nuclear power station batteries, except for the inboard isolation valve which is an AC operated (fail “as-is”) valve.
In the case of a Station Blackout (SBO) the reactor core cooling system may stop for different reasons:
The DC power for valves is unavailable;
The DC power for instrumentation has failed, causing the direct current operated valves to close; High Containment pressure, which causes the automatic stop of the RCIC turbine;
Inadequate pump net positive suction head, as a consequence of high suppression pool temperature.
Figure 3.4: Reactor Core Isolation Cooling (RCIC) scheme [41] 3.2.3 High Pressure Coolant Injection System
Fukushima Daiichi Units 1-5 reactors were equipped with High Pressure Coolant Injection System (HPCI). It is a safety system used to maintain the core coolant inventory and to depressurize the reactor vessel during accident scenario, allowing the emergency injection of low pressure ECCS (LPCI). The HPCI system is similar to the RCIC one, except that it operates in the range between reactor operating pressure and LPCI injection pressure with a flow about seven times greater, consequently it can also actuate as the backup to the non-safety related RCIC system.
Figure 3.5: High Pressure Coolant Injection (HPCI) scheme [41] 3.2.4 Emergency Spray Systems
Emergency spray systems can be divided into core spray systems and primary containment spray systems, both present in all the Fukushima Daiichi Units. The purpose of the core spray system (CS) is to provide make-up coolant from the suppression pool to the RPV, injecting water at low pressure through different spray spargers located above the core. The primary containment spray system is instead used to refrigerate and depressurize the suppression chamber and the drywell, driving water from the suppression pool or the CST to the dry containment or to the upper non-pool section of the suppression chamber. Usually there are two different trains, each one containing both the core and the containment spray system (respectively blue and red Figure 3.6).
Figure 3.6: Core and Primary Containment Spray scheme [41]
If these first backup systems are not sufficient, then ECCSs are provided to both add water to the RPV and to remove decay heat either from the RPV or from the containment. With one exception, all these systems require alternating-current (AC) power that is supplied either by the NPP normal AC distribution system or by emergency diesel generators (EDGs) if the normal supply is lost. The exception is that as part of the ECCSs in BWR/3s and BWR/4s, there is a high-pressure coolant injection (HPCI) system that is a turbine-driven pump that uses reactor steam and that has about seven times the capacity of the RCIC system and can add water over a wide range of reactor pressures.
3.2.5 Overpressure Protection and Automatic Depressurization System
The overpressure protection and automatic depressurization (ADS) of the reactor pressure vessel in all Fukushima Daiichi NPPs are provided by safety relief valves (SRVs), which are connected to the four steam lines. In particular, Units 1-3 had 3 safety valves (SVs) discharging steam to the drywell in addition to the SRVs (4 for Unit 1 and 8 SRVs in Units 2-3), which discharged to the suppression chamber (SC); Units 4-5 and Unit 6 had respectively 11 and 18 SRVs driving steam to the SC.
The overpressure protection is achieved by the continuous SRVs opening and closing at a pre-set high and low RPV pressure. The relief function, which operates at a lower pressure than the safety one, is guaranteed by nitrogen pressure, while the safety function has spring force as drive source. The ADS is designed to reduce the reactor pressure to allow low pressure ECCS to operate in case of high pressure injection failure; after a low reactor water level or high primary containment vessel pressure signal, ADS control system drives nitrogen gas from external accumulator into SRV cylinders, providing drive force for SRVs opening and permitting a rapid depressurization.
Figure 3.7: Safety Relief Valves scheme [41] 3.2.6 Containment venting system
The primary containment vessel (PCV) encloses the reactor pressure vessel, other primary components and piping. In the highly unlikely event of an accident, this shielding prevents the release of radioactive substances. The purpose of the containment venting system is consequently to avoid overpressure in the PCV in order to protect and maintain the integrity of the containment preventing the possibility of a direct and uncontrolled release of radioactivity to the environment. For example, after the failure of a reactor’s emergency core cooling system, steam buildup in the containment can raise temperatures and pressures above design levels which, if unvented, could result in containment leakage or failure and uncontrolled releases of hydrogen and radioactive material into the reactor building and from there into the environment.
Vent paths include a train from drywell and a main one from the suppression chamber, in order to avoid high radioisotopes concentration in the water pool.
To vent a BWR reactor, operators must open motor-operated and air-operated valves. Motor-operated valves are typically opened (or “lined up”) using either AC or DC power; they can also be opened manually if operators can physically access them. Air-operated valves can be opened using compressed air and DC power.
The containment venting system starts operating when the PCV pressure exceeds a pre-set activation pressure through rupture disks installed in venting lines; it is also possible to delay the venting by aligning different valves located in the containment venting control system.
Figure 3.8: Containment Venting scheme [41] 3.3 Reference accident description
The Great East Japan Earthquake hit the east coast of Japan at 14:46 on Friday 11 March 2011. As one of the largest recorded earthquakes, it caused several tsunami waves which affected a large area of Japanese coast. These events damaged residences, industrial establishments, including five NPPs (Higashidori, Onagawa, Fukushima Daiichi, Fukushima Daini and Tokai Daini), causing 15000 dead, 6000 injured and 2500 people still reported to be missing. This chapter analyzes the Fukushima Daiichi NPP configuration and the escalation of the accident and consequently mitigation actions in the Unit 1.
3.3.1 Fukushima Daiichi NPP site layout
The site was located 220 km north of Tokyo, on the Pacific coast of Fukushima Prefecture.
Before the construction of the NPP, the site elevation was about 35 m referring to the average sea level at Onahama port (“OP” level); consequently, a great excavation plan was necessary, as shown in Figure 3.10.
Figure 3.10: Cross section of the Fukushima Daiichi construction site [58]
The plant and building of Units 1-4 were built at an elevation of 10 m, in order to provide an acceptable and stable bedrock foundation. Considerations and security features against tsunami were present in the Establishment Permit (EP), the Japanese equivalent of the safety analysis report. Tsunami events were considered in the tidal water level for plant design, influencing NPP’s project and construction. At the beginning the design basis tide level was OP +3.122 m, and referring to this value the Nuclear Power Plant was projected. This initial EP design value was re-evaluated several times during years, whose countermeasures are summarized in the following table.
Table 3.2: Fukushima Daiichi Tide Level’s evaluation [37]
Year Tsunami height evaluation Countermeasure
1996 Establishment permit OP +3.122m (observed height resulting from Chilean tsunami in 1960)
- 2002 Japan Society of Civil Engineers (JSCE) assessment
method. OP +5.7m
Raise elevation of pumps Make buildings watertight 2007 Disaster Prevention Plan by Ibaraki Prefecture Government
approx. OP 4.7m
Unnecessary 2007 Disaster Prevention Plan by Fukushima Prefecture
Government approx. OP 4.7m
Unnecessary 2009 Latest bathymetric and tidal data on the basis of the JSCE
assessment method. OP +6.1 m
Raise elevation of pumps
After the last evaluation in 2009 the NPP could face a tide water level of OP +6.1 m (lower than the 14 m tsunami wave occurred during the accident).
At the end of construction works, the Nuclear Power Plant had six different reactors, two of which, Unit 5 and 6, were separated from the other four. Following a simplified plan of Fukushima Daiichi NPP, Figure 3.11 [39].
Figure 3.11: Layout of Fukushima Daiichi NPP [39]
3.3.2 The accident
On March 11 2011, at 14:46, the Great East Japan Earthquake and its consequences caused an extreme situation which carried to the severe nuclear accident at Fukushima Daiichi Nuclear Power Plant, owned by the electric company TEPCO (Tokyo Electric Power Company). When the accident occurred the Unit 1, 2 and 3 were in normal operation, while Units 4 to 6 were stopped, under periodical inspections. After the beginning of the earthquake, SCRAM (emergency shut-down system) was immediately provided in all operating Units. However, the earthquake damaged the electricity transmission system between the NPP and external facilities, causing the total loss of off-site electricity (Station Black Out-SBO). From this point Emergency Core Cooling Systems started operating through emergency diesel generators, providing heath removal from nuclear reactors. The tsunami generated by the earthquake flooded in the NPP’s site, making totally unavailable the seawater pumps, diesel generators and the DC powered facilities, projected, with all the other systems, to face a design basis tide water level of 6.1 m; in particular, Units 1, 2 and 4 lost all power, while Unit 3 only AC power, and later on March 13 lost direct current.
The damages of the tsunami were not only to power supplies, but also to buildings, machineries and equipment installations, causing an extremely difficult access and movement within the plant, precluding the immediate and continuous injection of water through alternative systems.
3.3.3 Sequence of events at Fukushima Daiichi Unit 1
At 14:47 of 11 March 2011, after the earthquake, acceleration sensors initiated the automatic reactor scram. Emergency Diesel Generators (EDGs) started automatically at 14:48 in response of loss of all off-site power, restoring AC power.
Meanwhile the RPV was isolated through the closing of Main Steam Line Isolation Valves (MSIVs). Consequently, the reactor pressure increased due to the continuous steam generation, until both loops of the isolation condenser system automatically started. The IC is designed to have capacities to remove decay heat by heat exchange at 5 minutes after the scram by its one subsystem. Therefore, under the current operation conditions (longer than 5 minutes after the SCRAM and simultaneous operation of two subsystem), more decay heat is removed that necessary. The operation of both isolation condenser loops lowered the reactor pressure and temperature so rapidly that the operators manually stopped them, in accordance with procedures, in order to prevent thermal stress on the reactor pressure vessel. Afterwards, only one of the loops was used by the operators to control the cooling rate in a range prescribed by the procedures. The reactor pressure was controlled by manually repeating the start-up and shutdown of the IC subsystem-A.
It should be noted that the IC automatic start-up pressure is set lower than the lowest SRV activation pressure, therefore the reactor coolant inventory in the reactor doesn’t decrease, as long as the IC is in operation.
Maneuvering actions such as the starting up of the suppression chamber (S/C) in the cooling mode of the containment cooling system (CCS) were also being taken in parallel for cold shutdown of the reactor.
At 15:36 a tsunami wave 14 m high reached the site, flooding the plant and damaging EDGs located in the basements of the Turbine Building (TB) and the Control Building (CB), causing the total loss of AC power at 15:38 Station Blackout-SBO).
All coolant capabilities were lost and all displays of monitoring instruments and various display lamps in the Main Control Room went out due to the station black out caused by tsunami.
Approximately from 16:42 to 17:00 of 11 March 2011, part of the DC power supplies was temporarily recovered.
Concerned about the water inventory left in the IC shell side tank, at 18:25 the operators closed the isolation valve outside the containment on the return pipe. Post-accident surveys of the water in the IC shell side tank revealed that the water level indicator of subsystem-A had been 65% (normal level is 80%) and water in the tank had been sufficient. If the isolation valve had not been closed at 18:25 on March 11 ractor cooling by the IC might have been continued.
Local measurements (in the reactor building) at 20:07 indicated that the reactor was still near the operating pressure of 70 bar (7 MPa), which prevented water injection by alternative methods that would only be possible below 8 bar (0.8 MPa).
Meanwhile, the reactor pressure became low enough to allow alternative water injection. An alternative cooling method, that is, freshwater injection from the fire engines into the Unit 1 reactor to restore core cooling, started at 04:00 on 12 March, about 12.5 hours after the station blackout. Water injection from a single one-tonne truck continued intermittently for approximately 5.5 hours with the truck having to return to the freshwater tank periodically to be refilled. At the same time, work on establishing a direct line from the tank continued. Later, just over 17.5 hours after the station blackout, continuous freshwater injection into Unit 1 started directly from the tank.
The measurement of Unit 1’s containment pressure at 04:19 on 12 March showed that pressure in the containment had decreased since the last measurement (at 02:45) without any operator action and without an established vent path, indicating that some unintentional containment pressure relief had occurred through an unknown path. Furthermore, the radiation levels measured at the main gate
shortly afterwards showed an increase. This was also an indication of some uncontrolled radioactive release from the primary containment.
Because of the higher pressure in the reactor system the suppression pool was vented out (as per picture g of Figure 3.13). The venting was started too late and the atmosphere within the containment reached a too high hydrogen gas concentration. This caused at 15:36 on March 12, the explosion of the reactor building allowing radioactive materials to be released into the environment (as per picture h of Figure 3.13). Less than an hour after the explosion, radiation dose along the site boundary had reached 1.015 μSv/hr. Later, on March 12, the operators started to inject seawater into the reactor through the core spray system in order to cool the reactor; boron was then added to the water to control the reactor criticality.
This situation continued over the next several days as site personnel attempted to restore electrical power to the unit (as per picture i of Figure 3.13). Off-site power was restored to Unit 1 on March 20, nine days after the event.
Figure 3.13: Fukushima Daiichi Unit 1 - accidental sequence. 3.4 MELCOR 2.1 model developing
This section analyzes the Fukushima Daiichi Unit 1 MELCOR model. The nodalization has been updated in comparison with the input-deck presentend in the previuos years report [66] [17].
3.4.1 MELCOR nodalization approach
In order to develop the Fukushima unit 1 MELCOR nodalization [50], following the SANDIA approach reported in the Fukushima Daiichi Accident Study (SAND2012-6173) [47], the nodalization has been based on the Peach Bottom reactor (different power but similar reactor). The references used to develop the BWR Peach Bottom nodalization are [50] and [49].
Starting from this model, the Fukushima Daiichi Unit 1 input was built with the data reported in [59] and applying a reasonable scaling factor for each component, as pointed out in the following table, if the data are not available.
Table 3.3: Peach Bottom and Fukushima Daiichi 1 Power Plants specifications
DATA UM Peach Bottom Fukushima Daiichi 1
BWR type - BWR4-MARK1 BWR3-MARK1
Thermal output MW 3514 1380 R inner vessel m 3.2 2.4 RPV wall thickness m 0.164 0.16 RPV lower head thickness m 0.21 0.2 Heigh vessel m 22.2 20
Radius lower head m 3.188 2.391
Length FAs m 4.35 4.35
Active length m 3.66 3.66
NS mass kg 33866 17730 2
UPPER PLATE mass kg 24144 12640
SS mass kg 46000
CORE PLATE mass kg 14998 7852 2
CR housing mass kg 12041 6304 2 CRGTs mass kg 30000 CRs mass kg 9722.205 5090 3 Zircaloy mass kg 61700 32330 Steel mass kg 121180 63500 Poison mass kg 1785 935
Table 3.4: Unit 1, Fuel information [59]
Reactor core
Length of active fuel 366 mm
Hydraulic equivalent diameter 3.44 m
Total amount of uranium 68 t
Steam flow rate 2400 t/h
Core temperature 558 K
Averaged uranium enrichment
STEP2 (8x8): 3.4 9x9: 3.6 wt% Burnup (STEP2)-Averaged 39.5 GWD/t Burnup (9x9)-Averaged 45.0 GWD/t Fuel (STEP2) Diameter of pellet 10.4 mm
Outer diameter of cladding tube 12.3 mm Thickness of cladding (zirconium liner) 0.86(0.1) mm
Fuel assembly (STEP2)
Number of FA 68 mm
Number of fuel rod in one FA 8x8 – 4 (water rod) - Material of channel box Zircaloy-4 - Fuel (9x9) Diameter of pellet 9.4 mm
Outer diameter of cladding tube 11 mm Thickness of cladding (zirconium liner) 0.70(0.1) mm
Fuel assembly
Number of FA 332 -
Number of fuel rod in one FA 9x9 – 9 (water channel) - Material of channel box Zircaloy-4 - Control blade Control material B4C -
Configuration Cross shape -
Number of control blade 97 -
Pitch 305 mm
3.4.2 CORE Model
The core geometry was slightly modified compared to the previous one, in particular the lower plenum nodalization has been modified.
Moreover, following the MELCOR best practices [51] the thickness of the gas gap between fuel pellets and cladding to simulate fuel swelling.
The core axial and radial division is necessary to define different “Core cells” in which the code requires to specify masses of fuel (UO2), supporting structures (SS), non-supporting structures (NS) and related adjacent core channel and core bypass control volumes. Core cells individuate exclusively volumes related with the lower plenum and inside the core shroud. It is important also to underline that bottom of RPV has been taken as the reference level.
3.4.2.1 Axial Division
The axial core division can be done by splitting into two different regions, one below the bottom of active fuel (BAF) and one above (top of active fuel, TAF).
The first one (see table 3.5: MELCOR CORE Nodalization) has been divided into 13 levels, and differently from the previous report [17] the transition from spherical to cylindrical vessel shape has been set at +2.76585 m.
The division of the active core region is based on the reference [59], which calculates average axial and radial peaking factors that must be inserted in cells containing fuels. Consequently following the reference, in order to use verified power peaking factors, the active core region has been divided into 10 levels, from the Bottom of active fuel (BAF), deduced by the top of active fuel (+9.1543 [17]) minus the active fuel length (3.66 m [59]), to the top of the core (assumed 0.5 m above TAF). It is important to notice that the last axial level does not contain fuel and consequently its axial peaking factor has been set equal to zero.
Table 3.5: MELCOR CORE Nodalization
Number Bottom of the Level Level thickness Axial peaking factor
1 0.0 0.25908 0 2 0.25908 0.25908 0 3 0.51816 0.25908 0 4 0.77724 0.25908 0 5 1.03632 0.25908 0 6 1.2954 0.49015 0 7 1.78555 0.6145 0 8 2.4 0.36585 0 9 2.76585 0.49015 0 10 3.256 0.49015 0 11 3.74615 0.49015 0 12 4.2363 0.49015 0 13 4.72645 0.49015 0 14 5.2166 0.2777 0 15 5.4943 0.4575 0.705882353 16 5.9518 0.4575 1.103562552 17 6.4093 0.4575 1.088649544 18 6.8668 0.4575 1.082021541 19 7.3243 0.4575 1.08533554 20 7.7818 0.4575 1.08699254 21 8.2393 0.4575 1.06876553 22 8.6968 0.4575 0.77879039 23 9.1543 0.51 0.0
Figure 3.14: Axial relative power factor
3.4.2.2 Radial Division
The radial division is based on the reference [63], which provides radial peaking factors of core radial sections identified by the number of FAs contained, but without providing any information about dimensions. Consequently, since MELCOR requires radius of the radial rings division, an equivalent diameter of the total area of FAs associated with one peaking factor has been determined. The square lengths of channel boxes are unknown, consequently Peach Bottom channel box dimensions are assumed both for 8x8 and 9x9 FAs.
Table 3.6: MELCOR Radial Nodalization
Number of FAs Total Area of FAs Outer Radius Peaking Factor
Radial Ring 1 100 2,884775 0.884 0.35 Radial Ring 2 100 6,046625 1.25 0.3 Radial Ring 3 100 9,395525 1.531 0.225 Radial Ring 4 100 12,74443 1.768 0.125 Radial Ring 5 0 0 1.972 0 Radial Ring 6 0 0 2.4 0
An equal distribution of material in the active part has been set.
The 5th radial ring simulates the outer bypass region, the annular region between the active core and the internal surface of the core shroud, while the 6th radial ring simulates the downcomer region. In these two regions there aren’t fuel rod, but only refrigerant. So this portion of the core, has a strong discontinuity with respect to the most inner rings, where there are the fuel rods, the coating material of the fingers and other structural materials. The outer radius of the Fukushima reactor (2.4 m) has also been used to estimate the thickness of the cylindrical wall and the hemispherical shell of the vessel (data not reported in the references). Starting from the thickness of the reference reactor, and using the correlation of Mariotte has been estimated, for example, a thickness value of the hemispherical shell of the vessel of 0.165 m instead of 0.22 m. This parameter has a great importance both in terms of heat exchange (as the thickness increases, clearly increases the thermal resistance), both for the influence that would have on a possible resistance to breaking in incidental simulations.
Figure 3.15: BWR-3 Lower Plenum [20]
The 3D vision of the model is the one below.
Figure 3.16: Fukushima Unit 1 Axial & Radial Core Nodalization (made with SNAP)
According to MELCOR best practices the porosity of particulate debris has been changed from 0.3 to 0.4. The same value has been chosen for all core cells.
Actually, for the velocity of the falling debris a value of 0.1 m/s has been chosen, since, analyzing outputs, it represented the most conservative situation, carrying to a bigger amount of RPV ejected material than other inputs.
The SS failure model selected is the “Stress Based”, inserting SS number and inner/outer diameter.
Particular attention was dedicated to the modeling of lower head of the core. The detailed nodalization of the lower part of the core, allowed to optimally simulate the spherical head profile behavior. The default heat transfer coefficients are used in the current model, they are order-of-magnitude parameters that should be varied in sensitivity studies to determine their impact on lower head heat transfer and failure. The default failure temperature (1273.15 K) is instead an approximate value for the transition to plastic behavior for steel. This temperature value is then considered with the structure thickness and load to evaluate its failure. However, since BWR penetrations are thinner than LH, the debris ejection preferably occurs through penetrations open areas.
3.4.3 Thermal hydraulic model
Differently from the previous report [17] a new thermal hydraulic nodalization has been implemented.
In particular, the control volumes adjacent to core cells have been splitted in order to better simulate local heat transfer process for a wide range of fluid conditions and structure surface temperatures. Core nodalization is always much finer than the CVH nodalization, each hydrodynamic volume contains two core cells. In earlier versions of MELCOR, limitations in several models made it difficult to perform calculations using a fine CVH nodalization with one control volume for each core cell or each small number of core cells. MELCOR 1.8.4 or later versions of the code include improvements in the dT/dz model and incorporates a core flow blockage model (in the FL package). These make such calculations more practical, although some penalty in terms of increased CPU time requirements should still be expected.
The MELCOR nodalization was designed to have a reasonable computational time and a realistic prediction of the phenomena involved during the transient assuring a reliable and accurate transient simulation.
A new hydrodynamic nodalization scheme has been also modeled to simulate the two recirculation loops with two equivalent jet pumps.
The new RPV MELCOR nodalization, made by using SNAP and shown in Figure 3.18, comprises the lower plenum, the core, the core bypass, the upper core plenum, the standpipes, the steam separator, the steam dome, the upper downcomer, the middle downcomer, the lower downcomer and the steam line. The 2 external recirculation loops are modelled separately, while the jet pumps are modeled with two equivalent jet pumps.
The FL are critical for simulating severe accidents. Several studies, have found that the most likely channels of the radioactive material from the core output are three:
The first follows the rupture of the upper part of the wetwell caused by an over-pressure. Therefore, it was created a flow path that, once it reaches a pressure of 1.2 MPa in the wetwell, varies its outflow area from 0 (closed junction) to 0.1 m2, permitting a positive net flow towards the torus room.
The second output channel carries material from the upper part of the drywell to CVH Refueling bay. The mechanism responsible for this transport of matter is brought back to the damage to the seals, due to the combined action of high temperature and high pressure. Exceeded a threshold temperature, equal to 644 K, the flow path becomes activated, simulating a permanent damage to the seals. At that point, the area value of efflux depends on the internal-external pressure differential. Up to 0.565 MPa, the air outflow remains equal to zero, then increasing progressively and reaching to 0.04 m2 to 1,378 MPa.
A third mechanism of escape of material from the core is considered the damage of drywell liner. It can take place by melting of the liner or creep due to high temperature. It occurs at the base of the drywell, next to the cavity. This failure mode has not been implemented for the large uncertainties on the physical process.
Figure 3.17: Fukushima Unit 1 - Thermal Hydraulic model (made with SNAP)
3.4.3.1 Main Thermal hydraulic data [56]
Each of the two recirculation pumps elaborates a flow rate of 1555 kg/s with an head of 103.6 m, discharging water in 20 internal jet pumps (modeled with two equivalent FL). Jet pumps particular shape drags other water from the annular region between core shroud and RPV inner surface (downcomer), providing the necessary total coolant flow rate of 6056 kg/s. Steam generated in the active core region passes through static phase separators, steam separators first and steam dryers then, guaranteeing a steam quality of about 100%. Steam exits from RPV to main turbine through four steam lines with a nominal mass flow rate of 689 kg/s.
Figure 3.18: Recirculation loops and jet pumps model (made with SNAP)
To obtain the suction of the dragged flow the input momentum flux record has been activated in the two flow paths connecting the upper parts of jet pumps CV to the lower ones, which simulate respectively the nozzle and diffusion regions. This record requires downstream and upstream areas through which the moment flux equation is resolved.
3.4.3.2 Safety valves
The SRVs, located on a steam header attached to the main steam lines leaving the reactor vessel, vent steam from the reactor vessel into the wetwell. The SRVs have different opening and closing pressures; they open automatically when the opening pressure is reached. They also close automatically when the closing pressure in the vessel is reached. The SRVs are distributed into three banks of four, and three SRVs each, respectively. The two remaining spring safety valves have an automatic opening pressure of 7.73 MPa. Consequently, the spring safety valves will only open at high pressures after all the SRVs are already open. The spring safety valves close at a low pressure of 7.260 MPa.
The SRVs can also be opened manually at a pressure below the automatic set point. ADS actuation automatically opens five SRVs that discharge symmetrically into and around the torus below the suppression pool water level [52].
The operation of SRVs can be modeled with an hysteric function, here follows an extract from the CF package guide:
Figure 3.19: SRV Hysteresis [43]
Table 3.7: Fukushima Daiichi SRVs set point [60]
Unit 1 Unit 2 Unit 3 Unit 4 Unit 5 Unit 6
No. of valves 4 8 8 11 11 18 Total capacity (t/h) 1.057 2.938 2.913 4.147 4.149 Relief: 6.532 Safety: 7.284 Relief function (MPa(g)) 7.27 (1) 7.44 (1) 7.44 (1) 7.44 (1) 7.44 (1) 7.37 (2) 7.34 (2) 7.51 (3) 7.51 (3) 7.51 (3) 7.51 (3) 7.44 (4) 7.41 (1) 7.58 (4) 7.58 (4) 7.58 (4) 7.58 (4) 7.51 (4) 7.58 (4) 7.64 (4) Safety function (MPa(g)) 7.64 (2) 7.64 (2) 7.64 (2) 7.64 (2) 7.64 (2) 7.78 (2) 7.71 (2) 7.71 (3) 7.71 (3) 7.71 (3) 7.71 (3) 8.10 (4) 7.78 (3) 7.78 (3) 7.78 (3) 7.78 (3) 8.16 (4) 8.55 (3) 8.55 (3) 8.23 (4) 8.30 (4)
Discharge place Suppression
pool Suppression pool Suppression pool Suppression pool Suppression pool Suppression pool
3.4.3.3 Drywell leaks
The logic hypothesized for the simulation of the drywell leakage area is based on the following table. The DW bolt strain dependence respect the DW pressure is considered in this mode.
This simple logic permits a sufficient agreement with the experimental data.
Table 3.8: Drywell leak area
DW pressure [Pa] Leak area [m2]
2.00E+05 0
6.00E+05 1.50E-06
9.00E+05 6.00E-04
1.38E+06 0.02
Moreover, to accomplish the presence of a step in the DW pressure, a rupture has been simulated in the drywell. When the pressure reaches 0.91 MPa a break with an area of 6.0E-04 opened the drywell volume towards refueling bay.
3.4.3.4 Pump Leakage
Mechanical seals were mounted on the primary loop recirculation pumps as a shaft seal. During normal operations, sealing water for the shaft seals provided from the control drive pumps prevents reactor water from leaking. When the external power supply was lost, control rod drive pumps were shut down and sealing water was lost, then the high pressure reactor water was discharged into the drywell.
In the old version of the input deck the pump seal leak was assumed to begin at 18000 s after SCRAM. Now this parameter has been changed, the water discharge begins 3100 s after the SCRAM operation, when the station black-out occurs. For each recirculation pump a 1.4E-4 m2 leakage area has been simulated.
3.4.3.5 Isolation Condenser model
The Unit 1 of Fukushima NPP have two ICs for removing the decay heat when the main isolation valve (MSIV) is closed and the main condenser is isolated. This passive system were originally designed to prevent over pressure in the RPV without activation of the SRV.
Figure 3.21: Isolation condenser circuit [55]
When the pressure is higher than 7.13 MPa the IC goes in operation and continues more than 15 seconds, while the SRV activation pressure is about 7.27 MPa.
Considering the heat removal capacity of the two ICs after the reactor scram, in order to avoid thermal stress due to cold water inflow in the RPV, the line valves opening is adjusted in order to have a temperature change of the RPV less than 55 °C/hr (operator manual states) [17]. For time a short step problem, a detailed nodalization (Figure 3.22) was implemented with five volumes and five junctions for each side, instead the one volume per side initial nodalization. With this nodalization, a time step of about 0.1 s is possible without any problem.
3.4.3.6 Water Injection through fire engines
During the transient, for the mitigation of the accident several injection of fresh water and seawater were carried out through dedicated fire engines. The injections mass flow rate trend versus time is reported in ref. [63] Attachment 1-5.
Figure 3.23: Water Injection through fire engines. [63]
If the entire flow rate shown in the previous figure was effectively discharged by fire engines into the Unit 1 reactor, the RPV would have been filled with water and the severe accident might be avoided. Consequently it seems unlikely that the entire volume of water discharged was sent to the reactor. There is the possibility that part of the discharged water was instead sent to other systems and equipment. Therefore TEPCO in a MAAP analysis of Fukushima Daiichi Unit 1 severe accident [62] assumed a smaller amount of water injected into the RPV than the discharged one.
Similar trend was assumed in this calculation; the values are reported in Table 3.9.
Table 3.9: Water Injection mass flow rate [63] Time [s] Mass flow rate [kg/s]
21840.0 0.0 21840.0 1.0 38340.0 1.0 38340.0 0.0 47640.0 0.0 47640.0 2.16 48240.0 2.16 48240.0 0.0 54000.0 0.0 54000.0 2.45 86820.0 2.45 86820.0 0.0 1.188E5 0.0 1.188E5 2.99
![Figure 1.2: Products released from SG SRVs predicted by MELCOR code for an unmitigated SBO in a generic PWR-900 like [19]](https://thumb-eu.123doks.com/thumbv2/123dokorg/5608088.68042/10.892.215.681.496.769/figure-products-released-srvs-predicted-melcor-unmitigated-generic.webp)
![Figure 1.3: Primary and secondary pressure bahavior predicted by MELCOR code for an unmtigated SBO in a generic PWR-900 like [19,20]](https://thumb-eu.123doks.com/thumbv2/123dokorg/5608088.68042/11.892.220.666.162.470/figure-primary-secondary-pressure-bahavior-predicted-melcor-unmtigated.webp)
![Figure 1.4: Collapsed coolant level behavior in the core and lower plenum region in a unmitigated double ended CL break [21,22]](https://thumb-eu.123doks.com/thumbv2/123dokorg/5608088.68042/12.892.218.679.164.502/figure-collapsed-coolant-behavior-plenum-region-unmitigated-double.webp)
![Figure 3.4: Reactor Core Isolation Cooling (RCIC) scheme [41] 3.2.3 High Pressure Coolant Injection System](https://thumb-eu.123doks.com/thumbv2/123dokorg/5608088.68042/25.892.160.726.555.962/figure-reactor-isolation-cooling-scheme-pressure-coolant-injection.webp)
