UNIVERSITA’ DEGLI STUDI DI ROMA
“TOR VERGATA”
FACOLTA’ DI SCIENZE MM.FF.NN.
DOTTORATO DI RICERCA IN
B OLOGIA CEL ULARE E MOLECOLARE
I
L
NE
XXI CICLO
W MOLECULAR DIAGNOSTIC AND
IMMUNOLOGICAL TOOLS FOR TUBERCULOSIS
RESEARCH
Teresa Chiacchio
A.A. 2008/2009
Docente Guida/Tutor: Prof. PIACENTINI/ Dott. GOLETTI
Coordinatore: Prof. CESARENI
Index
Abbreviations... 5
Abstract ... 7
Introduction ... 9
Diagnosis of TB ... 9
Active TB disease... 9
Latent TB infection ... 11
Pathogenesis of TB... 12
Impact of Treg on suppressing M. tuberculosis-specific response
... 14
Aims ... 15
Materials and methods... 16
First Part: New tools to detect active tuberculosis infection:
Mycobacterium tuberculosis DNA in soluble fraction of urine
specimens ... 16
Study population ... 16
Urine specimen preparation ... 16
DNA isolation ... 17
PCR primer design ... 17
PCR amplification and electrophoresis analysis ... 18
Second Part: New tools to detect latent tuberculosis infection:
evaluation of memory responses and new biomarkers in response to
RD1 antigens in TST
+subjects exposed to Mycobacterium
tuberculosis ... 19
Study population ... 19
TST... 19
Whole blood Assay (WBA) based on proteins at day 1 and day 7:
Effector and Memory response ... 20
Cytokine and chemokine determination... 20
Commercially available assay... 21
Statistical analysis ... 21
Third Part: Characterization of regulatory T-cells identified as
CD4
+CD25
highCD39
+in patients with active tuberculosis... 21
Study population ... 21
Isolation of peripheral blood mononuclear cells and cultures.... 22
Depletion of CD4
+CD25
+T-cells... 22
Antigen-specific response evaluation... 23
Phenotypic analysis ... 23
Statistical analysis ... 24
Results ... 25
First Part: New tools to detect active tuberculosis infection:
Mycobacterium tuberculosis DNA in soluble fraction of urine
specimens ... 25
Second Part: New tools to detect latent tuberculosis infection:
evaluation of memory responses and new biomarkers in response to
RD1 antigens in TST
+subjects exposed to Mycobacterium
tuberculosis ... 29
Characteristics of the population... 29
In vitro responses to PPD, RD1 proteins and QF at day 1 post-in
vitro stimulation ... 30
Memory Response to RD1 proteins ... 32
Cytokines different from IFN- that are induced by RD1 proteins
... 34
Third Part: Characterization of regulatory T-cells identified as
CD4
+CD25
highCD39
+in patients with active tuberculosis... 38
Epidemiological and demographic characteristics of the subjects
enrolled... 38
Phenotypic Analysis of Treg. ... 39
Characterization of CD39
+T-cells... 40
Ex-vivo and in vitro evaluation of CD4
Treg by different markers
in healthy donors and TB patients... 43
Cytokine analysis after RD1-specific stimulation... 45
Depletion of CD4
+CD25
+CD39
+T-cells from TB patients PBMC
increases responses to recall antigens. ... 45
Discussion... 48
First Part: New tools to detect active tuberculosis infection:
Mycobacterium tuberculosis DNA in soluble fraction of urine
specimens ... 48
Second Part: New tools to detect latent tuberculosis infection:
evaluation of memory responses and new biomarkers in response to
RD1 antigens in TST
+subjects exposed to Mycobacterium
tuberculosis ... 51
Third Part: Characterization of regulatory T-cells identified as
CD4
+CD25
highCD39
+in patients with active tuberculosis... 54
Abbreviations
AFB: acid fast bacilliAPC: antigen presenting cells BCG: bacillus Calmette-Guérin CFP: culture filtrate protein CMV: cytomegalovirus
ELISA: enzyme-linked immunosorbent assay ELISPOT: enzyme-linked immunospot assay ESAT: early secreted antigenic target
FoxP3: family transcriptional repressor p3 GITC: guanidine isothiocyanate
HIV: human immunodeficiency virus infection IFN: interferon
IGRAs: interferon-gamma release assays IL : interleukin
IP: inducible protein
LST: lymphocyte stimulation test LTBI: latent tuberculosis infection
MIP: macrophage inflammatory protein MoAb: monoclonal antibodies
NAA: nucleic acid amplification
NFAT: nuclear transcription factors of activated T-cells PBMC: peripheral blood mononuclear cells
PHA: phytohaemagglutinin PPD: purified protein derivative Pt: patient
QF: QuantiFERON-TB Gold in-tube RD: region of difference
ROC: receiver operator characteristic TB: tuberculosis
TGF: transforming growth factor Th: T helper
TNF: tumor necrosis factor Tr-DNA: transrenal DNA Treg: T regulatory cells TST: tuberculin skin test WBA: whole blood assay WBE: whole blood ELISA
Abstract
Tuberculosis (TB) remains one of the world’s leading causes of mortality due to a single infectious agent, with approximately 1.5 million deaths and 9.2 million new cases per year as estimated in 2006. It is assumed that about 5-10% of individuals infected with M. tuberculosis develop TB and the remaining 90-95% contain M. tuberculosis through their immune
systems, but have a latent tuberculosis infection (LTBI).
To effectively control TB, it is essential to detect individuals with LTBI and to reliably diagnose active TB.
Conventional TB diagnosis continues to rely on smear microscopy and culture that have several known limitations in terms of both speed and sensitivity that delay the diagnosis and, consequently, hold-up TB treatment and increase the spread of infection in the community.
M. tuberculosis infection remains widespread, but the disease is generally limited to the primary infection stage. Patients with an immune defect or impaired immunity are more prone to develop the disease. In LTBI, the host immune response is capable of controlling the infection by the release of chemokines and cytokines produced by T helper (Th) cells, critical for the outcome of the infection. Several cells of the immune system are involved in the control of TB, from the macrophages and dendritic cells, called antigen presenting cells (APC) to the T cells, CD4, CD8, T cells. Activation of these cells with excessive pro inflammatory responses can lead to tissue damage, with the need of mechanisms to counteract this, such as Th2 and T regulatory cells (Treg)-mediated responses. The optimal scenario would therefore seem to have balanced Th1, Th2 and Treg response, suited to the immune challenge. The balance between these types of response is reflected in the resultant host resistance against infection.
Therefore the aims of the thesis were to find new approaches for diagnosis of active TB (First Part) and LTBI (Second Part). In this workwe wanted to explore the immune mechanisms of TB pathogenesis with particular focus on the impact of Treg on suppressing M. tuberculosis-specific response (Third Part).
For the diagnosis of active TB, we describe an alternative PCR methodology based on the amplification of small DNA fragments, originated from cells dying throughout the body (transrenal DNA; Tr-DNA) and detected in urine. It was found that small M. tuberculosis DNA fragments were specifically detected in the cell-free fraction of urine specimens from pulmonary TB patients.
To detect LTBI, we compared the performances of two short-incubation interferon (IFN)- release assays (IGRAs), the commercial QuantiFERON TB-Gold and the in-house whole blood stimulation with region of difference (RD)-1 proteins, with those of a 7-day whole blood stimulation and tuberculin skin test (TST). In an effort to find new markers for LTBI diagnosis, we also evaluated the production of pro-inflammatory cytokines [interleukin (IL)-1, IL-2, IL-6 and Tumor Necrosis Factor (TNF)-], anti-inflammatory cytokines (IL-4, IL-10, IL-13) and chemokines [inducible protein (IP)-10, Macrophage Inflammatory Protein (MIP)-, MIP-1, IL-8] after specific stimulation. The results raise the hypothesis that short-incubation IGRAs mainly detect recent or ongoing infection with M. tuberculosis, while prolonged-incubation IGRAs seem to be more sensitive for the diagnosis of past latent infection. Moreover we found that IL-2 and IP-10 may be additional markers for TB infection after RD1 specific stimulation.
Finally we wanted to evaluate the impact of Treg on suppressing M. tuberculosis-specific response.
Using classical markers for Treg recognition, discordant results were found in terms of Treg expansion during active TB disease. Recently CD39 has been shown to be an accurate marker for Treg detection. Objectives of this part of the thesis were: 1) to identify Treg expressing CD39 in patients with TB and to compare the results with those obtained by the standard phenotypic markers; 2) to evaluate if Treg are expanded in vitro by exogenous IL-2 or by antigen-specific stimulation; 3) to characterize Treg function on the modulation of antigen-specific responses. In this study we demonstrated that CD39 is a useful marker to detect Treg because within CD4+CD25high cells, it identifies a cell subset characterized by high
production of transforming growth factor (TGF)-1 and the absence of IFN-expression. Moreover, we showed that CD39+ Treg are expanded by M.
Introduction
Tuberculosis (TB) remains one of the world’s leading causes of mortality due to a single infectious agent, with approximately 1.5 million deaths and 9.2 million new cases per year as estimated in 2006 [1]. It is estimated that worldwide one third of the human population is infected with the causative agent Mycobacterium tuberculosis and is therefore at risk of developing the disease. Once infected, active disease develops in about 5-10% of cases, usually within 1–2 years after exposure. Remaining individuals enter into a state of latentcy [latent tuberculosis infection (LTBI)], which can reactivate at a later stage, particularly if the individual becomes immunocompromised [2].
M. tuberculosis usually attacks the lungs (pulmonary TB) but can also affect the central nervous system, the lymphatic system, the circulatory system, the genitourinary system, the gastrointestinal system, bones, joints, and even the skin. Other mycobacteria such as Mycobacterium bovis, Mycobacterium africanum, Mycobacterium canetti, and Mycobacterium microti also cause TB, but these species are less common [3].
The classic symptoms of TB are a chronic cough with blood-tinged sputum, fever, night sweats, and weight loss. Infection of other organs causes a wide range of symptoms. The diagnosis relies on radiology (commonly chest X-rays), a tuberculin skin test (TST), blood tests, as well as microscopic examination and microbiological culture of bodily fluids. TB treatment is difficult and requires long courses of multiple antibiotics. Contacts are also screened and treated if necessary. Antibiotic resistance is a growing problem in multi-drug resistant TB. Prevention relies on screening programs and vaccination, usually with bacillus Calmette-Guérin (BCG) vaccine [3]. The distribution of TB is not uniform across the globe with about 80% of the population in many Asian and African countries testing positive in tuberculin tests, while only 5-10% of the US population testing positive [1].
Diagnosis of TB Active TB disease
Given the infectious nature of pulmonary TB, fast and accurate diagnosis is an important element for TB treatment and control.
TB control is based on the consequent use of preventive chemotherapy in individuals LTBI who are at risk of developing active disease and on the rapid diagnosis and effective treatment of infectious cases [4-6]. Conventional TB diagnosis continues to rely on smear microscopy, culture and chest radiography. These tests have several known limitations [7]: - rapid alcohol acid fast bacilli (AFB) detection can be performed on sputum smears, but diagnosis of infectious cases by sputum microscopy is only possible in approximately 50% of cases, both field and high technology-based laboratories [2]
- culture may require a long period up to 6–8 weeks for the final results - chest radiography is not available everywhere.
The sub-optimal performances of existing diagnostic tools in terms of both speed and sensitivity [8], delays diagnosis and, consequently, treatment of active TB.
For diagnosis of active TB tests are being developed that offer the hope of cheap, fast and more accurate TB testing. These include newer versions of nucleic acid amplification (NAA) tests, immune-based assays and rapid culture systems. Although the ideal test for TB is still not in sight, substantial progress has been made in the past decade [7].
NAA tests have emerged with the intended goal of enabling clinicians to make a rapid and accurate diagnosis. PCR is the best-known NAA test. All NAA tests amplify target nucleic acid regions that uniquely identify the M. tuberculosis complex. An important advantage of NAA tests is the rapidity by which the results can be obtained, about 3–6 h from receipt of specimen. Using PCR in pulmonary TB, specificity of diagnostic tests based on direct identification of M. tuberculosis in the sputum, generally exceeds 98% and sensitivity is also high in patients whose sputum smear is positive for acid-fast bacilli on microscopic examination. However, the sensitivity of such tests may be less than 50% for patients with negative sputum smear [9,10]. On the other hand, a highly sensitive molecular-based test for the detection of M. tuberculosis remains a goal of great importance for the control and eventual eradication of the disease worldwide.
Advances in knowledge of the genetic structure of tubercle bacillus have recently contributed to the development of several new molecular methods for detection and identification of M. tuberculosis from cultures or directly from biological specimens [9].
In an attempt to develop a more rapid, sensitive and reliable diagnostic test, some studies have been performed to evaluate the possibility of identifying the bacteria in the urine of patients with pulmonary TB by testing for the
presence of specific DNA sequences. This approach appears to be attractive because urine specimens are easier and safer to collect than sputum which can generate infectious aerosols and prove to be difficult to obtain especially in children.
Recently, Botezatu et al. [11] reported small cell-free DNA fragments (150 to 200 bp) in urine that originating from cells dying throughout the body. Since all evidence suggests that this DNA appears in the urine by crossing the renal barrier, it was named transrenal DNA (Tr-DNA) in order to differentiate these DNA fragments from those of high molecular weight that are known to be associated with urine sediment [12].
We report here the first demonstration that M. tuberculosis-specific DNA sequences detected as short fragments of less than 200 bp in the soluble fraction of urine specimens from patients with pulmonary TB. The evidence presented further demonstrates that these specific DNA fragments disappear following successful TB treatment.
Latent TB infection
Until recently, the only available assay for LTBI identification was TST. It is based on a delayed-type hypersensitivity response to purified protein derivative (PPD), a rough culture supernatant of M. tuberculosis and false-positive results can occur due to cross-reactive immune responses to homologous proteins in M. bovis BCG or environmental mycobacteria. Several immunodiagnostic assays, based on interferon (IFN)- release (IGRAs), have been developed for the diagnosis of M. tuberculosis infection. Their high specificity is based on the use of region of difference (RD)-1 gene products that are specific for M. tuberculosis [Early Secreted Antigenic Target (ESAT)-6 and Culture Filtrate Protein (CFP)-10] and which are absent in BCG and most environmental mycobacteria. This reagents’ specificity of IGRAs overcomes the problem of cross-reactive immune responses. The first demonstration of the performance of IGRA was described using in a 6-day lymphocyte stimulation test (LST) the IFN- response to ESAT-6 and CFP-10 [13-16]. Afterward other IGRAs were developed that differed from the classical LST with respect to the in vitro incubation period, the type of cells cultured (whole blood, frozen or fresh peripheral blood mononuclear cells [PBMCs]), and the way that the IFN- response is detected (by enzyme-linked immunosorbent assay [ELISA] or enzyme-linked immunospot assay [ELISPOT]).
The evaluation and comparison of new diagnostic assays for the detection of LTBI have been hampered by the lack of a “gold standard” and, therefore, the inability to reliably calculate their sensitivities and specificities. Most studies used the level of exposure as a surrogate marker for infection, and discrepancies between TST and IGRAs were mostly attributed to prior BCG vaccination [17-19]. However, data from recent studies [20-22] indicate that this explanation may not account for all discrepant results, as a substantial group of BCG-unvaccinated persons with TST indurations of >15 mm had negative results by commercially available IGRAs, the QuantiFERON-TB Gold in-tube (QF) test and/or the T-SPOT. TB test (Oxford Immunotec, Abingdon, United Kingdom) [23,24].
Moreover recently it has been shown that IFN-, inducible protein 10 (IP-10) and macrophage chemotactic protein 2 (MCP-2) can be considered as additional markers for LTBI detection after RD1-specific stimulation [21,22,25].
In the present study I further evaluated the latter observation by comparing the performances of two short-incubation IGRAs, the commercial QF and the in-house whole blood stimulation with RD1 proteins, with those of a 7-day whole blood stimulation and TST for the diagnosis of LTBI. Moreover in an effort to find new markers to detect LTBI I evaluated the production of pro-inflammatory cytokines [interleukin (IL)-1, IL-2, IL-6 and Tumor Necrosis Factor (TNF)-], anti-inflammatory cytokines (IL-4, IL-10, IL-13) and chemokines [IP-10, Macrophage Inflammatory Protein (MIP)-, MIP-1, IL-8) after specific stimulation.
Pathogenesis of TB
Mycobacterium tuberculosis is an obligatory aerobic, intracellular pathogen, which has a predilection for the lung tissue rich in oxygen supply. The tubercle bacilli enter the body via the respiratory route.
TB infection begins when the mycobacteria reach the pulmonary alveoli, where they invade and replicate within the endosomes of alveolar macrophages. The primary site of infection in the lungs is called the Ghon focus, and is generally located in either the upper part of the lower lobe, or the lower part of the upper lobe. Bacteria are picked up by dendritic cells, which do not allow replication, although these cells can transport the bacilli to local (mediastinal) lymph nodes. Further spread is through the bloodstream to other tissues and organs where secondary TB lesions can
develop in other parts of the lung (particularly the apex of the upper lobes), peripheral lymph nodes, kidneys, brain, and bone. All parts of the body can be affected by the disease, though it rarely affects the heart, skeletal muscles, pancreas and thyroid [3].
TB is classified as one of the granulomatous inflammatory conditions. Macrophages, T lymphocytes, B lymphocytes and fibroblasts are among the cells that aggregate to form a granuloma, with lymphocytes surrounding the infected macrophages. The granuloma functions not only to prevent dissemination of the mycobacteria, but also provides a local environment for communication of cells of the immune system. Within the granuloma, T lymphocytes (CD4+) secrete cytokines such as IFN-, which activates
macrophages to destroy the intracellular bacteria. T lymphocytes (CD8+) can
also directly kill infected cells [26].
Importantly, bacteria are not always eliminated within the granuloma, but can become dormant, resulting in a latent infection. Another feature of the granulomas of human TB is the development of cell death, also called necrosis, in the center of tubercles. To the naked eye this has the texture of soft white cheese and was termed caseous necrosis.
If M. tuberculosis bacteria gain entry to the bloodstream from an area of damaged tissue they spread through the body and set up many foci of infection, all appearing as tiny white tubercles in the tissues. This severe form of TB disease is most common in infants and the elderly and is called miliary TB. Patients with this disseminated TB have a fatality rate of approximately 20%, even with intensive treatment. In many patients the infection waxes and wanes. Tissue destruction and necrosis are balanced by healing and fibrosis. Affected tissue is replaced by scarring and cavities filled with cheese-like white necrotic material. During active disease, some of these cavities are joined to the air passages bronchi and this material can be coughed up. It contains living bacteria and can therefore pass on infection. Treatment with appropriate antibiotics kills bacteria and allows healing to take place. Upon cure, affected areas are eventually replaced by scar tissue [3].
About 90-95% of the people infected with M. tuberculosis have asymptomatic, latent TB infection, with only a 10% lifetime chance that a latent infection will progress to TB disease. However, if untreated, the death rate for these active TB cases is more than 50% [27].
Host immune responses are necessary to control M tuberculosis growth by the release of chemokines and cytokines produced by T helper (Th) cells.
Several cells of the immune system are involved in the control of TB, from the macrophages and dendritic cells, called antigen presenting cells (APC) to the T cells, CD4, CD8, cells. Activation of these cells with excessive pro inflammatory responses can lead to uncontrolled tissue damage, with the need of mechanisms to counteract this, such as Th2 and T regulatory cells (Treg)-mediated responses. The optimal scenario would therefore seem to be that humans should produce a well balanced Th1, Th2 and Treg response, suited to the immune challenge. The balance between these types of response is reflected in the resultant host resistance against infection. The mechanisms responsible for insufficient T cell-dependent protection M. tuberculosis infection remain unclear, but Treg may be involved.
Impact of Treg on suppressing M. tuberculosis-specific response
Treg play an important role in immune regulation to prevent autoimmunity diseases and to control the immune responses by down-regulating the function of effector CD4+ or CD8+ T-cells [28]. The role of
Treg in TB infection and persistence is inadequately documented. Therefore, the current study was designed to evaluate the impact of Treg on suppressing M. tuberculosis-specific response. The result of this study can be important to understand the pathogenesis of M. tuberculosis and potentially to find new tools for TB immune diagnosis that may overcome suppressed immune responses.
It is believed that Treg down-modulate immune responses after pathogen eradication to avoid exacerbated pathology. Although this mechanism is generally to the benefit of the host in acute infections, it poses problems in chronic infections, notably when pathogen persistence is sustained in the face of an active immune response.
Treg comprise multiple subsets: naturally occurring thymus-derived
CD4+CD25high T-cells, that have the ability of cell-contact dependent
suppression of immune response, and different subsets of adaptive Treg, such as Tr1 cells secreting high levels of IL-10, and Th3 cells which produce high levels of transforming growth factor (TGF)-1 [29,30]. It has been shown that several factors such IL-2, IL-10 and TGF- are involved in the generation and maintenance of Treg [31].
Natural Treg constitutively express CD25 [ chain of IL-2 receptor], they are identified as CD4 T-cells with high expression of CD25 and they have regulatory properties. This fact introduced certain difficulties and confusion
in distinguishing Treg from conventional non-regulatory activated CD4+CD25+ T-cells. At present, the intracellular forkhead winged-helix
family transcriptional repressor p3 (FoxP3) is described as the most specific marker of Treg. FoxP3 expression well correlates with regulatory activity, it is expressed in CD4+CD25+ Treg and is considered a key player for their
development and function [32]. FoxP3 represses IL-2, IL-4 and IFN- gene expression and interacts with nuclear transcription factors of activated T-cells (NF-kB, NFAT) resulting in poor cytokine production and impaired proliferation [33]. However, the FoxP3 marker is present also in activated T-cells [34]. Moreover, recent studies have shown that lack or low expression of CD127 (the chain of the IL-7 receptor), is linked with Treg identification similar to CD4+CD25+FoxP3+ T-cells [35]. Recently CD39, an
ectoenzyme that degrades ATP to AMP, has been shown to be specifically associated to Treg, as described in inflammatory autoimmune diseases [36]. Treg have been implicated in infectious diseases, particularly in chronic or persistent infections [29,37]. Discordant results were found ex vivo in terms of Treg expansion during active TB disease, some authors reporting an increase of CD4+CD25+FoxP3+ T-cells whereas others reporting absence of
modulation of this T-cell subset [28,38-41]. Thus, the objectives of this study were to: 1) identify Treg expressing CD39 in patients with TB and compare the results with those obtained by the standard phenotypic markers; 2) to evaluate if Treg can be expanded in vitro by exogenous IL-2 or by antigen-specific stimulation with RD-1 proteins; 3) to characterize Treg functions in the modulation of antigen-specific responses.
Aims
The aims of the thesis were to find new approaches for diagnosis of active TB (First Part) and LTBI (Second Part). Moreover, we wanted to explore the immune mechanisms of TB pathogenesis with particular focus on the impact of Treg on suppressing M. tuberculosis-specific response (Third Part).
Materials and methods
First Part: New tools to detect active tuberculosis infection:
Mycobacterium tuberculosis DNA in soluble fraction of urine specimens
Study population
All study participants were enrolled at the National Institute for Infectious Diseases (INMI) “L. Spallanzani”. In this study we included patients who had been diagnosed with pulmonary TB as confirmed by the tuberculin skin test and isolation of M. tuberculosis from sputum culture. Nineteen of the 20 patients had sputum smear positive for acid-fast bacilli, whereas, only one was HIV positive. No patient exhibited clinical evidence of extra-pulmonary involvement, and all urine cultures for M. tuberculosis performed were negative. Urine specimens were obtained either before or within one week of initiation of anti-TB therapy. Information regarding age, sex, ethnicity, M. bovis BCG vaccination, and results of laboratory examinations for TB were collected. In order to determine whether subsequent therapy had an influence on the ability to detect M. tuberculosis DNA, 8 of the patients with pulmonary TB were asked to return to donate urine specimens two months after initiating anti-TB therapy. In addition, ten healthy individuals were included as controls in the study.
This study was approved by the Institutional Review Board at INMI and all study participants gave written informed consent in accordance with applicable guidelines.
Urine
specimen preparation
Urine specimen preparation for Tr-DNA analysis was carried out at ambient temperature. Approximately 50-60 ml of urine was collected from each individual in the study. To minimize degradation of soluble DNA by nucleases that may be present in urine, 0.5M EDTA-0.5M Tris-HCl, pH 8.5, was added to a final concentration of 10 mM within 30 minutes of collection. The stabilized urine specimens were then stored in 5 ml aliquots at -80oC. In instances where it was necessary to separate the soluble urine
fraction from sediment, fresh specimens were centrifuged for 20 min at 4000xG and the supernatant and pellet stored separately at -800C.
DNA isolation
DNA isolation from urine was carried out according to the protocol developed in our laboratory [11,42] specifically developed to optimize isolation of small DNA fragments. Briefly, 2 volumes of 6 M guanidine isothiocyanate (GITC) were added to 5ml of un-fractionated urine or separately to supernatant and pellet fractions, and mixed vigorously. DNA was captured by Wizard Resin (Promega, Milano, Italy) and after extensive washing was eluted with water or 10 mM Tris-HCl, pH 7.5-1mM EDTA. In comparison with other techniques and commercially available kits this protocol was found to efficiently isolate low molecular weight DNA fragments (<200 bp).
PCR primer design
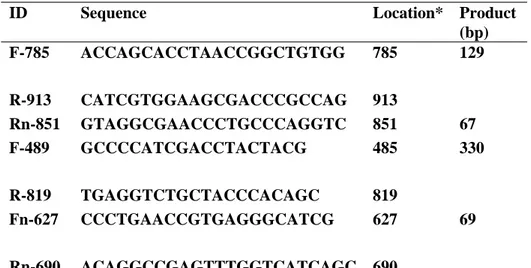
PCR primers for the detection of M. tuberculosis complex species DNA were selected for the region of IS6110 shown to be highly specific [43]. For primer design FastPCR software was used (see http://www.biocenter.helsinki.fi/bi/bare-1_html/oligos.htm). Nested primers were designed using Primer 3 package available online (see also http://frodo.wi.mit.edu/cgi-bin/primer3/primer3_www.cgi). All primers were screened against the complete sequence of human genome. Primers used in this study are presented in Table 1.
ID Sequence Location* Product (bp) F-785 ACCAGCACCTAACCGGCTGTGG 785 R-913 CATCGTGGAAGCGACCCGCCAG 913 129 Rn-851 GTAGGCGAACCCTGCCCAGGTC 851 67 F-489 GCCCCATCGACCTACTACG 485 R-819 TGAGGTCTGCTACCCACAGC 819 330 Fn-627 CCCTGAACCGTGAGGGCATCG 627 Rn-690 ACAGGCCGAGTTTGGTCATCAGC 690 69
Table 1: Design of primers employed in the study. (*) Nucleotide numbering is based on
the consensus created from the alignment of IS6110 elements nucleotide sequences.
PCR amplification and electrophoresis analysis
Twenty cycles of PCR amplification were performed as following: isolated DNA equivalent to that contained in 300 μl of urine was added to a 25 μl mixture containing 0.2 μmol/liter of outer primers F-785 and R-913, 5 μl 5X PCR buffer (Promega), 200 μmol/liter dNTP each, and 1 U GoTaq Polymerase (Promega), denatured at 94°C for 5 minutes followed by 20 cycles of 94°C for 30 seconds, 62°C for 30 seconds, 72°C for 1 minute, and 1 cycle of 72°C for 5 minutes. 1 μl of the product from this amplification was diluted 1:10 and 1 μl of the dilution was re-amplified 35 cycles using primers F-785 and Rn-851 under the same conditions as in the first reaction. Identical setting was used for the amplification of large, 330 bp fragment. The products from the second amplification were resolved by electrophoresis in 7% polyacrylamide gel, and visualized by ethidium bromide staining.
Second Part: New tools to detect latent tuberculosis infection: evaluation of memory responses and new biomarkers in response to RD1 antigens in TST+ subjects exposed to Mycobacterium tuberculosis
Study population
In a four-years period we enrolled in National Institute for Infectious Diseases (INMI) “L. Spallanzani” a heterogeneous group of persons with presumed recent or more remotely acquired latent TB infection: a group of close contacts of patients with a sputum culture positive for M. tuberculosis and a group of TST+ homeless known to have been exposed to M.
tuberculosis in the past sent to a screening for LTBI to the pneumology division of the National Institute for Infectious Disease “L. Spallanzani” in collaboration with the Institute of Hygiene, Catholic University, for a project of TB surveillance in Rome.
Participants underwent a TST on the day of blood sampling (see below). We included in the present analysis individuals who tested TST+ that provided a
written consent to the study. Individuals who were known to have human immunodeficiency virus infection (HIV-1) or who had received treatment with immunosuppressive drugs were not eligible for inclusion in the study. Upon enrolment demographic and epidemiological information were collected by the physician through a structured questionnaire, including information about BCG vaccination.
TST
TST was administered by the Mantoux procedure using 5 IU of PPD (Chiron, Siena, Italy). Results were read after 72 hours. Induration of at least 5 mm was considered a positive response for group of close contacts and a reaction 10mm was considered positive for homeless.
Whole blood Assay (WBA) based on proteins at day 1 and day 7: Effector and Memory response
Effector response
For detecting an effector response, 0.5 ml per well of heparinized whole blood was seeded in a 48-well plate and treated with PPD at 5 μg/ml (batch RT 47, Staten Serum Institut, Copenhagen, Denmark), RD1 intact proteins at 0.2 μg/ml (Lionex, Braunschweig, Germany) and Phytohaemagglutinin (PHA) at 5 μg/ml (Sigma, St Louis, MO, USA). Samples were then incubated for 24 hours. On day 1 the plasma was harvested and cold storaged until they were tested (+4°C or if used after 15 days at -20°C). Memory response
For detecting a whole blood memory response we used a previously reported methodology with some modification [44]. Briefly at the day of sampling an aliquot of blood was diluted 5-fold using RPMI 1640 supplemented with penicillin, streptomycin and 2mM L-glutamine and was plated into 48-well plates [44] and stimulated as above described. The day-7 diluted plasma was harvested following incubation at 37°C.
Cytokine and chemokine determination IFN-
IFN- results from day-1 and day-7 plasma were evaluated by a commercial ELISA (CMI, Cellestis Limited, Carnegie, Victoria, Australia) and are presented as IU/ml after subtraction of the appropriate control. Cut-off values were previously determined by constructing a Receiver Operator Characteristic (ROC) curve by means of LABROC-1 software and were 0.7 IU/mL for all stimuli [45, 46]. For day-7 diluted plasma the same IFN- cut-off value was used and the data are shown considering the dilution factor. Moreover for IFN- values above 10 IU/ml serial dilutions of plasma were performed.
IL-1, IL-2, IL-6, TNF-, IL-4, IL-10, IL-13, IP-10, IL-8, MIP-1 , MIP-1
IL-1, IL-2, IL-6, TNF-, IL-4, IL-10, IL-13, IP-10, IL-8, MIP-1 , MIP-1 levels in plasma from day 1-cultured whole blood was evaluated by
xMAP multiplex technology on the Luminex platform (Luminex, Austin TX, USA), using Biosource reagents (Biosource, Camarillo, USA) acquired and analyzed with the STarStation v2.0 software (Applied Cytometry Systems, United Kingdom). Responses were scored positive if the value was 2 fold over the negative control.
Commercially available assay
QF (Cellestis Limited, Carnegie, Victoria, Australia) was performed and its results were scored as indicated by the manufacturer (cut-off value for a positive test was 0.35 IU/ml). For IFN- values above 10 IU/ml serial dilutions of plasma were performed.
Statistical analysis
The main outcome of the study was the evaluation of IFN- production in response to mitogen (PHA) and antigenic stimulation in the QF and whole blood ELISA (WBE), expressed as dichotomous (positive/negative) and continuous (IU/ mL) measures. IFN- median and range were calculated. The Mann-Whitney U test was used to compare continuous variables, and Chi square or McNemar tests were used for categorical variables. Analysis was carried out with SPSS v 14 for Windows (SPSS Italia srl, Bologna, Italy).
Third Part: Characterization of regulatory T-cells identified as CD4+CD25highCD39+ in patients with active tuberculosis
Study population
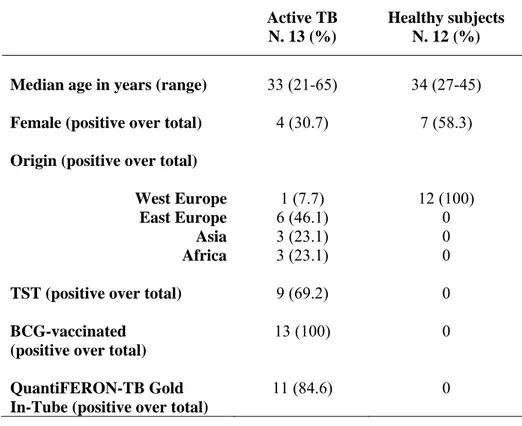
Thirteen patients with newly diagnosed pulmonary TB and twelve healthy control subjects were recruited at the National Institute for Infectious Diseases (INMI) "Lazzaro Spallanzani". The study was approved by the Ethics Committee of the Institute, and all enrolled individuals provided written informed consent. All the patients included in the study were sputum culture positive for M. tuberculosis, tested negative for HIV infection and
did not receive immunosuppressive drugs. Healthy subjects were chosen if: i) no exposure to M. tuberculosis was reported; ii) negative response to the QuantiFERON-TB Gold was shown; iii) negative TST scoring. Characteristics of all participants are shown in Table 6.
Patients with active TB were studied within 7 days of admission and before they started anti-TB therapy. For each enrolled participant, a blood sample was drawn into tubes containing heparin.
TST was administered by the Mantoux procedure using 5 IU of PPD (Chiron, Siena, Italy). Results were read after 72 hours. Induration of at least 10 mm was considered a positive response [47] .
QuantiFERON-TB Gold In-Tube (Cellestis Limited, Carnegie, Victoria, Australia) was performed and its results were scored as indicated by the manufacturer (cut-off value for a positive test was 0.35 IU/mL).
In a group of patients we also evaluated Cytomegalovirus serology by VIDAS CMV IgG and IgM (Biomerieux, Marcy l’Etoile, France).
Isolation of peripheral blood mononuclear cells and cultures
PBMC were isolated from whole blood using Ficoll density gradient centrifugation. After washing, PBMC at a concentration of 1x10⁶ cells/mL
were cultured for 6 days at 37°C and 5% CO2 in a complete medium (RPMI,
10% heat-inactivated human serum, 10mM HEPES, 2mM L-glutamine and 10 U/mL penicillin-streptomycin, all from Euroclone Ltd, United Kingdom). Cultures were prepared in 48-well tissue-culture plates (Costar, Corning Inc, NY, USA) in 1 mL/well. PBMC were stimulated with M. tuberculosis-specific antigens identified as ESAT-6 and CFP-10 (RD1) intact proteins (Lionex, Braunschweig, Germany) at 4 μg⁄mL in the presence or absence of IL-2 (Chiron) at 5 U/mL.
Depletion of CD4+CD25+ T-cells
In some experiments, CD4+ T-cells were isolated from PBMC by a
negative selection (Miltenyi Biotec, Bergisch Gladbach, Germany), then CD4+CD25+ T-cells were positively selected from CD4+ T-cells using a
human CD4+CD25+ regulatory T-cell isolation kit according to the
manufacturer’s instructions (Miltenyi Biotec). Approximately 90% of Treg were eliminated after depletion, as determined by flow cytometry analysis.
The cell fractions “CD4−“and “CD4+CD25−“were pooled and used as
Treg-depleted PBMC.
Cytokine detection
From PBMC different cell subsets were sorted (MoFlo, Beckman Coulter, Fullerton, CA) based on the expression of CD39 on CD25high/low
CD4+ T-cells, and were used to determine TGF-1 production; B cells
(CD19+ cells) and monocytes (CD14+CD3- cells) were used as control. The different cell subsets were in vitro stimulated for 1 day with anti-CD3 and anti-CD28 antibodies (Becton Dickinson). TGF-1 and IL-10 release was evaluated by ELISA (R&D Systems, Minneapolis, MN, USA).
IFN- in the cell cultures’ supernatants was evaluated by ELISA according to the manufacturer (QuantiFERON-CMI, Cellestis Limited, South Melbourne, Australia). Cytokines results were expressed as pg/mL.
Antigen-specific response evaluation.
Freshly isolated Treg-undepleted PBMC and Treg-depleted PBMC from TB patients were cultured in 96-well plates at a concentration of 2×10⁵ cells
per well in 250 μL of complete medium. The cells were stimulated with M. tuberculosis-specific RD1 intact proteins (Lionex), phytohemagglutinin (PHA) at 5 μg/mL (Sigma Aldrich, St Louis, MO, USA), and Cytomegalovirus (CMV) lysate (StrainAD 169, ABI Inc, Columbia, MD, USA) at 2 μg/ml and cultured for 3 days.
Phenotypic analysis
Phenotypic analysis of PBMC (1x10⁶ cells/mL) was performed by flow cytometry either ex-vivo or after 1 and 6 days of culture in complete medium in the presence or absence of the stimuli as indicated above. Expression of different markers was assessed by staining with appropriate combinations of monoclonal antibodies (MoAb) directly conjugated to fluorochromes: fluorescein isothiocyanate (FITC)-conjugated anti-CD39 (Ancell, Bayport, MN, USA), phycoerythrin (PE)-conjugated anti-CD25 (Becton Dickinson), peridinin chlorophyll-protein complex (PerCP)-conjugated anti-CD4 (Becton Dickinson) and Alexa Fluor 647-conjugated anti-FoxP3 (Becton Dickinson).
To detect intracellular expression of IFN-, 10 μg/mL of brefeldin A (Sigma Aldrich) was used, as described previously [48]. Phorbol-12-myristate-13-acetate (PMA) plus ionomycin (Sigma Aldrich) were used as positive controls at 3 nM and 1,5 μM, respectively. Briefly, production of IFN- was assessed by staining with appropriate combinations of MoAb conjugated directly to fluorochromes. Data acquisition and analysis were performed on FACSCalibur flow cytometer (Becton Dickinson) using CellQUEST software (version 3.1; Becton Dickinson). For all staining procedures, an isotype-matched negative control was processed in parallel.
Statistical analysis
Statistical significance of results was determined with the statistics program included in the GraphPad Prism software (GraphPad). Statistical analysis was performed using Student’s t-test to assess differences between the different study groups. The Wilcoxon matched pair t-test was used to analyze cytokines production by Treg. Differences were considered significant when the p value was less than 0.05.
Results
First Part: New tools to detect active tuberculosis infection:
Mycobacterium tuberculosis DNA in soluble fraction of urine specimens
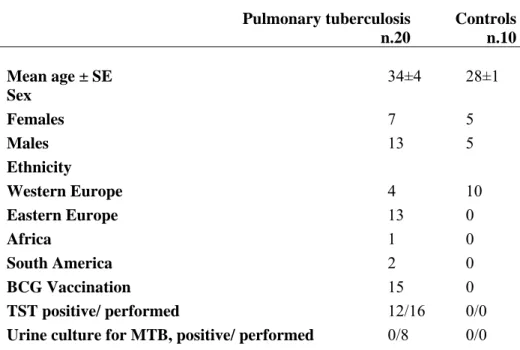
Characteristics of patients with TB included in this study are shown in Table 2. DNA was extracted from the urine of the patients as described in materials and methods, and examined to assess the presence of small cell-free M. tuberculosis DNA fragments using semi-nested PCR.
Pulmonary tuberculosis n.20 Controls n.10 Mean age ± SE 34±4 28±1 Sex Females 7 5 Males 13 5 Ethnicity Western Europe 4 10 Eastern Europe 13 0 Africa 1 0 South America 2 0 BCG Vaccination 15 0 TST positive/ performed 12/16 0/0
Urine culture for MTB, positive/ performed 0/8 0/0 Footnotes: MTB : M. tuberculosis; TST: tuberculin skin test; SE: standard error; BCG: bacillus Calmette et Guerin.
Table 2: Epidemiological and demographic characteristics of patients with active
pulmonary TB microbiologically diagnosed by sputum culture and healthy controls.
Results from semi-nested amplification are shown in Figure 1. The M. tuberculosis-specific product of 67 bp was found in urine specimens from all 20 patients analyzed. Ten healthy individuals used as controls were all found to be negative for the presence of M. tuberculosis-specific sequences.
Figure 1: Semi-nested PCR products of DNA extracted from urine of 8 healthy
individuals and 20 patients diagnosed with active pulmonary M. tuberculosis infection. Product is 67 base pairs, and semi-nested PCR was performed with species-specific primers. The last lane in both gels is genomic DNA from H37RV strain
In order to determine whether M. tuberculosis-specific DNA sequences were still detectable after completion of the initial phase of specific treatment, out of 8 patients with TB who had been found to be M. tuberculosis Tr-DNA positive at enrolment were asked to return to donate urine samples approximately two months following initiation of chemotherapy. At the time of the second test clinical symptoms had resolved in these patients and all sputum cultures were negative. Tr-DNA extracted from these samples was analyzed and no product corresponding to 67 bp specific M. tuberculosis sequence was observed (Figure 2).
Figure 2: Semi-nested PCR products of DNA extracted from urine of 8 patients with
active pulmonary TB performed before and after two months of drug therapy. M.
Previous reports on detection of M. tuberculosis DNA in urine employed isolation methods designed to extract high molecular weight DNA from whole urine or urinary sediment. Furthermore, in those studies large amplicons >200 bp were used in PCR reactions [49]. Therefore, it was important to further characterize the nature of the M. tuberculosis Tr-DNA found in our study, and to compare results with larger amplicon sizes similar to those used by others.
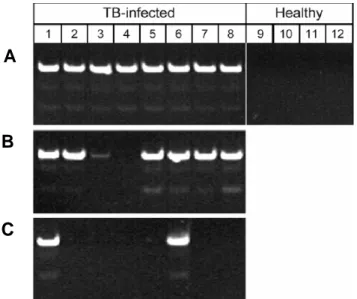
In order to address this question, two experimental designs were employed. In the first, specimens were centrifuged as described above and DNA was isolated separately from urine sediment and supernatant. The urine specimens from eight pulmonary TB patients were centrifuged at 4000xg and the supernatant was separated from the insoluble sediment. As shown in Figure 3, it was found that the 67 bp M. tuberculosis-specific bands were present in 7 of the 8 supernatants, whereas, only 2 of the 8 matched sediments exhibited positive bands.
A
B
C
Figure 3: Semi-nested PCR for M. tuberculosis in whole urine (A) compared with
products from DNA extracted from matched supernatant (B) and sediment (C) following centrifugation at 4000xg, 20 min at ambient temperature. The right 4 lanes are healthy individuals. Amplification product is 67 base pairs.
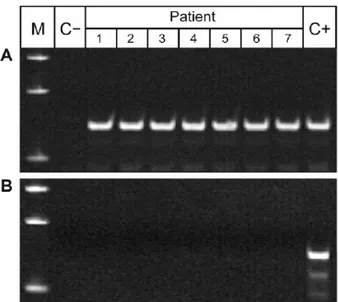
A second experimental design was based on the comparison of PCR results obtained with primers specific for a larger amplicon size used by several other investigators. Results presented in Figure 4 demonstrate that M. tuberculosis DNA sequences again were detected in all 7 samples of DNA that had been isolated from urine of pulmonary TB patients with primers for 129/67 amplicons. However, no PCR products were detected using primers for 330/69 amplicons. These data confirmed that bacterial DNA fragments extracted from urine are relatively short. Furthermore, these results strongly suggest that it is unlikely that M. tuberculosis DNA can be reproducibly detected in urine specimens of pulmonary TB patients using urine sediment PCR analysis combined with large amplicon sizes.
Figure 4: Semi-nested PCR performed on aliquots of urine DNA isolated from seven TB
infected patients (Lanes 3-9) with primers designed for short 129/67 (A) and large 330/69 (B) amplicons (see Materials and methods). Lanes 1 in both gels shows the DNA standards, Lanes 2 are negative controls, and Lanes 10 are positive genomic DNA controls.
Second Part: New tools to detect latent tuberculosis infection: evaluation of memory responses and new biomarkers in response to RD1 antigens in TST+ subjects exposed to Mycobacterium tuberculosis
Characteristics of the population.
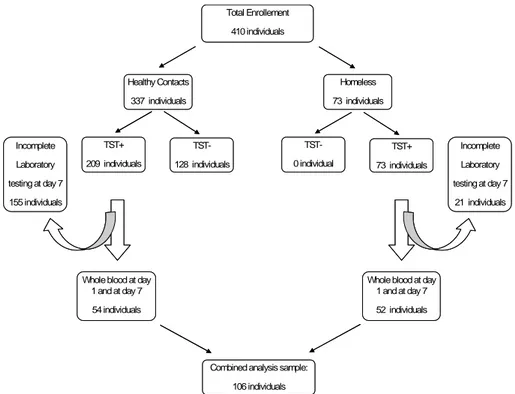
We prospectively recruited 410 subjects to be screened for LTBI. Among them 337 were healthy contacts of patients with sputum smear positive pulmonary TB and 73 were TST+ homeless subjects. Among the healthy
contacts 209 resulted TST+. Among the all TST+ individuals studied, the
laboratory testing was incomplete in 155 healthy contacts and in 21 homeless subjects. Therefore we analyzed the data only in 54 healthy contacts and 52 homeless (Figure 5 study flow diagram).
Total Enrollement 410 individuals Healthy Contacts 337 individuals Homeless 73 individuals TST+ 209 individuals TST-128 individuals TST+ 73 individuals TST-0 individual
Whole blood at day 1 and at day 7 54 individuals
Whole blood at day 1 and at day 7 52 individuals Incomplete Laboratory testing at day 7 155 individuals Incomplete Laboratory testing at day 7 21 individuals
Combined analysis sample: 106 individuals Total Enrollement 410 individuals Healthy Contacts 337 individuals Homeless 73 individuals TST+ 209 individuals TST-128 individuals TST+ 73 individuals TST-0 individual
Whole blood at day 1 and at day 7 54 individuals
Whole blood at day 1 and at day 7 52 individuals Incomplete Laboratory testing at day 7 155 individuals Incomplete Laboratory testing at day 7 21 individuals
Combined analysis sample: 106 individuals
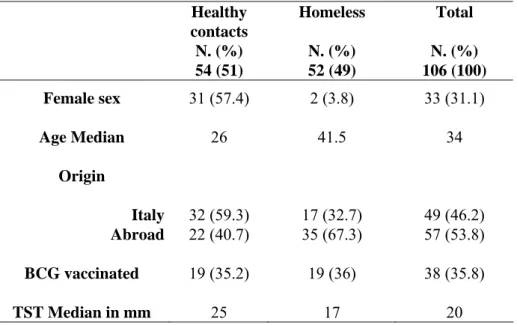
The two study populations were statically different with regard to demographic factors as age (p<0.05) and sex (p<0.0001). Conversely, no significant differences were observed for the other features considered as origin, BCG vaccination and size of TST induration (Table 3).
Healthy contacts N. (%) Homeless N. (%) Total N. (%) 54 (51) 52 (49) 106 (100) Female sex 31 (57.4) 2 (3.8) 33 (31.1) Age Median 26 41.5 34 Origin Italy 32 (59.3) 17 (32.7) 49 (46.2) Abroad 22 (40.7) 35 (67.3) 57 (53.8) BCG vaccinated 19 (35.2) 19 (36) 38 (35.8) TST Median in mm 25 17 20
Table 3: Characteristics of study subjects
In vitro responses to PPD, RD1 proteins and QF at day 1 post-in vitro
stimulation
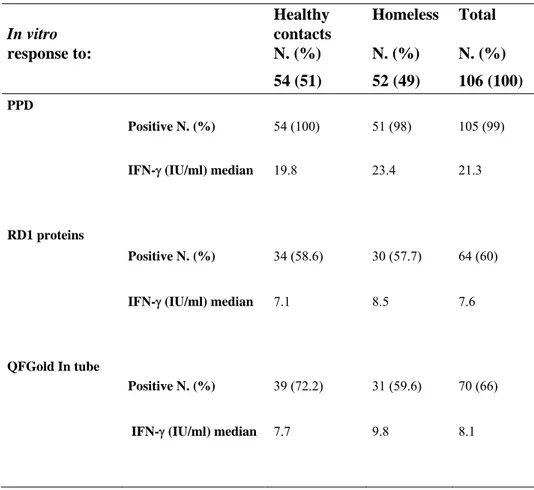
Among the 54 healthy contacts IFN- production in response to PPD was present in 100% (54/54), to RD1 proteins in 58.6% (34/54) and to QF in 72.2% (39/54). Median of IFN- production in response to PPD was 19.75 IU/mL (CI, 0.7-56.8), to RD1 proteins 7.1 IU/mL (CI, 1-34.50) and 7.7 IU/mL (CI, 0.6-52.80) to QF (Table 4).
In vitro response to: Healthy contacts N. (%) Homeless N. (%) Total N. (%) 54 (51) 52 (49) 106 (100) PPD Positive N. (%) 54 (100) 51 (98) 105 (99)
IFN- (IU/ml) median 19.8 23.4 21.3
RD1 proteins
Positive N. (%) 34 (58.6) 30 (57.7) 64 (60)
IFN- (IU/ml) median 7.1 8.5 7.6
QFGold In tube
Positive N. (%) 39 (72.2) 31 (59.6) 70 (66)
IFN- (IU/ml) median 7.7 9.8 8.1
Table 4: In vitro responses to M. tuberculosis antigens in the study groups populations.
Among the homeless, response to PPD was observed in 98% (51/52), to RD1 proteins in 57.7% (30/52) and to QF in 59.6% (31/52). Median of IFN- production in response to PPD was 23.4 IU/mL (CI, 0.7-63.2), to RD1 proteins was 8.5 IU/mL (CI, 0.7-49.3) and 9.8 IU/mL to QF (CI, 0.4-50.4). Since no statistical difference was found between the single tests’ results obtained in these two groups from here after we pooled the data together. Therefore considering whole data, the response to PPD was observed in 99% (105/106), to RD1 proteins in 60% (64/106) CI, 0.7-49.3) and to QF in 66% (70/106) CI, 0.4-52,80) (Table 4). Median of IFN- production in response to PPD was 21.3 IU/mL (CI, 63.2), to RD1 proteins 7.6 IU/mL (CI,
0.7-49.3) and to QF 8.1 IU/mL (CI, 0.4-52.80). These data indicate that stimulation with RD1 antigens is more restricted than that with PPD, as expected [45]. Moreover, the results obtained by RD1 proteins stimulation are similar to those obtained by QF test, as we previously reported [46]. Therefore from here after we used either stimuli to detect RD1 responses.
Memory Response to RD1 proteins
In an effort to find new tools to detect LTBI, we evaluated IFN- response to RD1 proteins at day 7 (memory response), as previously shown [44]. Among these 42 TST+ individuals known to have been exposed to M.
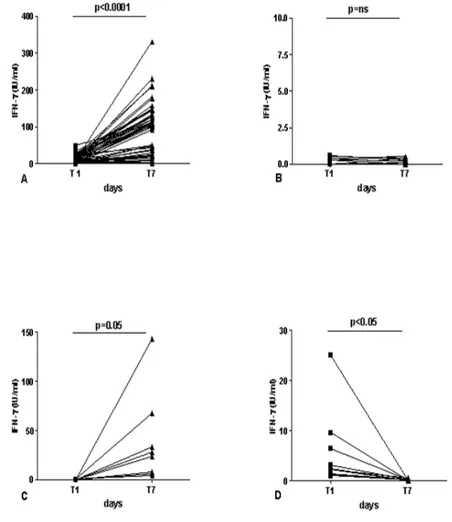
tuberculosis and to have negative results either to QF or to day-1 RD1 protein stimulation, 8 subjects (8/42; 19%) resulted positive to the 7-day whole blood test and this difference was statistically significant (p<0.005). Moreover, based on the response detected at day 1 and day 7, we divided the population studied in 4 groups: the first group enclosed 54 subjects classified as “responders over time” (Figure 6A), if IFN- response was positive over time; the second group comprised 34 subjects defined as “no responders over time” if no specific response was detected at both time points (Figure 6B); the third group enclosed 8 individuals that were categorized as “memory responders” if IFN- response was undetectable at day 1 and recovered at day 7 (Figure 6C) and finally the forth group enclosed “the effector responders” if IFN- response was detectable at day 1 and absent at day 7 (Figure 6D). In the “responders over time” we found a statistical significant difference (p<0.0001) between IFN- release at day 1 (median=8.3 IU/ml, range, 0.7-49.3) compared to that at day 7 (median= 107.5 IU/ml; range, 4-330.5). In contrast, no difference was found in the group of the 34 subjects classified as “no responders over time” between IFN- release at day 1 (median=0.1 IU/ml, range, 0-0.5) compared to that at day 7 (median= 0 IU/ml; range, 0-0.6). Interestingly in the 8 subjects defined as “memory responders” a statistical significant difference (p<0.04) between IFN- release at day 1 (median=0.3 IU/ml, range, 0-0.6) compared to that at day 7 (median= 26 IU/ml; range, 4-143.5) was found. To note that in the 10 subjects showing a selective effector response without memory response, a statistical significant difference (p<0.05) between IFN- release at day 1 (median=2.4 IU/ml, range 1-25.1) compared to that at day 7 (median= 0.2 IU/ml; range 0-0.6) was found. The majority of these subjects were healthy contacts (7/10).
All these data together indicate that in 8/42 (19%) a memory response to RD1 proteins can be detected in TST+ subjects enrolled with a suspect of
LTBI. Moreover, the generation of a memory response can be lost in 10/64 (15.6%) especially if the subjects have been recently exposed to M. tuberculosis.
Figure 6: Effector and memory response in TST+ subjects enrolled with a suspect of LTBI. IFN- secretion in response to RD1 proteins was evaluated at day 1 (effector response)
and at day 7 (memory response). Based on these responses, we divided the population studied in 4 groups: the first group enclosed 54 subjects classified as “responders over time” (6A), if IFN- response was positive over time; the second group comprised 34 subjects that were defined as “no responders over time” if no specific response was detected at both time points
(6B); the third group enclosed 8 individuals that were categorized as “memory responders” if IFN- response was undetectable at day 1 and recovered at day 7 (6C) and finally the forth group enclosed “the effector responders” if IFN- response was detectable at day 1 and absent at day 7 (6D).
Abbreviations: IFN: interferon; T1: day 1; T2: day 7; ns: no significant.
Cytokines different from IFN- that are induced by RD1 proteins
It has been recently shown that cytokines and chemokines different from IFN- can be additional biomarkers to detect M. tuberculosis infection as they appear to be both sensitive and specific for M. tuberculosis exposure [21]. Based on these observations we evaluated at day 1 in a subgroup of “responders over time” the production of pro-inflammatory cytokines (IL-1, IL-2, IL-6 and TNF-), anti-inflammatory cytokines (IL-4, IL-10, IL-13) and chemokines (IP-10, MIP-1, MIP-1, IL-8) after stimulation with RD1 proteins (Table 5A-C).
Pro-inflammatory cytokines
IL-1 IL-6 IL-2 TNF-
Median(range) PHA* 72(0-175) 559(0-1153) 37(0-202) 260(0-353) Ag TB* 18(0-137) 61(0-140) 142(91-313) 52(0-156) “Responders over time” N.9 Nihil 179(40-278) 241(27-365) 37(18-195) 281(12-402) PHA* 78(0-199) 649(154-2178) 44(18-105) 205(0-540) Ag TB* 44(0-72 ) 52(0-611) 0(0-57) 17(0-186) “No responders over time” N. 9 Nihil 187(81-462) 228(81-1181) 39(3-355) 210(49-1007) PHA* 18(0-134) 519(82-1490) 57(8-126) 92(0-342) Ag TB* 29(8-62) 59(31-256) 14(0-24) 0(0-67) “Memory Responders” N. 5 Nihil 140(99-200) 259(112-740) 35(3-115) 251(198-302) Table 5A
Legend: PHA: phytohaemoagglutinin; Ag TB: antigen M. tuberculosis; IL: interleukin; IP: interferon-inducible protein; MIP: macrophage inflammatoryprotein; TNF: tumor necrosis factor; * indicates median value after subtraction of the nihil value.
Anti-inflammatory cytokines
IL-4 IL-10 IL-13 Median(range) PHA* 10(0-12) 147(54-241) 117(2-284) Ag TB* 2(0-3) 0(0-10) 32(4-69) “Responders over time” N.9 Nihil 10(6-30) 26(19-49) 13(8-48) PHA* 5(0-13) 132(22-401) 100(11-218) Ag TB* 1(0-6) 0(0-55) 2(0-20) “No responders over time” N. 9 Nihil 10(6-63) 29(16-460) 10(8-345) PHA* 4(1-10) 105(0-453) 129(4-152) Ag TB* 0(0-3) 0(0-21) 0(0-8) “Memory Responders” N. 5 Nihil 11(8-16) 25(18-58) 14(10-17) Table 5B
Legend: PHA: phytohaemoagglutinin; Ag TB: antigen M. tuberculosis; IL: interleukin; IP: interferon-inducible protein; MIP: macrophage inflammatoryprotein; TNF: tumor necrosis factor; * indicates median value after subtraction of the nihil value.
Chemokines
IL-8 MIP-1 MIP-1 IP-10
Median(range) PHA* 0(0-25) 555(0-1418) 1299(0-4573) 2387(1175-3542) Ag TB* 0(0-3846) 27(0-596) 407(0-1345) 3065(1357-3839) “Responders over time” N.9 Nihil 2474(496-6955) 162(24-303) 522(137-954) 564(309-1034) PHA* 0(0-13930) 163(0-1250) 238(0-1325) 1526(0-2259) Ag TB* 0(0-3246) 0(0-187) 0(0-3344) 0(0-0) “No responders over time” N. 9 Nihil 1471(288-12840) 215(53-596) 726(208-7369) 625(375-2756) PHA* 303(0-16392) 384(11-2021) 642(0-2338) 1560(947-2581) Ag TB* 167(0-2895) 50(0-103) 258(0-733) 373(7-1538) “Memory Responders” N. 5 Nihil 1204(288-3041) 179(135-207) 583(515-969) 799(406-1729) Table 5C
Legend: PHA: phytohaemoagglutinin; Ag TB: antigen M. tuberculosis; IL: interleukin; IP: interferon-inducible protein; MIP: macrophage inflammatoryprotein; TNF: tumor necrosis factor; * indicates median value after subtraction of the nihil value.
In the tables, median and range of the factors detected are reported. As shown, we found a statistical significant difference between the release of IL-2 (p<0.006) and IP10 (p<0.0001) in response to RD1 proteins compared to control. Therefore we evaluated in the other groups if these factors were modulated by specific stimulation. In the subgroup of “no responders overtime” we found that 2/9 (22%) responded to IL-2 and 1/9 (11%) to IP-10, whereas in the subgroup of “memory responders“, we detected a response to IL-2 in 2/8 (25%) and to IP-10 in 1/5 (20%). These data together indicate that IL-2 and IP-10 may be additional markers of TB infection after RD1 specific stimulation.
Third Part: Characterization of regulatory T-cells identified as CD4+CD25highCD39+ in patients with active tuberculosis
Epidemiological and demographic characteristics of the subjects enrolled.
Demographic and clinical characteristics of the 13 patients with active TB and 12 healthy control subjects are summarized in Table 6. Among the 13 patients with active TB, 9 (69%) had TST-positive results. All TB subjects were bacillus Calmette et Guerin (BCG)-vaccinated. Among the 12 control subjects, all were TST-negative, BCG-unvaccinated and none was infected with M. tuberculosis (negative result to QuantiFERON-TB Gold).
Active TB N. 13 (%)
Healthy subjects N. 12 (%) Median age in years (range) 33 (21-65) 34 (27-45) Female (positive over total) 4 (30.7) 7 (58.3) Origin (positive over total)
West Europe 1 (7.7) 12 (100)
East Europe 6 (46.1) 0
Asia 3 (23.1) 0
Africa 3 (23.1) 0
TST (positive over total) 9 (69.2) 0
BCG-vaccinated (positive over total)
13 (100) 0
QuantiFERON-TB Gold In-Tube (positive over total)
11 (84.6) 0
Table 6: Epidemiological and demographic characteristics of the subjects enrolled
Phenotypic Analysis of Treg.
To compare the classical markers for Treg (CD25,FoxP3 andCD127), with the recently identified CD39 marker, we stained PBMC ex-vivo with the appropriate combination of MoAbs.
As shown in Figure 7A, CD25 identified 3 distinct populations of CD4+ T-cells (High, Low and Negative), that also differently express FoxP3 (Figure 7B, C, D), CD127 (Figure 7E, F, G) and CD39 (Figure 7H, I, J). Interestingly, the CD39 marker is expressed almost exclusively by the CD4+CD25high population (median 40±20% Figure 7H), similar to FoxP3 (median 86±14% Figure 7B). On the contrary, CD127 is expressed at very low levels by CD4+CD25high compared to the CD4+CD25low and CD4+CD25neg cells.