University of Eastern Piedmont
The Department of Health Science
PhD Program in Medical Sciences and Biotechnology
XXX Cycle
Phage display selection and development of
monoclonal antibodies against Protein Disulfide
Isomerase, a novel tumor associated antigen and
potential target for cancer immunotherapy
PhD candidate: Tarasiuk Olga
Tutor: Prof. Claudio Santoro
Coordinator: Prof.Marisa Gariglio
Academic year 2014-2017 SSD BIO/13
Acknowledgements
With all appreciations and gratitude I would like to thank Prof. Claudio Santoro for giving me the opportunity to work in the laboratory of Applied Biology at the University of Eastern Piedmont. It was a great pleasure for me and I’ve appreciated the support and knowledge received to foster my professional grow.
Moreover, I would like to say my deepest words of thankfulness to Dr. Diego Cotella and Dr. Marco Corazzari for helping, teaching and supporting me through all the way to my PhD. I would have not be able to complete my PhD without them.
I also want to say my words of thankfulness to Dr. Silvia Zucchelli, Dr. Maria Felicia Soluri, Mara Gagliardi, Miriam Galasso, Marta Borchiellini, Gabriella Forestieri, Andrea Chiesa, Dr. Szilvia Bako, Dr. Laura Patrucco, Feba Varughese and all the people who were working in the lab. They were involved in my work, giving helpful suggestions and support.
My special thanks to Prof. Daniele Sblattero and all researchers at the Department of Life Sciences, University of Trieste for their key collaboration. A separate thank to Dr. Frank Antony for sharing knowledge and unpublished results.
To all my beloved ones, from the deepest of my heart I want to thank for support and understanding during these years of PhD.
Table of Contents
Chapter 1
………..……… 11. Introduction ………... ………1
1.1. Ovarian cancer ... 1
1.2. Symptoms of ovarian cancer………2
1.3. Classification of ovarian cancer ………..………2
1.4. Ovarian cancer treatment………...3
2. Biomarkers-based personalized therapy……….…….4
2.1. Biomarkers ...4
2.2. Ovarian cancer biomarkers ...5
2.3. Ovarian cancer ascites for biomarkers identification...5
3. Cancer and immunotherapy………..………..6
3.1. Cancer triggers immune reaction...6
3.2. Autoantibodies ...7
3.3. Tumor associated antigens (TAA)………..……….…………..7
4. TAA identification techniques ...;...7
4.1. Serological proteome analysis (SERPA)...7
4.2. Screening of Expression library……….……….……...8
4.3. Display systems……… ...9
4.4. Phage Display……….. ...9
4.5. Publication: Phage display technology for human monoclonal antibodies...10
4.6. Phage Microarray……….26
5. Monoclonal antibody therapy……….…………...27
5.1. Monoclonal antibodies (mAbs) mechanism of action...27
5.2. Complement dependent cytotoxicity (CDC)……….…………...27
5.3. Antibody-dependent cell-mediated cytotoxicity (ADCC)...28
5.4. CDC and ADCC interaction ...29
Chapter 2
………..………..316. Project description ...31
6.1. Objectives of the project………...31
6.2. Project summary………..……….31
Chapter 3
………..………..357. Results Part I: Publication………..35
8. Results Part II……….55
8.1. Introduction to results………...55
8.2. Tumor associated antigen identification………...56
8.2.1. Ovarian cancer patient ascites antibodies identification ………..………....56
8.2.2. SERPA tumor associated antigens identification………..58
8.2.3. ELISA assay PDI specificity of ovarian cancer patient ascites antibodies……...59
8.2.4. CDC assay……….59
8.2.5. OVCAR-3 surface PDI staining ………...60
8.3. Recombinant antibodies production………..61
8.3.1. Phage display antibodies selection………61
8.3.2. Antibody production……….64
8.3.3. ELISA assay………...65
8.3.4. Epitope mapping………...66
8.3.5. Immunofluorescent staining……….69
8.3.7. Immunoprecipitation………...73
8.3.8. Competition assay………...73
8.3.9. CDC assay …………..………75
Chapter 4
……….…….…789. Discussion……….78
9.1. Tumor associated antigen identification………..78
9.2. Protein Disulfide Isomerase (PDI) ………...81
9.3. Recombinant antibodies production ………....83
9.4. Antibodies characterization in standard laboratory assays ………..84
10. Conclusions ……….………85
Chapter 5
……….…….….8611. Material and methods ………. 86
11.1. Section 1: Abbreviations……….86
11.2. Section 2: Solutions and buffers ………....86
11.3. Section 3: Standard protocols……….88
11.4. Section 4: Methods ………...90
11.4.1. Patient samples and cell lines ………90
11.4.2. Identification of autoantibodies in ascites ……….91
11.4.3. PDI antigen identification ………..92
11.4.4. Antibody selection ……….94
11.4.5. Clones sequencing analysis ………...95
11.4.6. Recombinant antibodies production ………..95
11.4.7. Antibodies characterization by standard laboratory assays ………...96
11.4.8. Epitope mapping ………98
11.4.9. CDC assay ………..99
List of figures
Fig.1. Ovarian cancer types.
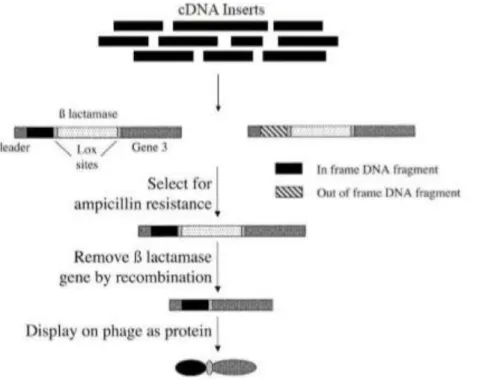
Fig. 2. Scheme of the Open Reading Frame (ORF) - filtering approach. Random fragments are cloned upstream of a β-lactamase gene. Clones containing fragments that are ORFs allow the synthesis of a fusion protein that confer ampicillin resistance to transformed bacteria. After selection on ampicillin, the β-lactamase gene can be removed by passage through bacteria expressing Cre recombinase. The selected ORF can then be displayed on phage.
Fig.3. Different types of microarray. (A) Three types of microarray coating, namely antibody, peptide or protein coating. (B) Second step of microarray where studies interactors are added: proteins, cells or lysate for antibody microarray; proteins, antibodies or lysate for peptide microarray; and proteins or antibodies for protein microarray.
Fig.4. CDC scheme. Complement component C1 recognizes the Fc portion of IgG’s and becomes activated, cleaves C4 into C4a and C4b and C2 into C2a and C2b. C4b and C2a together form the C3 convertase, which enzymatically cleaves C3 into C3a and C3b. C3b is incorporated into the classical C3 convertase to form C5 convertase, which cleaves C5 into C5a and C5b. C5b also gets deposited on the target cell surface. Complement proteins C6–C9 form the terminal complex, membrane attack complex (MAC), that forms a transmembrane channel, which causes osmotic lysis of the target cell.
Fig.5. ADCC scheme. Activation of NK cells is performed through transmembrane activating and inhibitory receptors. Activated NK cells lead to degranulation and cytokine secretion. Perforin and granzymes uptake by target cells and TNF family death receptor signaling causes target cell apoptosis. IFNγ released by NK cells activate nearby immune cells to promote antigen presentation and adaptive immune responses. Macrophages, neutrophils and eosinophils can mediate ADCC.
Fig.6. Schematic presentation of ovarian cancer antigens identification using two approaches. 1. Antibodies were purified from ovarian cancer, non-cancerous and other cancer ascites; 2.IF staining of OVCAR-3 cells surface using purified antibodies; OVCAR-3.ORF library phage display selection; 4. Selected in phage display clones screened with ascites antibodies in microarray assay; 5. Validation of antibodies specificity to selected clones in ELISA assay; 6. Analyze of correlation of patients survival with antibodies; 7. Performing cell surface ELISA to show that ovarian cancer ascites contain antibodies against ovarian cancer cell surface proteins; 8. Identification the most abundant antibody in ovarian cancer ascites by SERPA; 9. Analyzing PDI specificity of ovarian cancer antibodies in ELISA assay; 10. Representing killing capabilities of anti-PDI antibodies in CDC assay; 11. Representing PDI protein on ovarian cancer cells surface by IF staining.
Fig.7. Schematic representation of recombinant antibodies production and it analysis: 1.Selection scFv’s specific to PDI protein in phage display selection; 2. Confirmation of PDI specificity of selected clones in phage ELISA; 3. Sequencing of selected clones and correction of occurred TAG mutations; 4. Cloning of scFv’s into pcDNA3.1/Hygro(+) vector, transfection CHO cells , selection of best antibodies producing clone and antibody production; 5. Identification of epitopes for each antibody; 6. Analyze of antibodies functionality in main laboratory assays, namely immunofluorescent assay (7), immunoprecipitation assay (8), ELISA assay (9), Competition assay (10), CDC assay (11).
Fig.8. Scheme of anti-PDIA1 autoantibodies identification by SERPA. OVCAR-3 cell lysate was separated by 2D-gelelectrophoresis, transferred to membrane and incubated with ascites of ovarian cancer patients. Spots, where antibodies showed binding were isolated and analyzed by mass spectrometry for protein identification. Fig.9. Characterization of ascitic fluid based on immune response. (A) Immunofluorescent staining of cell surface of ovarian cancer cells previously incubated by ovarian cancer ascites of patient #46. (B)
Immunofluorescent staining of cell surface of ovarian cancer cells previously incubated by non-cancerous ascites of patient #1206. (C) anti-Folate staining of ovarian cancer cell surface.
Fig.10. Ascites antibodies in Cell Surface ELISA and CDC assay. (A) Cell Surface Elisa. (B) Complement dependent cytotoxicity Assay. (C) Comparative analysis of CDC assay versus cell surface ELISA of all ovarian cancer ascites.
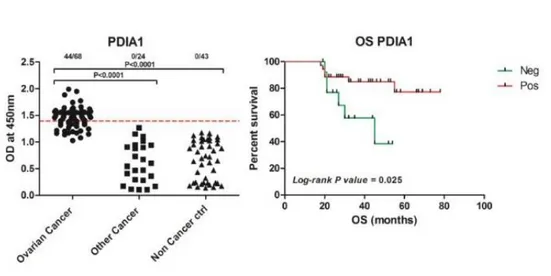
Fig.11.Serological Proteome Analysis. Recognition of OVCAR-3 cell lysate proteins separated by 2D-gelelectoforesis and transferred to membrane by ovarian cancer (left panel) and non-cancerous (right panel) patient ascites and identification PDI as the most abundant antibody binding protein by MS (under panel). Fig. 12. ELISA assay and Overall patient Survival analysis. Affinity purified antibodies of ovarian cancer, other cancer and non- cancerous ascites reactivity to recombinant PDIA1 in ELISA assay (left panel). Analysis of overall survival of ovarian cancer patients, which ascites showed Positive (above threshold) and Negative (bellow threshold) response to PDI in ELISA assay (right panel).
Fig.13. Anti-PDIA1 mediated complement dependent cytotoxicity. Affinity purified anti-PDI antibodies from ovarian cancer patient ascites, commercial anti-PDI and anti-Folate (used as positive control) antibodies activation of CDC. Affinity purified and commercial anti-PDI antibodies were cross-inhibited by incubation with PDI protein to represent it specificity.
Fig.14. PDI surface staining on not permeabilised OVCAR-3 cells. (A) Membrane surface staining (anti-Folate receptor staining). (B) Surface PDIA1 staining. (C) merge between A and B.
Fig.15. Clones specific for PDI identified during phage selection. 193 different colonies manually picked during phage display selection arranged in them reactivity to PDI protein. 36% of all colonies showed a strong reactivity signal in ELISA assay
Fig.16. Phage ELISA for selected clones A8, H7, D9, D2, H12 and B10. Phage clones were tested for it reactivity to GST-PDI folded, HIS-PDI folded, HIS-PDI denatured, GST and HIS-TG2 proteins (used as a control proteins to show that scFv’s were selected against PDI protein and not to its tag, which were GST and 6xHIS).
Fig.17. Finger printing analyze. B10, H12, H7 clones restricted by HaeIII and BastNI restriction enzymes that represent different cut patrons for each antibody confirming that antibodies are different from each other. Fig.18. Schematic representation of H12, H7 and B10 antibodies (minibodies) production. Plasmid pDAN5 was extracted from selected phage clones. scFv’s were digested from pDAN plasmid and cloned into pcDNA3.1/Hygro vector. This vector was analyzed for its correct sequence and transfected into CHO cells. Transfected CHO cells were grown under Hygromycin selection for two days. Cells that developed resistance to Hygromycin were grown in 96 well plates in concertation 1 cell/well for monoclonal selection. Best antibody producing cells were selected based on WB and ELISA results and were expanded. Supernatant of it was collected and used to purify antibodies.
Fig.19. Minibodies production. (A) Scheme of selected scFv’s cloning into pcDNA3.1/Hygro(+) vector that already contain fused Fc fragment that can be of different species. (1). (B) Produced antibodies were visualized in Western Blotting by anti-human and anti-SV5 antibodies. Produced antibodies were visualized and quantified in SDS-PAGE gel.
Fig.20. ELISA assay. ELISA wells were coated with 1µg/well recombinant HIS-PDI. Recombinant antibodies were used in different concentration to represent it reactivity to PDI.
Fig.21. Antibodies affinity. Saturating value of each antibody in ELISA assay was considered as maximum binding of antibody and was normalized till 1.0.
Fig.22. pTrcHIS B vector map
Fig.23. Different length PDI constructs. Schematic representation of different PDI constructs produced as separate proteins for epitope mapping. Domain A, B, B’, linker, A’, C correspond to domains as describes by Gruber et.al.
Fig.24. Epitope mapping using ELISA assay. ELISA wells were coated with 1µg/well of each PDI fragment (1-8 numbers correspond to the fragments in Fig.23). Recombinant antibodies shows different patron of epitope recognition.
Fig.25. WB epitope mapping of H12 antibody. H12 antibody recognizes PDI, constructs 1, 4 and less strongly constructs 2 and 8, that correspond to result in epitope mapping ELISA. Constructs correspond to it predicted weight.
Fig.26. Epitope sites for H12, H7 and B10 antibodies. Representation of PDI protein sites that are suggested to be recombinant antibodies epitopes. H12 antibody might recognize epitope located in between half of B’ domain and part of the linker. H7 antibody recognizes epitope in a fragment restricted to B’, linker, A’ domain. B10 antibody has a complex conformational epitope and can recognize only full correctly folded PDI protein.
Fig.27. Immunofluorescent staining of intracellular PDI. OVCAR-3 cell line were permeabilised and stained with recombinant antibodies H12, H7 and B10. Transmission field represents position of the cells in slide. Merge between recombinant antibodies staining and transmission field shows that PDI staining is present in cytoplasm. Fig.28. Immunofluorescent co-staining of intracellular PDI. OVCAR-3 cell line were permeabilised and stained with recombinant antibodies H12, H7 and B10 (bleu) in parallel with commercial anti-PDI antibodies (red). Merge between commercial anti-PDI and recombinant antibodies staining shows that staining correspond each other, what confirms specificity of recombinant antibodies to PDI protein.
Fig.29. Immunofluorescent staining of surface PDI in OVCAR-3 cells. Membrane staining performed by Triticum vulgaris FITC conjugate (that recognizes glycoproteins and on not permeabilised cells gives membrane staining) is represented in green. Recombinant antibodies PDI staining is represented in bleu. Merge between membrane and PDI staining represent that PDI is located on cell surface.
Fig.30. Surface PDI staining in OVCAR-3 cells. FACS analysis of PDI present of the surface of not permeabilised OVCAR-3 cells using H12, H7 and B10 antibodies (green graphic). Negative control (black filled graphic) is anti-human CY5 antibody staining
Fig.31. Immunoprecipitation assay. IP of endogenous PDI in OVCAR-3 cell lysate. Preliminary cell lysate was incubated with protein A beads to remove proteins that might bind protein A not specifically. Afterwards equal amount of cell lysate was incubated with H12, H7, B10 and commercial anti-PDI antibodies. Antibody-protein complex was pulled down with Antibody-protein A beads. Negative control (-C) was incubated only with Antibody-protein A beads. A small fraction of cell lysate (correspond to approximately 6%) was loaded to represent total amount of endogenous PDI in cell lysate.
Fig.32. Schematic representation of competition experiments. Recombinant antibodies H12, H7 and B10 were mixed with HIS-PDI. In parallel the same antibodies were also mixed with HIS-TG2 protein. Incubation took 1-2 hour on rotation at RT. Afterwards these antibodies were used for surface IF staining of PDI protein on not permeabilised OVCAR-3 cells and in ELISA assay on the wells pre-coated with PDI protein.
Fig.33. Immunofluorescent staining of surface PDI in OVCAR-3 cells. (A) H12, H7, B10 staining of cell membrane PDI after being preincubated with HIS-TG2 (in bleu). (B) H12, H7, B10 staining of cell membrane PDI after being preincubated with HIS-PDI (in bleu). Membrane staining performed by Triticum vulgaris FITC conjugate (that recognize glycoproteins and on not permeabilised cells gives membrane staining) is represented in green.
Fig.34. Competition ELISA. ELISA wells were pre-coated with 1µg/well PDI protein overnight at 4°C. H12, H7 and B10 antibodies used in ELISA assay were preinhibited with 0µg, 0,5µg, and 1µg of PDI or HIS-TG2.
Fig.35. Cell surface ELISA assay. Not permeabilised IGROV ovarian cancer cells were incubated with recombinant antibodies H12, B10 and H7 by each of it separately or in combination of three antibodies together B10+H7+H12. cMOV18 anti-Folate antibody was used a positive control
Fig.36. CDC assay. H12, B10 and H7 used in concentration 2µg/ml. Positive control anti-Folate receptor antibodies (cMOV18/19) used in concentration 2µg/ml each. Normal human serum (NHS) represents a negative control, cells that were incubated only with NHS.
Fig.37. Domains organization of PDI. (A) Models of human PDI and yeast PDI. (B) Ribbon diagram based on the crystal structure of yeast PDI showing the active-site cysteines in green space-filling representation. Colors of the domains are the same as in (A).
List of tables
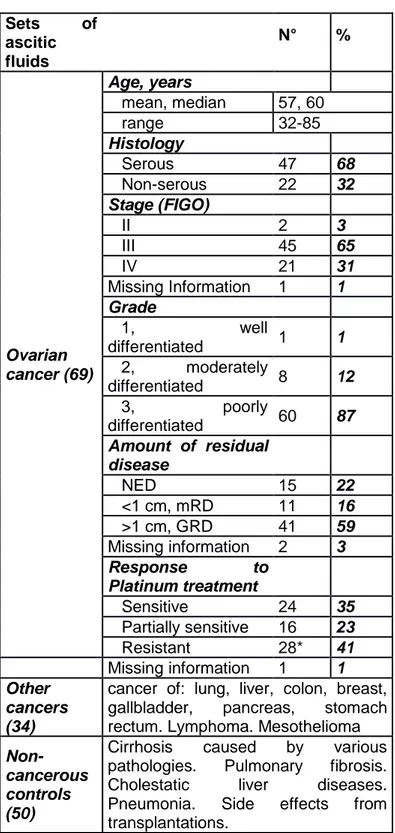
Tab.1. Cancer of the ovary classified by FIGO in 2006.
Tab.2. Specific for PDI clones selected as result of plasmid sequencing. Tab.3. Clones selected for TAG mutagenesis and further antibody production.
Summary
Epithelial ovarian cancer is the fifth most common cancer in women worldwide. Each year thousands of women are dying from it. Mostly asymptomatic during its development, EOC is diagnosed at late stages when metastasis occurs and treatment is mostly difficult. Despite huge efforts to identify novel molecular targets for diagnosis and cure, the treatment of ovarian cancer is still limited to cytoreductive surgery followed by chemotherapy. It’s obviously that new therapeutic approaches have to be developed instantly.
Identification of effective biomarkers for early diagnosis, prognosis and response to treatment is still a challenge in the field of ovarian cancer research. By relying on auto-antibodies present in ovarian cancer patients’ ascitic fluids we aimed to identify tumor specific antigens for diagnostic and therapeutic purposes. To achieve this goal were performed two approaches.
In the first approach systematic and in-depth profiling of ovarian cancer ascites was presented. Ascitic fluids were ranked by their antibody response against cellular antigens in ovarian cancer. Further, human cDNA ORF filtered phage display library was screened with antibodies purified from ovarian cancer ascites in order to identify tumor specific antigens. Phage libraries of open reading frame fragments, created from mRNA derived from various tissues, were used. Here, cDNAs are expressed as fusion proteins with one of the phage coat proteins and exposed on the surface of the phage thus allowing the selection with antibodies present in ascites collected from ovarian cancer patients. Phage display selected peptides were further screened for their immunoreactivity by protein microarray analysis. Further, microarray identified antigens were validated by indirect ELISA. Subsequently, correlation of autoantibodies signatures with known tumor expression of corresponding antigens, prognostic value and patient survival outcome were examined.
In the second approach potential ovarian cancer antigens were identified with SERPA and MS techniques, using ascites of ovarian cancer patient as antibodies source. Specificity of antibodies for identified target protein was confirmed by performing ELISA assay. Candidate antigen was used to correlate antibody level to clinical outcomes and to evaluate their potential CDC mediated activities. Subsequently, recombinant antibodies that target identified antigen were engineered and produced as potential immunotherapy for ovarian cancer.
Il cancro ovarico epiteliale è il quinto tumore più comune nelle donne in tutto il mondo. Ogni anno migliaia di donne muoiono. Essendo asintomatico durante il suo sviluppo, l'EOC viene diagnosticato in fasi avanzate quando si verificano metastasi e il trattamento risulta essere più difficile. Nonostante gli enormi sforzi per identificare nuovi bersagli molecolari per la diagnosi e la cura, il trattamento del cancro ovarico è ancora limitato alla chirurgia citoriduttiva seguita dalla chemioterapia. È ovvio che i nuovi approcci terapeutici devono essere sviluppati immediatamente.
L'identificazione di biomarcatori efficaci per la diagnosi precoce, la prognosi e la risposta al trattamento è ancora una sfida nel campo della ricerca sul cancro ovarico. Facendo affidamento sugli autoanticorpi presenti nei liquidi ascitici dei pazienti affetti da tumore ovarico, abbiamo mirato a identificare un antigene specifico del tumore a scopi diagnostici e terapeutici. Per raggiungere questo obiettivo sono stati eseguiti due approcci.
Nel primo approccio è stato delineato in maniera approfondita e sistematica il profilo dell’ascite del cancro ovarico. I fluidi ascitici sono stati classificati in base alla loro risposta anticorpale contro gli antigeni cellulari nel cancro ovarico. Inoltre, la libreria di visualizzazione dei fagi filtrati del cDNA ORF umano è stata analizzata con anticorpi purificati da ascite del cancro ovarico per identificare antigeni tumorali specifici. Sono state utilizzate librerie di fagi di frammenti di quadro di lettura aperti, creati da mRNA derivati da vari tessuti. Qui, i cDNA sono espressi come proteine di fusione con una delle proteine del phage coat ed esposte sulla superficie del fago consentendo così la selezione con anticorpi presenti negli asciti raccolti da pazienti con carcinoma ovarico. I peptidi selezionati per la visualizzazione dei fagi sono stati ulteriormente analizzati per la loro immunoreattività mediante analisi di microarray di proteine. Inoltre, gli antigeni identificati con microarray sono stati convalidati mediante ELISA indiretto. Successivamente, è stata esaminata la correlazione di autoanticorpi aventi profilo di espressione tumorale conosciuta nota di antigeni corrispondenti, come valore prognostico ed esito di sopravvivenza del paziente.
Nel secondo approccio, i potenziali antigeni del cancro ovarico sono stati identificati con le tecniche SERPA e MS, utilizzando l'ascite del paziente oncologico come fonte di anticorpi. La specificità degli anticorpi per la proteina bersaglio identificata è stata confermata eseguendo il test ELISA. L'antigene candidato è stato usato per correlare il livello degli anticorpi ai risultati clinici e per valutare le loro potenziali attività mediate dal CDC. Successivamente, sono stati progettati e prodotti anticorpi ricombinanti mirati verso l’antigene identificato, come potenziale approccio immunoterapico per il trattamento del cancro ovarico.
1
Chapter 1
1. Introduction
1.1. Ovarian cancer
Ovarian cancer (OC) is the leading cause of mortality among gynecological malignant cancers. It is the fifth most common cancer in women worldwide. Each year, almost 22,000 women are diagnosed with ovarian cancer and more than 14,000 women die from it. Treatment of patients in the late stages of cancer development, when metastasis already occurred, is difficult and gives low probability for survival (2). Unfortunately only 25% of patients are diagnosed at the early stage of cancer development, when cancer is still limited to the ovaries and can be treated by surgery and chemotherapy, which are effective for 80% of patients. About 70% of ovarian cancer cases are diagnosed at late stage and therefore are poorly treatable. Only 30% of them have a relative survival of 5 years (3).
Ovarian cancer can be divided in three types. The most diffuse one is the epithelial ovarian cancer (EOC) that originates from ovary outer surface cells and it accounts for 85% to 90% of all ovarian cancer cases, known as carcinomas. The other types of OCs originate either from germ cells ore from stromal cells (Fig.1) (4).
Fig.1. Ovarian cancer types (5).
OC patients are mostly in the age of 60 years. There is a genetic predisposition to OC since the frequency of patients is higher in families with a history of ovarian or breast cancers. Women who have inherited mutations in BRCA1 or BRCA2 genes have a substantially higher risk to develop ovarian cancer, and at a median age of diagnosis around 40. Inherited mutations in mismatch repair genes (BRCA1 or BRCA2 ) or in ARID1 gene have been reported to be associated with higher risk to develop OCs (6).
2 Nulliparity is a risk factor of ovarian cancer while oral contraception, pregnancy and lactation are associated with a reduced risk. It has been suggested that stimulation of the epithelium of the ovarian surface, which occurs in the nulliparous state as a result of uninterrupted ovulation, may predispose the epithelium to malignant transformation (7).
1.2. Symptoms of ovarian cancer
Ovarian cancer often grows as a complex cystic mass in pelvis. Unfortunately, symptoms are often misled as due to gastrointestinal or abdominal diseases which delays the correct diagnosis at late stages of cancer development. Main symptoms present in the patients are abdominal or pelvic pain (34,7%), increased abdominal girth (31,9%), vaginal bleeding (19,4%), change in bowel habits (16,7%). Other symptoms can be the frequency of urinary stimulus , abdominal pressure, weight gain or loss, decrease of appetite (8). In later stages ovarian cancer can have metastases, which are mostly spread in the peritoneal cavity. Moreover, metastases can be spread by lymphatic vessels to the nodes or to parenchymal organs by blood vessels. On late stages tumor mass can block lymphatic vessels in the abdomen and limit outflow of ascitic fluid (9).
1.3. Classification of ovarian cancer
OC staging is defined by the Gynecology Oncology Committee of FIGO and is accepted in 2006 Stages are numbered from I to IV depending on cancer spreading and metastasis in the organism. In Table 1 are shown the different characteristics for each stage (6).
3 Tab.1. Cancer of the ovary classified by FIGO in 2006.
1.4. Ovarian cancer treatment
Despite progressive development of medical treatment in the last decades, the main treatment methodologies for ovarian cancer remain chemotherapy and surgery. Chemotherapy is given mostly to the patients that are already have metastasized cancer. Established chemotherapy is based on platinum compounds, such as cisplatin or carboplatin, or taxanes such as paclitaxel (Taxol®) or docetaxel (Taxotere®) (10). Carboplatin and paclitaxel are applied mostly in early-stage disease, are supplied in cycles between 3-6 times and can be used in combinations. Carboplatin is the most active medicine in ovarian cancer. Intraperitoneal chemotherapy with high local drug concentration has improved survival of the patients after surgery, but it is burden by side effects such as nausea, tiredness, loos of weight and hair, skin and mucous layer lesions, anemia, immunodeficiency, bleeding and kidney damage. Moreover, chemotherapy is very damaging for organisms, as it targets also normal dividing cells and 50% of treated patients will have disease relapse (9), (11).
Surgical removing of cancer is one of the main treatment approaches but it depends on the stage of cancer. Debulking surgery is often performed with extensive tissue removal including fallopian tube, omentum, bladder and/or spleen.
4 One possible treatment in EOCs is hormone therapy. Luteinizing-hormone-releasing hormone (LHRH) agonists, such as goserelin (Zoladex®) and leuprolide (Lupron®), can be used to repress estrogen production. Other drugs include Tamoxifen, a selective estrogen-receptor modulator (SERM), aromatase inhibitors, such as letrozole (Femara®), anastrozole (Arimidex®), and exemestane (Aromasin®), that block the synthesis of estrogen.
Radiation therapy is another therapeutic option. The currently formats have devastating side effects, such as nausea, diarrhea, skin damage, tiredness (4), but new strategies have been developed based on site specific implantable radioactive devices (reff)..
Thus, there is a cogent need for new more effective therapies as those based on immunotherapy approaches. Increasing evidences support the protective role of the immune system against cancers and the clinical successes of monoclonal antibodies-based immunotherapy (12). In particular, the development of biomarker-driven anticancer-antibodies is considered promising for more personalized cancer therapy. To this respect a number of technologies allow the detection of biomarkers that have the potential to predict response of cancers to particular targeted therapy (13), (14).
2. Biomarkers-based personalized therapy
2.1. Biomarkers
Biomarkers are biochemical or molecular alterations of cellular character that increase in organism as result of normal or pathogenic biological processes or pharmacological responses to a therapeutic intervention and can be detected in tissues, cells or biological fluids. Biomarkers are widely applied in studding cardiovascular, infections, immunological, genetic diseases and cancer (15, 16).
Biomarkers can be DNA, mRNA, proteins or metabolites originated during cellular processes such as apoptosis, angiogenesis or proliferation. They can be produced by sick cells or by other cells of the organism as a reaction to disease or inflammation process. Biomarkers can be described as diagnostic, prognostic or predictive. Diagnostic biomarkers are those used to identify a disease. Prognostic biomarkers are applied once disease is already identified and is necessary to predict probable development or regression of it. Often these biomarkers can represent survival rate of patients. Predictive biomarkers are those that can predict sensitivity of patient to a therapy before treatment is started. Ideal biomarker has to be quickly and easily measurable in biological fluids of patient, represent high analytical sensitivity and specificity, have a long half-life time in the biological fluid and be exclusively correlated to one biological process in the organism (17).
Biomarker-based personalized cancer therapy is a relatively new direction in cancer treatment, which intends to design therapy based on tumor genotypes and patient genetic profiles. Personalized medicine aims to classify cancer based on molecular characteristics, genetic abnormality, mutations and signaling pathway activation of which need to be targeted during treatment. Understanding molecular carcinogenesis will help to treat patients with preferentially targeted substances based on specific molecular profiles found in individual tumor tissues. Development of biomarker-based personalized medicine opens new opportunities for goal oriented treatment but is quit challenging. One of the hardest complications is to translate cancer mutations into related progression of the cancer over time. In spite of this knowledge gap, these recent advances in identifying biomarkers using
5 modern technologies is continuing to make great developments which hold enormous promise for advancing cancer treatment (18).
2.2.
Ovarian cancer biomarkers
Diagnostic of ovarian cancer can be performed using computed tomography (CT) scans, magnetic resonance imaging (MRI) scans, ultrasound studies, laparoscopy, colonoscopy, tissue biopsy. Nowadays only two tests are used for ovarian cancer screening, transvaginal ultrasound (TVUS) and the CA-125 blood test. TVUS test makes possible to look at the uterus, fallopian tubes, and ovaries using sound waves. It can detect tumor formation but it can't actually tell if a mass is cancer or benign. As result of screening, most of the masses found are not cancer (4).
CA-125 protein is an accepted ovarian cancer biomarker. Increased serum levels are related to cancer. CA-125 is a tumor associated protein expressed as a membrane bound protein. CA-125 is mucin-type O-linked glycoprotein and it has been suggested to play a role in cell-mediated immune response. In cancer cells it is shown to suppress anti-tumor immune response. Patients with CA-125 level in blood higher than35 units/ml are considered for the further analysis with potential chance for cancer development. It has been shown that in 99% of healthy women CA-125 is not elevated and remains less than 35. Patient that has ovarian cancer shows CA-125 concentration in blood of hundreds and thousands units/ml. It has been shown that 85% of ovarian cancer patients are having high CA-125 concentration while less than 1% of healthy woman have elevated CA-125. However, specificity of CA-125 as ovarian cancer biomarker is not so accurate and it can show elevation due to the other cancer types or some infectious diseases and give false positive results. Only 50% of patients in the I stage of ovarian cancer development are having elevated CA-125. Nowadays CA-125 is considered to be the only preclinical serum marker to analyze the risk of ovarian cancer developing in diagnostic and an early detection to guide treatment in women known to have ovarian cancer (2).
Some other biomarkers that can give useful information during antiangiogenic therapies of cancer, can be in situ tissue biomarkers, such as microvessel density (MVD), vascular endothelial growth factor (VEGF) and VEGF receptor (VEGFR), neuropilin-1, phosphatidylinositol-glycan biosynthesis class F (PIGF), basic fibroblast growth factor (bFGF), intercellular adhesion molecule 1 (ICAM-1), thrombospondin-1 and p53. However, these biomarkers have some practical limitations as it requires numerous biopsies from primary cancer and metastatic sites to represent dynamic changes before and after treatment. Use of circulating biomarker proteins is less laborious and does not require traumatization of cancer tissue. Certain studies evaluated the level of VEGF in circulating forms but also as urinary biomarkers. It has been shown that low baseline serum VEGF-A levels is correlated with increased response to bevacizumab treatment and improved survival in patients with OC (19). Other known biomarkers are chorionic gonadotropin (hCG), alpha-fetoprotein (AFP), lactate dehydrogenase (LDH). Increased inhibin and hormones such as estrogen and testosterone can be also detected (4).
2.3.
Ovarian cancer ascites for biomarkers identification
New biomarkers for ovarian cancer with higher sensitivity need to be discovered for early diagnosis, prognosis, or monitoring of ovarian cancer. With the significant development of MS and proteomic technologies, protein biomarker identification became an important goal of proteome analysis in different diseases.
6 Analyzing body fluids for biomarkers identification is becoming more usual than tissue biopsy. Study body fluids gives advantages as samples are easy to collect and proceed, it has low invasiveness and minimum cost. Human body fluids used for proteome analyzing can be human plasma, urine, cerebro-spinal fluid, saliva, bronchoalveolar lavage fluid, ascites
Human plasma proteins originate from a variety of tissue and blood cells as a result of secretion or leakage. It has been shown that proteins present in plasma represent physiological or pathological states of the human body and can be used for disease diagnosis and prognosis. Plasma/serum sample preparation is important process as serum protein composition is different from plasma and can be crucial for proteome analysis. Plasma is rich for protein but also very complex fluid where proteins can interact with each other or be bound to other carrier proteins, which make it analyzing very challenging.
OCs at advanced stage are characterized by fast growth of intraperitoneal tumors and accumulation of ascites fluid in the peritoneal cavity. Ascites are due to high secretion by malignant cells of proteins that include growth factors and cytokines that promote neovascularization and increased capillary permeability. (20). As result, ascites fluid represents the local microenvironment of ovarian cancer that contains various cell types, malignant cell, the secretome of ovarian cancer, survival factors, cytokines, chemokines, growth factors, associated with invasion and metastasis. Matte et. al. (21) describe the cytokines profile in 10 ovarian cancer patient ascites. They showed increased expression of several factors including angiogenin, angiopoietin, GRO, ICAM-1, IL-6, IL-6R, IL-8, IL10, leptin, MCP-1, MIF, NAP-2, osteoprotegerin (OPG), RANTES, TIMP-2, and urokinase plasminogen activator receptor (uPAR) . Some of them were associated with shorter progression-free survival. It has been also described that ascites of cancer patients contain different cell population that are playing a role in tumor microenvironment and interact with each other through soluble mediators. Some of the cell populations present in ascites of ovarian cancer patients are cancer-associated fibroblasts (CAFs), infiltrating macrophages/monocytes, bone marrow-derived mesenchymal stem cells (MSCs), and cytotoxic or Treg, tumor-infiltrating CD8+ T cells (22). Analyzing the exact protein content of human ascites can present critical information about ovarian tumor growth, progression, outcome and treatment response, disease surveillance, and potentially early detection. Due to it ascites are an excellent medium for potential biomarkers identification (23-25).
3. Cancer and immunotherapy
3.1. Cancer triggers immune reaction
Several studies demonstrated that immunotherapy might represent a novel valuable therapeutic approach through which T lymphocytes are activated to specifically kill cancer cells. The immune system has a key role in the recognition of self- and non-self- antigens to protect multicellular organism against pathogens. The combination of a variety of T cell receptors (TCRs) together with antibodies from adaptive immunity makes it an extraordinary precise system for the recognition of non-self-antigens.
Cellular transformation resulting in cancer development and progression involves an uncontrolled cell proliferation typically paralleled by a continuous accumulation of gene mutations. Sometimes, mutations in protein-coding genes might result in the generation of a mutant protein, recognized by the immune system as non-self-proteins. This process is mediated by the processing of mutant proteins by APC cells (antigen-presenting cells) and the exposure of these neo-antigens through the MHC-I and -II system. Antigens are than recognized by T cells through their TCRs molecules and, together with
7 other co-stimulating signals, result in T cell activation (26). Importantly, it has also been shown that non-mutated self-antigens can also stimulate the immune system toward self-proteins on cancer cells. Although the precise molecular mechanism(s) responsible for this autoantibodies production is not completely clear, one hypothesis relay on the potential exposure/secretion of proteins normally confined to intracellular compartments and, thus, invisible to the immune surveillance (27), (26).
3.2. Autoantibodies
Autoantibodies produced by organisms against autologous tumor-associated antigens have been detected in different cancer types and can be potentially used as biomarkers for early cancer diagnosis. Most autoantibodies found in the sera of these patients target cellular proteins due to their unusual modifications, abnormal localization, or expression. Therefore, the identification and functional characterization of these immunological ‘reporters’ might also help to uncover the early molecular events during carcinogenesis (28). Antibodies raised against tumor associated antigens (TAA) might therefore represent good candidates in cancer diagnosis due to: i) their early production during carcinogenesis; ii) a single antigen can stimulate the production of TAA by B lymphocytes; iii) their relative long half-life (approximately 21 days in patients’ sera); low-invasive method to obtain biological samples to test; both cheap and low complex analysis of samples. (29).
3.3. Tumor associated antigens (TAA)
Tumor associated antigens can be divided in five groups: the first group is represented by proteins which are only expressed in cancer cells, therefore named tumor specific antigens. These antigens are proteins overexpressed in cancer cells and often are shared among a cohort of patients affected by the same malignancy. A second antigens group comprises antigens that can be expressed in both cancer and normal tissue differentiated cells. These antigens are called tumor associated antigens. The third group is represented by antigens derived by tumor-specific mutations, named tumor-specific antigens (30). These proteins arise from mutations occurring during the uncontrolled cancer cells proliferation, when atypical posttranslational modification, such as phosphorylation, can give rise to tumor-associated antigens (31). It has been shown that TAA are key proteins in triggering immune system activation to target cancer cells (32). However, although most TAA are patient-specific, a number of them are shared by many patients and can then be used in clinic (33).
4.
TAA identification techniques
4.1. Serological proteome analysis (SERPA)
There are several methodologies and approaches to identify new tumor associated antigens, although the identification of antigens triggering the strongest immune response is still a complicated matter. Techniques used to identify new potential antigens can be divided into groups such as serological analysis techniques (SERPA, SEREX, AMIDA), interaction studies (surface plasmon resonance, phage display), array technologies (proteins-, antibodies-, oligonucleotides-, tissue microarrays), proteomic analysis (mass spectrometry, 2D-gel electrophoresis, flow cytometry, liquid chromatography), and gene analyzing technologies (WES, SAGE).
Serological proteome analysis (SERPA) is a method that allows the identification of a whole antigens profile using the antibodies repertoire present in the serological fluids of a single patients (34). This technique is also known as Proteomex or Spear (Serological and Proteomic Evaluation of antibody responses). This technique combines 2D-gel electrophoresis (2D-GE) and Western Blotting (WB) procedures. Cancer proteins are separated by 2D-gel electrophoresis, transferred onto a membrane and
8 incubated with patient sera. Spots on the membrane indicate antibodies-antigens binding and mass spectrometry can be used to identify the target proteins. An important advantage of this technology is that, although proteins undergo denaturation during 2D-GE analysis, allowing the identification of linear epitopes, post-translational modifications such as glycosylation, sumoylation, acetylation, phosphorylation, and others that could be part of epitopes possibly triggering the immune response, are maintained during sample processing (35), (36). However, limitations arise from the inherent limitations of 2D-GE technique. Those are the potential loss of small (<15 kDa), very large (>200 kDa), extremely acidic (pI < 3) or basic (pI > 10), and highly hydrophobic proteins as well as the inability to detect TAA with conformational epitopes due to the denaturing conditions. The group of Francesco Novelli has successfully demonstrated the efficacy of this technique in the prediction of early stages of pancreatic ductal adenocarcinoma (PDAC) by detecting autoantibodies against Ezrin (37).
4.2. Screening of Expression Libraries
The approach based on the screening of cDNA expression libraries has been a powerful technique for TAA discovery and identification. This methodology provides a direct physical association between the protein under analysis and the gene encoding these proteins. Expression libraries can be screened for several purposes (38-41) but those based on the phage-display of filtered ORFs are particularly suitable for screening with antibodies.
Figure 2 schematically illustrates the key points of ORF filtering as described by Zacchi et.al. (38). Briefly, cDNA fragments are cloned upstream the β-lactamase gene and the bacteria transformed by in frame constructs can be selected for ampicillin resistance. ORF filtered library is then Cre-lox recombined to replace β-lactamase gene with the phage gene encoding the pIII coat protein.
Fig. 2. Scheme of the Open Reading Frame(ORF)-filtering approach. Random fragments are cloned upstream of a β-lactamase gene. Clones containing fragments that are ORFs allow the synthesis of a fusion protein that confer ampicillin resistance to transformed bacteria. After selection on ampicillin, the β-lactamase gene can be removed by passage through bacteria expressing Cre recombinase. The selected ORF can then be displayed on phage (38).
9
4.3. Display systems
The concept of expression library can be readily applied to the display systems. Display technology refers to a collection of methods for creating libraries of modularly coded biomolecules that can be screened for desired properties in a high-throughput format on a global scale. It allows to analyses large-scale of protein–protein/protein– substrate interactions. Main advantages of this system are, that the selected protein can be immediately characterized and identified by a simple DNA sequencing reaction; and the gene encoding protein of interest can be manipulated with all the tools provided by molecular biology and genetic engineering techniques. Thus, allowing isolation and identification of specific proteins and related genes from a background of billions of unreactive clones (39).
Major formats include: i) Peptide-on- DNA/RNA display. These are cell-free display systems where DNA or RNA are capable to bind its own coded peptide. Thus, permitting a screening of a large pool of complexes and identify the interactors by isolation and sequencing of nucleotide sequences of either DNA or RNA. ii) Phage display: it is one of the most commonly used display system. Here the gene of interest is cloned into the coding sequence of viral coat proteins and expressed as fusion with a surface protein of the phage; ii) Cell based display: here the cDNA library encoding various proteins is recombinant expressed in cultured cells and selected for binding to a specific ligand on the cell surface. Yeast two hybrid system is the most popular among this category due to the high efficiency of transformation.
4.4. Phage Display
Phage display is technique applied for high-throughput screening of protein–protein, protein–peptide, and protein–DNA interactions that make a use of filamentous bacteriophages, that couple phenotype to genotype. Phagemids are Ff-phage-derived vectors containing origin of replication of a plasmid, selection marker, intergenic region, a gene encoding for phage coat protein, multiple cloning site, promoter and a DNA segment encoding a signal peptide. Proteins, peptides or polypeptides are exposed on the surface of filamentous M13 derived bacteriophage. This system allows the selection and isolation of novel interactors for its binding property to a given protein from a collection of billions of phages.
Depending on the particular application, phage display system makes a use of Ff filamentous phage, Lambda or T7. The most used one is Ff filamentous phage family (M13 and its close relatives fd and fl) due to it robust and highly flexible platform for display. Generally, the DNA fragments are cloned upstream to the gene encoding the pIII or pVIII coating proteins and are present as a single copy. The major differences between type III and type VIII phagemids are the length of foreign protein, the copy number of the displayed foreign proteins in the progeny phages and the influence of infection of progeny phages. Type VIII phagemid is used for small protein of interest and can produce hundreds or thousands of new copies. On the other hand, type III phagemids are used for large proteins and produce 5 copies of fusion proteins.
Phagemids can be converted to filamentous phage particles by co-infection with the helper phages. Firstly the phagemid, encoding for protein of interest, must infect Escherichia coli strain. Inside
E.coli, the single-stranded DNA (ssDNA) of phagemid particles can be converted into replicative form
of the phagemids by the host RNA and DNA polymerases and topoisomerase. Phage replicative origin is activated only when E.coli is co-infected with helper phage. Consequently phages will be produced and released from bacteria.
10
4.5. Publication: Phage display technology for human monoclonal
antibodies
Dal Ferro Marco1, Rizzo Serena1, Rizzo Emanuela1, Marano Francesca1, Luisi Immacolata1, Tarasiuk Olga1 and Daniele Sblattero1 *
TITEL
Phage display technology for human monoclonal antibodies AUTHORS AFFILIATIONS
1 University of Trieste, Department of Life Sciences, Via L. Giorgieri 5, 34127 Trieste, Italy 2 University of Eastern Piedmont; Department of Health Sciences and IRCAD, Novara, Italy * Corresponding author.
Prof. Daniele Sblattero Department of Life Science,
University of Trieste, Via L. Giorgieri 5, 34127 Trieste Italy,
Telephone +39 040 5588681 FAX: +39 040 558 2134 E-mail: [email protected]
i. Running Head
Making and selection of phage display antibody libraries ii. Abstract
During the last 20 years in vitro technologies opened powerful routes to combine the generation of large libraries together with fast selection and screening procedures to identify lead candidates. One of the most successful method is based on the use of filamentous phages. Functional Antibodies (Abs) fragments can be displayed on the surface of phages by fusing the coding sequence of the antibody variable (V) regions to the phage minor coat protein pIII. By creating large libraries, antibodies with affinities comparable to those obtained using traditional hybridoma technology can be isolated by a series of cycles of selection on the antigen of interest. In this system, antibody genes can be recovered simultaneously with selection and can be easily further engineered, for example by increasing their affinity to levels unobtainable in the immune system, or by modulating their specificity and their effector functions (by recloning into a full-length immunoglobulin scaffold). This chapter describes the basic protocols for antibody library construction and selection of binder with desired specificity.
iii. Key Words: phage display; antigens; monoclonal antibody, high-throughput; scFv 1. Introduction
Traditional methods to generate monoclonal antibodies rely on the immunization of laboratory animals and the subsequent immortalization and selection of specific hybridoma cells. The process is laborious, requires costly animal houses and its efficacy depends on the ability of the immune system to mount a humoral productive response to the potential antigens. The advent of recombinant DNA technology has brought in the field new potentialities allowing to recapitulate in vitro the complete process of antibody production and selection, by-passing immunization, animal handling and the laborious process of clone isolation. The great advantage of in vitro methods is the possibility of coupling together the cloning of functional antibody fragments, their selection and finally the isolation of the positive
11 antibodies coding genes. In vitro methods allow to identify antibodies with high throughput potential, speed and flexibility: antibodies can be selected and their affinities and specificities can be precisely tailored according to the needs. Phage (1, 2) and yeast display (3, 4) are the commonest methods for this purpose.
In 1985, G.P. Smith (5) first introduced the concept of displaying exogenous proteins on the surface of M13 phages, showing the potentials of building phage libraries displaying large repertoires of different proteins. Antibody display libraries have been the most successful application of this concept (6). The basic idea behind the display technology is that once a large library of antibodies is created, those with desirable properties can be selected. A phage displaying a specific antibody on its surface can be isolated for its binding property to a target ligand starting from a collection of billions of phages displaying different antibodies. Since the phage displayed protein gene is present in the phage genome, the selection of a virus allows the concomitant recovery of the corresponding antibody gene. Once isolated genetic details are easily identified by DNA sequencing and the sequence could be used for subsequent applications (see figure 1). [Fig.1 near here]
To carry out this procedure a few essential steps are required.
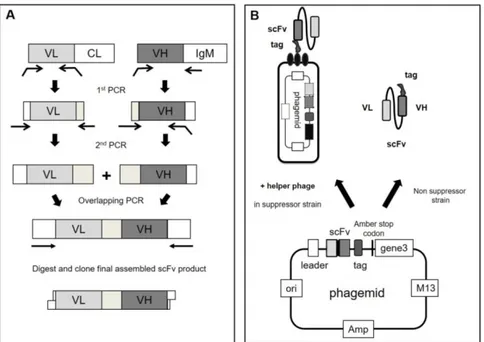
First, a library containing the antibody DNA sequences is created. Antibody diversity is restricted to the variable regions (VH and VL) and these gene fragments are inserted into a specific vector in frame with the sequence encoding the phage protein pIII. Once assembled, the phage particle will expose the functional antibody fragment fused to the amino terminus of the minor coat protein III. In the creation of an antibody library several different choices can be made: a) which form of antibody fragment to use; b) the source of V regions repertoire. In general, successful approaches have employed either the single chain fragment variables (scFv) (7) format, consisting in a VL and VH regions linked by a flexible linker, or the Fab (Fragment antigen-binding) format, in which VH-CH1 and VL-CL associate non-covalently (8).
Natural V region repertoires can be recovered by RT-PCR amplification starting from lymphocytes which may or may not have undergone antigen stimulation. Such V genes are amplified using primers which recognise the 5’ end of the V genes and the 3’ end of the J genes (9). These naïve libraries turned out to be robust sources of antibodies potentially against any target (10–12), including those poorly antigenic in animals. As an alternative, synthetic antibody libraries have been created by introducing diversity artificially using oligonucleotides into frameworks with desirable properties (13–15). To generate diversity, completely degenerate oligonucleotides were used (16), although recently it has been found that diversity restricted to only few amino acids can provide antibodies with similar high affinities (17).
Before proceding to selection the clonal diversity of the library, either naïve or synthetic, needs to be assessed. Next generation sequencing is now routinely used to measure diversity and to validate the design of displayed libraries (18).
Once a library is created, the enrichment of antigen specific phage antibodies is carried out by ‘phage panning’, using immobilized (19) or labeled antigens (20).
[Fig 2 near here].
In this process, the antigen of interest is directly immobilized on a solid support, such as microplate wells or is coupled to magnetic beads. The phage particles are then added to allow the binding of phages displaying appropriate antibody. After extensive washing to remove all non-specifically bound material, phages displaying specific antibodies are retained while low affinity or unspecific phages are washed away. The selection procedure is repeated two to five rounds usually decreasing antigen concentration and increasing stringency of washing steps, leading to the isolation of phages expressing the desired
12 antibodies (i.e. those that bind the antigen of interest). Bound phages are then eluted from the target antigen and used to infect bacteria for binding analysis. The possibility to perform successive rounds of selection allow the isolation of binders present in very low number in a population of billions of different phages. A typical selection round is illustrated in figure 2. At the end, specific antibodies for a given antigen are identified through an ELISA screening within several random clones. At this point, as antibody genes are directly identified by sequencing they can be subjected to downstream genetic engineering, for instance to increase affinity (through the generation of mutated antibodies secondary libraries) and/or to build full-length immunoglobulin with the desired effector functions.
2. Materials
2.1 Construction of Antibody Libraries
1. Bacterial strain used is Escherichia coli DH5 F’ [F’/endA1 hsd17(rK_mKþ) supE44 thi-1
recA1gyrA (Nalr) relA1 _(lacZYA-argF) U169 deoR (F80dlacD-(lacZ)M15)].
2. Ficoll-Paque PLUS (GE Healthcare).
3. Plasmid DNA is prepared using a commercial Miniprep kit, following the instructions of the manufacturer.
4. Stock solutions of antibiotics are prepared by dissolving kanamycin at 50 mg/mL in water and ampicillin at 100 mg/mL in water. Kanamycin and ampicillin stocks are filtered with 0.22 µm filter device and stored at –20°C. Repeated freeze and thaw of ampicillin is avoided, and aliquots are prepared for single use.
5. 2xTY (2x Tryptone Yeast) liquid broth is prepared adding 16 g tryptone, 10 g bacto-yeast and 5 g NaCl to 1 L of ddH2O. Final pH 7.0. Agar plates are prepared by adding 1.5% bacto-agar to 2xTY broth. Make up to 1 L with distilled water, autoclave and allow to cool to 55°C. At this temperature antibiotics and glucose can be added, prior to pouring into plates. 6. Glycerol molecular biology grade, (60% v/v), autoclaved.
7. All restriction endonucleases, T4 DNA ligase and buffers are purchased from New England Biolabs. All cloning steps are performed according to the manufacturer suggestions and to standard molecular biology procedures.
8. Commercial Gel Extraction Kit and PCR Clean-Up Kit are used for purification of DNA from agarose gel and restriction reaction mixtures, respectively, following the instructions of the manufacturer.
9. Commercial DNA clean and concentrator kit is used to purified and concentrate the ligation mixture, following the instructions of the manufacturer (see Note 1).
10. High-efficiency Electrocompetent Cells for Phage Display are used for transformations. 25 µL aliquot is used for transformation of 1-2 µL of purified DNA, using 1 mm gap cuvette (see Note 2).
2.2 Phage Production and Titration 1. Helper phage M13KO7.
2. Solution for precipitation of phages: 20% (w/v) polyethylene glycol (PEG) 6000 and 2.5 M NaCl. The solution is filtered through a 0.22 µm filter before use, store at room temperature. 3. PBS: 8 g NaCl, 0.2 g KCl, 1.44 g Na2HPO4 and 0.24 g KH2PO4 in 1 L H2O, final pH 7.4.
13 4. 20% glucose: filtered with 0.22 µm filter device and stored at room temperature.
5. 2xTYAG (2xTY Ampicillin Glucose): add 100 µg/mL ampicillin and 1% of glucose to 2xTY liquid broth.
6. 2xTYAK (2xTY Ampicillin Kanamycin): add 100 µg/mL ampicillin and 50 µg/mL kanamycin to 2xTY liquid broth.
2.3 Phage selection to immobilized Antigen 1. Immuno MaxiSorp Tubes.
2. Antigen of interest dissolved in either carbonate buffer (pH 9.6) or PBS at a concentration of 1-100 µg/mL.
3. Carbonate buffer: mix 0.1 M Na2CO3 and 0.1 M NaHCO3 until pH 9.6. 0.1 M Na2CO3, 10.6 g Na2CO3/liter H2O; 0.1 M NaHCO3 8.4 g NaHCO3/L H2O.
4. PBS-Tween-20: add 1 ml of Tween-20 per liter of PBS. 5. 2% MPBS: 2 g non-fat milk powder /100 mL PBS. 6. 4% MPBS: 4 g non-fat milk powder /100 mL PBS.
7. 100 mM triethylamine (TEA): 140 µL triethylamine/10 mL H2O. Prepare fresh; pH 12. 2.4 Immunoprecipitation with magnetic beads
1. Biotinylated antigen,100-500 nM, best done using a commercial kit. 2. Streptavidin-coupled Dynabeads M-280 (Invitrogen).
3. Small magnets designed for fitting of 1.5-2 mL tubes.
4. 100 mM triethylamine: 140 µL triethylamine/10 mL H2O. Prepare fresh; pH 12. 5. 1 mM DTT (1,4-Dithiothreitol).
2.5 Phage ELISA
1. Antigen: 1-100 µg/mL dissolved in either carbonate buffer or PBS.
2. For antigen immobilization done by absorption to MaxiSorp 96-well plates
3. Anti-phage mAb horseradish peroxidase (HRP)-conjugated used at a final dilution of 1:5000 (GE Healthcare).
4. TMB (3,3′,5,5′-tetramethylbenzidine) ready-to-use, pre-mixed solution for colorimetric HRP-based ELISA detection.
5. 2 N sulfuric acid: 55.6 mL 97% sulfuric acid dilute up to 1 Liter H20. 2.6 Soluble ELISA
1. Antigen: 1-100 µg/mL dissolved in either carbonate buffer or PBS. 2 MaxiSorp 96-well plates for antigen immobilization by absorption.
3. Monoclonal antibody anti-immunoaffinity tag (e.g., 9E10 anti-myc, anti HIS6, anti V5) for detection of soluble scFv.
14 4. Horseradish peroxidase (HRP)-conjugated anti-mouse IgG.
5. 3,3′,5,5′-tetramethylbenzidine ready-to-use, pre-mixed solution for colorimetric HRP-based ELISA detection.
6. 2 N sulfuric acid: 55.6 mL 97% sulfuric acid dilute up to 1 L H20. 3. Methods
3.1 V genes amplification from peripheral blood lymphocytes
A library with the maximum antibody diversity could be generated by amplifying naturally rearranged V genes. There are two requirements: the availability of peripheral blood lymphocytes (PBLs) from several non-immunized donors and a set of PCR primers able to amplify all known VH, Vκ, and Vλ gene sequences (9, 21).
1. Samples of human PBLs are purified by density gradient centrifugation on Ficoll Paque PLUS and are used as starting material (see Note 3).
2. Total RNA is prepared by using a commercial kit. The quality of the RNA preparation must be checked on an appropriate gel.
3. cDNA is synthesized using Reverse Transcriptase and random hexamer primers starting with 1 µg of total RNA in a final volume of 20 µL following instructions provided.
4. VH genes are amplified by PCRs and a reaction should be carried out for each individual VH-Back primer (as described in (9)) in order to amplify even rarely occurring VH genes. VH back primers are paired with an IgM constant-region primer.
Reactions are performed using 1 µL of cDNA as template, with a High-Fidelity DNA Polymerase, in a volume of 50 µl. Cycling parameters are 98°C for 10 sec (denaturation), 65°C for 30 sec (annealing) and 72°C for 30 sec (extension) for 31 cycles. All 50 µL are loaded on a 1.5% agarose gel and purified using a purification kit.
5. Vλ and Vk genes are similarly amplified (using individual VL-back primers with the mix of VL-for primers) from random primed cDNA with the same cycling parameters. All 50 µL are loaded on a 1.5% agarose gel and purified using a purification kit.
6. Pull through PCR of amplified V regions. V regions amplified from cDNA are re-amplified to increase the amount available for cloning as well as to add extra DNA sequences (e.g. restrictions sites) at each end. As the starting template is a PCR fragment this amplification tends to be extremely efficient. VH (and VL) purified genes are pooled equally and re-amplified using external primers (see fig 1B) in 50 µL reaction volume using 5 ng of purified VH (other parameters as above). All 50 µL are loaded on a 1.5% agarose gel and purified. 7. The scFv library is generated by mixing equal amounts (5-50 ng) of VH and VL genes and performing a two-step overlapping PCR, essentially as described in (22): 8 cycles of PCR without primers followed by 25 cycles in the presence of external primers. Cycling parameters are 98°C for 10 sec (denaturation), 60°C for 30 sec (annealing) and 72°C for 30 sec (extension). At least 5 assembly reaction of 50 µl should be set up and product purified on a 1.5% agarose gel.
3.2 Ligation and electroporation of ScFv library
In general, the diversity of a library is limited by the amount of vector/insert used and by the transformation efficiency of bacteria. The largest libraries require hundreds of electroporations to generate the required diversity (see Note 4).
15 1. Both phagemid cloning vector pDAN5 (12) and purified scFv fragments are sequentially digested, with BssHII restriction endonuclease for 2 h at 50°C and then with NheI for 4 h at 37°C. Efficient digestion with both enzymes is crucial to avoid self-ligation of the vector. Vector is loaded on an agarose gel and gel purified using a purification kit. scFv inserts are purified using clean up kit.
2. Ligation reaction is prepared as follow: double-digested and purified vector 2–5 μg, double digested and purified scFv 1-2.5 μg (phagemid:insert molar ratio of 1:3); T4 DNA ligase; 1X DNA ligase buffer. Incubate reactions at 2 h at 22°C and then at 16°C overnight (see Note 5). 3. Clean up and concentrate ligation using a commercial kit.
4. Elute the DNA in ultrapure H2O.
5. The ligation mix is electroporated into Electrocompetent Cells. The number of total electroporation should be determined calculating the number of transformants obtained with a single electroporation. (see Note 6).
6. Transformations are pooled and plated on 2xTYAG 15 cm plates and grow O/N at 25-28°C to obtain a primary library. Make dilutions to estimate library diversity.
7. The next day colonies are scraped up in 2xTY 20% glycerol and frozen down in 1 mL aliquots and some small working aliquots of 100 µl.
3.3 Rescuing phagemid particles from libraries
Growth of phagemid libraries requires the use of helper phage, which provides all the other proteins needed to produce the phage particles. The helper phage has a disabled or weaker packaging signal than that of the phagemid vector and provides all the proteins required for phagemid replication, ssDNA production and packaging. The different clones of the library have very different effects on bacterial growth rates, therefore library amplification should be minimized to prevent bias towards the least toxic clones.
1. The starting culture should contain at least ten times more clones than the original library diversity but should not exceed OD 600nm 0.05. For most rescues, the inoculum is therefore 30-300 µL of the glycerol stock (or concentrated solution of bacteria scraped from plate). The inoculum should be placed in an appropriate volume of 2xTYAG in a sterile flask 5-10 times bigger than the culture volume.
2. Grow with shaking (250 rpm) for 1.5-2.5 h at 37°C, to an OD 600nm of 0.5. Check the OD regularly so not to overgrow the cells (once reached this OD, cells are into the mid-log phase and they express the F-pilus for infection) (see Note 7).
3. When an OD 600nm of 0.5 is reached, add a 20-fold excess of helper phage (consider culture concentration as 5x10⁸ cells/mL). Leave at 37°C for 45 min, standing with occasional shaking.
4. Spin the cells for 15 min at 4,000 g. When bacteria need to be kept vital, they should be spun no greater than 4,000 g. When they are to be removed to collect supernatant, higher g forces can be used.
5. Discard the supernatant.
6. Dissolve the bacterial pellet in a volume 5 times greater than the initial culture volume of 2xTYAK. Grow shaking (250 rpm) overnight at 28°C, using enough flasks to ensure that the flask volume is 5 times greater than the culture volume.
7. The following day bacteria are centrifuged at 7,000-10,000 rpm for 25 min at 4° C. The supernatant, containing phages, is collected and subjected to PEG precipitation.