DIGITAL SURVEY TECHNIQUES FOR THE DOCUMENTATION OF WOODEN
SHIPWRECKS
E. Costa a *, C. Balletti a, C. Beltrame b, F. Guerra a, P. Vernier a
a Università Iuav di Venezia, S. Croce 191, 30135 Venezia, Italy – (balletti, ecosta, guerra2, vernier)@iuav.it) b Università Ca' Foscari Venezia, Dorsoduro 3484/D, 30123 Venezia, Italy – [email protected]
Commission V, WG V/2
KEY WORDS: Cultural Heritage, Nautical Archaeology, Multi-image Photogrammetry, Laser Scanner, Point clouds, 3D Modelling
ABSTRACT:
Nowadays, researchers widely employ the acquisition of point clouds as one of the principal type of documentation for cultural heritage. In this paper, different digital survey techniques are employed to document a wooden ancient shipwreck, a particular and difficult kind of archaeological finding due to its material characteristics. The instability of wood and the high costs of restoration do not always offer the opportunity of recovering and showing the hull to researchers and public and three-dimensional surveys are fundamental to document the original conditions of the wood. The precarious conditions of this material in contact with air could modify the structure and the size of the boat, requiring a fast and accurate recording technique. The collaboration between Ca' Foscari University and the Laboratory of Photogrammetry of Iuav University of Venice has given the possibility to demonstrate the utility of these technology. We have surveyed a sewn boat of Roman age through multi-image photogrammetry and laser scanner. Point clouds were compared and a residual analysis was done, to verify the characteristics and the opportunity of the two techniques, both of them have allowed obtaining a very precise documentation from a metrical point of view.
* Corresponding author
1. INTRODUCTION
New sensors, methodologies and multi-resolution 3D representation are improving the reality-based techniques existent, permitting the growth of documentation, research and studies in cultural heritage (Remondino et al., 2010).
Structure from Motion (SfM) photogrammetric technology has inevitably created great interest amongst the archaeological community because it allows the use of consumer grade digital cameras and highly automated data processing (Canciani et al., 2003; McCarthy, 2014; Remondino et al., 2012). SfM photogrammetry moreover offers the possibility of fast, automated and low-cost acquisition of 3-D data, which represents a very accurate documentation, from a metrical point of view. Moreover, in extreme situation, where the priority is, for example, to re-cover an ancient boat in a short time in order not to stress the wood, SfM is the answer for a quick and fast documentation and to collect the essential images in few hours (Koutsoudis et al., 2014; Mahiddine et al., 2012; Yamafune, 2016; Zhukovsky et al., 2013).
The use of points clouds to record cultural heritage is known in recent years to document sites and findings (De Reu et al., 2013; Remondino et al., 2010). The points clouds could be acquired by different techniques, as laser scanning and photogrammetry. The last one, compared to the first, which is also very fast, does not require expensive equipment, but only a simple camera. The comparison of these results wants to verify the characteristics and the opportunities of each one.
The high detailed digital three-dimensional model give us the possibility to carefully study the characteristics of the construction of the ancient ships, after re-covering the boat, and to reconstruct its original shape, straightening and rebuilding
the warped part and making hypothesis of the missing extremity.
2. THE ARCHAEOLOGICAL SITE
In 2014, the Archaeological Superintendency of Emilia Romagna decided to excavate some wooden elements of a boat, previously exposed in 2008 during a test excavation, near the remains of the 6th century church of Santa Maria in Padovetere, in Valle Pega (Berti, 1990). The archaeological site is 4.5 km west of the city of Comacchio (Ferrara) on a branch of the ancient Po river, the Padovetere (Balista et al., 2007; Calzolari, 2007). The superintendency has coordinated the excavation and the documentation of the archaeological site and Ca' Foscari University and the Laboratory of Photogrammetry of Iuav University of Venice have coordinated the operation of survey, documentation and study of the wooden boat.
From the first few days of excavation in 2014, the Superintendence has realized that the relative good conditions of the wood and the dimension of the hull could have required more time of investigation. In 2014, the mission lasted three month due to limited budget and a big portion of the boat has been excavated (figure 1).
The boat lays on the ancient bank of a river, on a slope from 0.70 to 3.00 m from the actual ground level, in various layers of terrain, principally sand and clay, which have caused two different conservation of the wood. Complete studies about the stratigraphy of the entire site have been made by archaeologists and they will not be debated in this paper. Under the sandy upper layer, the wood was decayed, due to the aerobic characteristics of this material; instead, the wood of the lower level of the boat, conserved in a compact grey clay, was perfectly conserved. It is possible to see the different colours of
The International Archives of the Photogrammetry, Remote Sensing and Spatial Information Sciences, Volume XLI-B5, 2016 XXIII ISPRS Congress, 12–19 July 2016, Prague, Czech Republic
the wood in figure 1: the upper portion of the wood is brown-red and the lower one is dark-brown.
Figure 1. The archaeological site at the end of the excavation in 2014.
The boat lays on the oblique bank of the river, consequently, the bottom is diagonal in the upper layer of the excavation and the side is located in the lower layer. This particular disposition have allowed the perfect conservation of one complete side of the hull; the boat turned out to be an important case of study, because naval archaeologists usually recover only bottoms and little portions of sides.
At the end of the first campaign, a new mission for September 2015 has been organized to excavate the entire hull. The new portion of the hull laid in the compact grey clay layer, near the aquifer level, so the hull exposed was in perfect conditions; we find the entire extremities with the post until the upper element and a portion of the other site collapsed down, but almost in position with the post (figure 2).
Figure 2. Archaeological site at the end of the excavation in 2015.
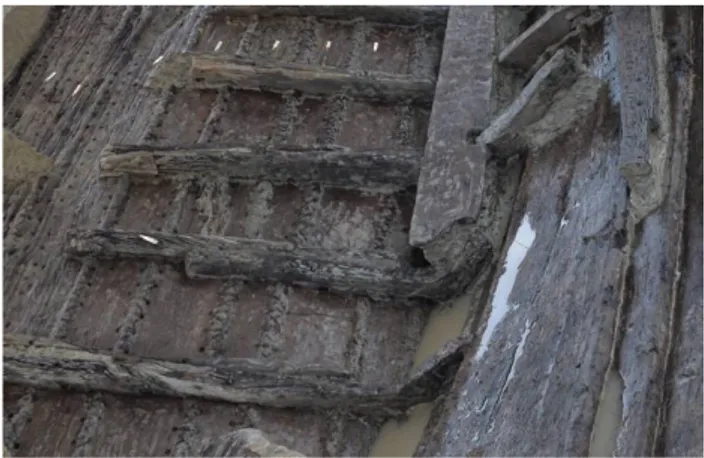
The boat is assembled with the sewn technique, with a typical pattern XIIXII, and presents a flat bottom that form an angle of 130° with the sides (figure 3). The last two planks of the side are not sewn, but are overlapped and jointed with iron nails, as in the clinker construction. The bottom measures 2.90 x 17 m, the side is high 1.45 and the post has a length of 3.60 m, disposed at 45° with the bottom; the complete extension of the boat is 20 m between the extremities.
Figure 3. Portion of the bottom and of the side.
3. THE DOCUMENTATION
During the excavations, it has been possible to document each single phase by using three-dimensional digital techniques. Every archaeological site or finding and every different study require a specific technology; first archaeologists have to analyse the context of excavation and the object, second they have to know the economic possibility and he timing of the project. After this kind of evaluation is possible to understand the appropriate 3D recording technology and the appropriate representation and format of the results (Gonizzi, 2014). Laser scanning survey and multi-image photogrammetry have been carried out during the survey and the data have been integrated and compared after the excavation, during the analysis of the results.
3.1 Multi-image photogrammetry
There are a range of SfM tools now available. PC software, smartphone and web-based apps usually provide similar services for 3-D model generation but differ in the range of post-processing options. Nevertheless, a distinction can be made between solutions that upload images to companies’ servers to be processed and provide a download of the results afterwards and tools that actually process the data on the local machine (Michieletti et al., 2015).
We have realized several documentation with multi-image photogrammetry, for both the campaign of survey, following the rules of the stratigraphic excavation: three in 2014 and two in 2015. Image acquisition is the phase of the process operated on the field and the elaboration of the data take place with the computer in the office (De Reu, 2013). But we usually first elaborate the data acquired at low resolution with a laptop just after the acquisition of the images, to check the wholeness of the image network.
After that, the images have been processed at “Ultra High resolution” with the commercial application Agisoft Photoscan Professional Edition to be aligned and to create a sparse point cloud. State of the art indicate various software that employ algorithm for matching images, as SURE, MicMac snd PMVS, etc. (Gonizzi et al., 2013); we use software Photoscan and Zephir Aerial to align the images of our case studies. Three other phases of photogrammetry have been realized to complete the survey: create dense point cloud, build mesh and build texture. The process to obtain the 3D model is fully automated (De Reu et al., 2013), but the photographs have to follow the typical and correct images network, with an overlap about 60%
The International Archives of the Photogrammetry, Remote Sensing and Spatial Information Sciences, Volume XLI-B5, 2016 XXIII ISPRS Congress, 12–19 July 2016, Prague, Czech Republic
between images, and 20% between the three strips (figure 4). We have realized one photogrammetric block of radial images around the site and two photogrammetric blocks of nadiral images as in aerial photogrammetry. Some other detailed images have been made from different views to cover all the details of the wooden boat.
Figure 4. Disposition of the camera shooting
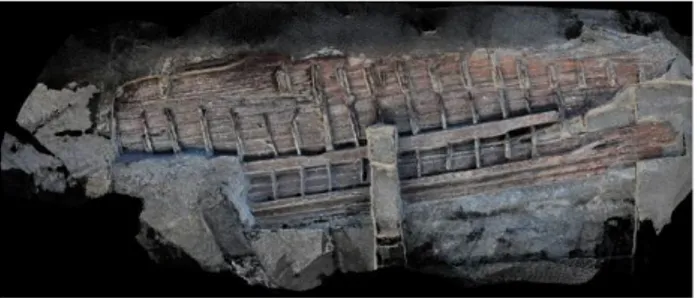
In 2014, we have realized three photogrammetric models of the portion exposed, during all the period, to represent the different phases of the excavation (figure 5) and in 2015 we have documented the portion of boat recently exposed after the excavations, since this part belong to the same stratigraphic unit. In 2015, we have documented also the entire boat to compare the survey to the 2014 documentation and to verify the condition of the wood (figure 6).
The two photogrammetric survey have been merged by using a topographic survey; a set of GCPs were surveyed with a total station. Both in 2014 and in 2015, B/W targets were positioned on and around the hull during the first mission, to be surveyed by total station. These have allowed to align the two surveys data in the same reference system.
Figure 5. Multi-image photogrammetric model of the boat in 2014.
Figure 6. Multi-image photogrammetric model of the boat in 2015.
3.2 Laser scanner
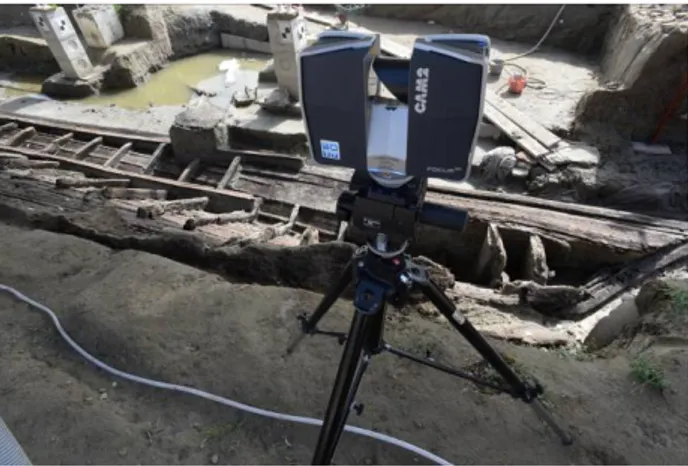
The three-dimensional documentation has been realized also with a laser scanner Faro Focus 3D to investigate the hull (figure 7). This technology, surveying at 360°, allows documenting the entire context around and the archaeological site.
In the two laser scanning measurement campaigns, a total of 22 scans (10 scans in the first mission in 2014 and 12 scans in the second one) were carried out to represent the entire hull and the details of the wooden elements of the structure. Every scan creates a point cloud, for about 600 million points, which have been fitted together positioning B/W targets on the site as GCPs, to georeferenced the clouds in the same reference system with topographical survey (figure 8).
As for the multi-image photogrammetry we have made a scan session at the end of the work in 2014 (figure 9) and one at the end of the excavation in 2015.
Each scan takes about 8 minutes and has a density of one point every 6mm (on a distance about 10 meters). Consequently, at the end of the alignment, we have obtained a merged scan with an average density of at least one point every 2mm.
The laser instrument used has a linear accuracy of ± 2mm and a range between 0.6m and the 120m; it acquires 1 million points per second.
Figure 7. Laser scanner during the survey.
Figure 8. Topographic survey of the control points with total station.
The International Archives of the Photogrammetry, Remote Sensing and Spatial Information Sciences, Volume XLI-B5, 2016 XXIII ISPRS Congress, 12–19 July 2016, Prague, Czech Republic
Figure 9. Point cloud from laser scanner. 3.3 Data processing
3.3.1 Point clouds: Point clouds produced by laser scanning and by photogrammetry were fitted together to show the difference between them. First, we have oriented the two point clouds with the targets placed on and around the boat in the same reference system. We have controlled the accuracy of every point clouds, checking the x y z coordinates of the ground control points and we have align the different clouds.
With Cloud Compare software, two comparison were performed: the first one considering the model of 2014 and of 2015 coming from the photogrammetry, and the second between the two model from laser scanner survey. In a range of the scale from 0 to 3 cm, from blue to red colour, we have found differences around 1.5 cm, show in green in the followings model (figure 10, figure 11). Just because most of the part is in blue colour and some little portions in green, it’s clear that the two models fit and little differences are due to the deformation of the wooden structure one it was in contact with the air.
The red parts in the two comparisons do not represent an error, but they correspond to the part of the boat excavated during 2015 mission and not present in the 2014 model; the points in this position acquire red colour, due to the absence of the data, over 3 cm of the fixed scale.
Figure 10. Comparison between point clouds 2014 and 2015 by laser scanning survey.
Figure 11. Comparison between point clouds 2014 and 2015 by photogrammetry.
3.3.2 Orthophoto and drawings: From the points clouds of the laser scanning survey and from the textured model of the photogrammetry it is possible to extract some orthophotos, employed to understand the correct position of the boat in the excavation. In this paper, we show only some of them: the plan (figure 12) and the front of the boat (figure 13) from the documentation at the end of 2014.
Figure 12. Orthophoto of the plan of the hull in 2014
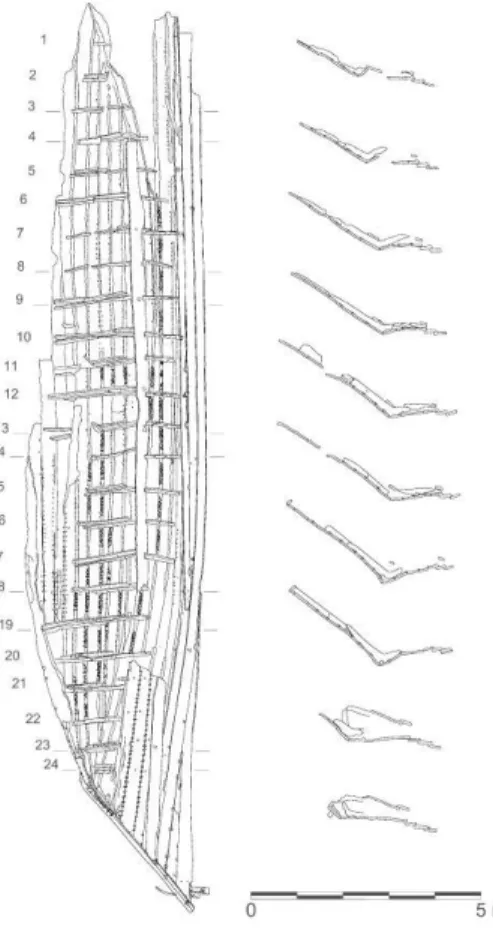
Figure 13. Orthophoto of the prospect of the hull in 2014. We have realized the plan of the site from the orthophoto of the model and the sections in correspondence of ten frames, as usual in archaeological drawing (figure 14). These are only some of the documentation that could be derived from 3D surveyed and modelled data. Therefore, various aspect of the study could be investigated thought the different results of the survey: measuring, conservation, preservation, reconstruction of the missing part, etc. (Gonizzi et al., 2013).
The International Archives of the Photogrammetry, Remote Sensing and Spatial Information Sciences, Volume XLI-B5, 2016 XXIII ISPRS Congress, 12–19 July 2016, Prague, Czech Republic
Figure 14. Plan and sections of the hull.
3.3.3 Virtual model: 3D modelling software, as 3D Studio, Rhinoceros, Maya, etc., are widely employed to elaborate point clouds and meshes and to recreate the reality of an archaeological site (Remondino et al., 2010).
A virtual three-dimensional model is created from the point clouds, to which is applied a texture. From this, we have drawn every wooden element based on the real shape of them (figure 15, figure 16).
The presence of a high precision virtual three-dimensional model (with an accuracy near 0.005 m) will give us the possibility to rotate and arrange the boat in its sailing trim, creating lines drawings based on the real shape of the hull (Martorelli et al., 2014). It will be possible, in further research, to straight and rebuild the collapsed part of one the extremities and making hypothesis of the other one. With the reconstruction of the original shape, it will be possible calculate the hydrostatic qualities of the boat and to make some studies on the weight of the cargo carried and other different technical and nautical analysis.
Figure 15. 3D vectorial model of the entire hull.
Figure 16. Projection of the textured mesh into a plane and vectorial drawing.
4. CONSIDERATION
As Martorelli et al. (2014) suggest, documentation of maritime heritage is essential for its protection, and for reference in restoration and renovation processes. These functions can represent a problem in the case of shipwrecks that lack lines drawings. Our purpose wanted to describe a procedure for the creation of 3D model based on the shape analysis of surviving remains of ancient boats. Properties of virtual digital technologies are: accuracy, portability, low cost and fast acquisition (Remondino et al., 2010); every of these characteristics is essential in archaeological sites, especially for wooden boat, due to the particular material type and detailed structure.
This experimental study has demonstrated that multi-image photogrammetry can be a very useful tool for archaeology, and is likely to become more important in the future. The high speed and simplicity of acquisition allows it to be used in situations where slower or unwieldy technology would be inappropriate, allowing, for example, the capture of models of features being excavated without slowing down the excavation (McCarthy, 2014).
Nowadays, three-dimensional survey techniques are widely employed in recent years on archaeology and architecture to document Cultural Heritage. It allows obtaining a very precise documentation from technical point of view, but, at the same time, is very fast during the operation on the field. In extreme situation, where the priority is, as in our case, to re-cover the boat in order not to stress the wood, a quick and fast technique of documentation, which needs only few hours to collect the essential data, represents the perfect solution to realize a complete and precise documentation.
But our experience wants to highlight that the correct approach to Cultural Heritage 3d documentation has to use and integrate multiple sensors and technologies (photogrammetry, laser scanning, topography, etc.) taking advantage from the intrinsic potentials of each technique.
From an archaeological point of view, reality-based techniques are essential and important to recreate a virtual model with a centimetric accuracy; boats are a very peculiar item due to the difficulty to document the subject, due to the homogenous colour of wood and to the degraded conditions of the structure, which make the distinction of the elements very difficult. In this paper we have demonstrated how photogrammetry and laser scanning are useful also in critic situation.
In future research we will reconstruct all the boat with 3d modelling software, implementing the possibilities of analysis and study of digital technique in nautical archaeology.
The International Archives of the Photogrammetry, Remote Sensing and Spatial Information Sciences, Volume XLI-B5, 2016 XXIII ISPRS Congress, 12–19 July 2016, Prague, Czech Republic
ACKNOWLEDGEMENTS
We want to thank the Soprintendenza Archeologica dell'Emilia Romagna for the permission to study the boat.
REFERENCES
Berti, F., ed., 1990. Fortuna Maris. La nave romana di Comacchio. Firenze.
Balista, C., Bonfatti, L., Calzolari, M., 2007. Il paesaggio naturale e antropico delle Valli tra Spina e Comacchio e le sue trasformazioni dall'Età etrusca all'Alto Medioevo. In: Genti del
delta da Spina a Comacchio. Uomini, territorio e culto
dall'antichità all'alto Medioevo. Ferrara, pp. 19-32.
Canciani, M., Gambogi, P., Romano, F.G., Cannata, G. and Drap, P., 2003. Low Cost Digital Photogrammetry for Underwater Archaeological Site Survey And Artifact Insertion. The Case Study of the Dolia Wreck In Secche Della Meloria-Livorno-Italia. The International Archives Of The Photogrammetry, Remote Sensing And Spatial Information
Sciences, XXXIV- 5/W12, 95-100.
Calzolari, M., 2007. Il delta padano in età romana: idrografia, viabilità, insediamenti, In: Genti del delta da spina a
comacchio. Uomini, territorio e culto dall'antichità all'alto
medioevo. Ferrara, pp. 153-172.
Cufar, K., Merela, M., Eric, M., 2014. A roman barge in the Ljubljanica river (Slovenia): wood identification, dendrochronological dating and wood preservation research.
Journal of Archaeological Science, 44, pp. 128-135.
Http://www.elsevier.com/locate/jas.
De Reu, J., Plets, G., Verhoeven, G., De Smedt, P., Bats, M., Cherretté, B., De Maeyer, W., Deconynck, J., Herremans, D., Laloo, P., Van Meirvenne, M., De Clercq, W., 2013. Towards a three-dimensional cost-effective registration of the archaeological heritage. Journal of Archaeological Science, 40, pp. 1108-1121.
Dellepiane, M., Dell' Unto, N., Callieri, M., Lindgren, S., Scopigno, R., 2014. Archaeological excavation monitoring using dense stereo matching techniques. Journal of Cultural
Heritage, 14.3, pp. 201-210.
Gonizzi Barsanti, S., Remondino, F., Visintini, D., 2013. 3D surveying and modeling of archaeological sites – some critical issues. In: Annals of the Photogrammetry, Remote Sensing and
Spatial Information Science, II-5/W1, pp. 145-166.
Gonizzi Barsanti, S., Remondino, F., Jimenez Fenandez-Palacios, B., Visintini, D., 2014. Critical factors and guidelines for 3D surveying and modelling in Cultural Heritage.
International Journal of Heritage in Digital Era, 3.1, pp.
141-157.
Koutsoudis, A., Vidmar, B., Ioannakis, G., Arnaoutoglou, F., Pavlidis, G., Chamzas, C., 2014. Multi-image 3d reconstruction data evaluation. Journal of Cultural Heritage, 15.1, pp. 73-79. Mahiddine, A., Seinturier, J., Peloso, D., Boï, J-M., Drap, P., Merad, D., 2012. Underwater image preprocessing for automated photogrammetry in high turbidity water. An application on the Arles-Rhone XIII roman wreck in the Rhodano river, France. Virtual System and Multimedia, 18th international conference on virtual systems and multimedia, Milan, Italy.
Martorelli, M., Pensa, C., Speranza, D., 2014. Digital photogrammetry for documentation of Maritime Heritage.
Journal of Maritime Archaeology, 9, pp. 81-93.
McCarthy, J., 2014. Multi-image photogrammetry as a practical tool for cultural heritage survey and community. Journal of
Archaeological Science, 43, pp. 175-185.
Micheletti, N., Chandler, J. H., and Lane, S. 2015. Structure from motion (sfm) photogrammetry. British Society for
Geomorphology Geomorphological Techniques, chap 2, sec
2.2.
Remondino, F., Del Pizzo, S., Kersten, P.T., Troisi, S., 2012. Low-cost and open-source solutions for automate image orientation - a critical overview. Lecture Notes in Computer
Science, 7616, pp. 40–54.
Remondino, F., Rizzi, A., 2010. Reality-based 3D documentation of natural and cultural heritage sites – techniques, problems and examples. Applied Geomatics, 2(3), pp. 85-100.
Yamafune, K., Torres, R., Castro, F., 2016. Multi-Image Photogrammetry to Record and Reconstruct Underwater Shipwreck Sites. Journal of Archaeological Method and Theory DOI 10.1007/s10816-016-9283-1
Zhukovsky, M. O., Kuznetsov, V. D., Olkhovsky, S. V., 2013. Photogrammetric techniques for 3-d underwater record of the antique time ship from Phanagoria. In: The International
Archives of the Photogrammetry, Remote Sensing and Spatial
Information Sciences, vol. Xl-5/w2.
Http://www.isprs.org/proceedings/xl/5-w2/proceedings.pdf.
The International Archives of the Photogrammetry, Remote Sensing and Spatial Information Sciences, Volume XLI-B5, 2016 XXIII ISPRS Congress, 12–19 July 2016, Prague, Czech Republic