For Peer Review Only
Seismic Vulnerability Assessment of Historical Centres at Urban Scale
Journal: International Journal of Architectural Heritage Manuscript ID UARC-2017-1884.R1
Manuscript Type: Original Article Date Submitted by the Author: 20-Oct-2017
Complete List of Authors: Fiore, Alessandra; Technical University of bari, DICAR; University of Chieti-Pescara “G. d'Annunzio”, InGeo
Sulpizio, Concetta; “G. d'Annunzio” University of Chieti-Pescara, InGeo Engineering and Geology Department; College of Civil Engineering, Fuzhou University
Demartino, Cristoforo; College of Civil Engineering, Nanjing Tech University; Sapienza University of Rome, Dept. of Structural Engineering and Geotechnics
Vanzi, Ivo; University of Chieti-Pescara “G. d'Annunzio”, InGeo Biondi, Samuele; Universita degli Studi Gabriele d'Annunzio Chieti e Pescara
Fabietti, Valter; Universita degli Studi Gabriele d'Annunzio Chieti e Pescara Keywords: Urban Minimum System, urban risk assessment, fragility curves, reliability
methods, optimization procedure
For Peer Review Only
Seismic Vulnerability Assessment of Historical Centres
at Urban Scale
Alessandra Fiore1,2*, Concetta Sulpizio1,3, Cristoforo Demartino 4,5, Ivo Vanzi1,3, Samuele Biondi1, Valter Fabietti1
1
InGeo Engineering and Geology Department, University of Chieti-Pescara “G. d'Annunzio”, Viale Pindaro 42, 65127 Pescara, Italy
2
DICAR Department of Science of Civil Engineering and Architecture, Technical University of Bari, via Orabona, 4 70125 Bari, Italy, Email: [email protected]
3
College of Civil Engineering, Fuzhou University, Fuzhou 350108 - Fujian, China
4
College of Civil Engineering, Nanjing Tech University, Nanjing 211816, PR China
5
Dept. of Structural Engineering and Geotechnics, Sapienza University of Rome, via A. Gramsci 53, 00197 Rome, Italy
*
Corresponding author
ABSTRACT
Seismic prevention and mitigation of historical centres have gained a central position within earthquake engineering topics, particularly in areas such as Italy, Greece and Portugal. Many historical towns in these countries have been strongly damaged, due to the high quantity of old buildings and urban structures and infrastructures. In this paper these aspects are described, modelled and investigated in terms of structural safety, the goal being the set-up of a comprehensive strategy for seismic prevention and mitigation of a whole historical centre. The proposed approach is based on two relevant parts: the first is an urban risk assessment, the second is a prioritization of retrofitting interventions so as to optimally increase urban safety.
The effectiveness of the proposed methodology is shown with reference to a complex case 3 4 5 6 7 8 9 10 11 12 13 14 15 16 17 18 19 20 21 22 23 24 25 26 27 28 29 30 31 32 33 34 35 36 37 38 39 40 41 42 43 44 45 46 47 48 49 50 51 52 53 54 55 56 57 58 59 60
For Peer Review Only
series/parallel system and then studied by applying seismic reliability methods. Seismic retrofitting interventions are finally prioritized.
KEYWORDS
Urban Minimum System, urban risk assessment, fragility curves, reliability methods, optimization procedure.
1. INTRODUCTION
Urban seismic risk prevention deals with the effects of territorial transformation, in order to evaluate the impact that these ones may have in modifying the functions of different parts of a settlement. Unlike ordinary vulnerability analysis of structures and infrastructures (Fiore and Monaco, 2010; Resta et al., 2013; Fiore et al., 2013; Huang et al., 2014; Liu et al. 2014; Briseghella et al., 2014; Bergami and Nuti, 2013; Lavorato and Nuti, 2015), urban vulnerability depends not only on the structure characteristics but also on the functional systems that compose a city (Anastassiadis and Argyroudis, 2007; Vanzi et al., 2015; Braga et al., 2015). Urban prevention, therefore, has to be framed in a wider vision as compared to a single building and is designed to maintain the vital settlement functions.
The key issue is to identify the essential parts of an urban structure which should remain operational even after the earthquake, referred to as Urban Minimum System (UMS). This UMS is conditioned by the strategic role of the settlement as compared to the surrounding areas and, with due considerations, by the different elements composing it. This approach, i.e. the selection of some elements only, is justified by the circumstance that it is not possible to protect the entire settlement, for management reasons (i.e. cost and time). It is therefore natural to make a choice: which structures, and at which level, should be protected firstly. Prevention planning is based upon the need to maintain the vital functions that make up a city. The idea of UMS is linked to the strategic role of the different elements, within the ordinary life of a city. It is necessary to understand which are, at any given time, the 2 3 4 5 6 7 8 9 10 11 12 13 14 15 16 17 18 19 20 21 22 23 24 25 26 27 28 29 30 31 32 33 34 35 36 37 38 39 40 41 42 43 44 45 46 47 48 49 50 51 52 53 54 55 56 57 58 59 60
For Peer Review Only
components of the UMS, with the final goal of identifying the set allowing to obtain a city preserving the minimum functionality after an earthquake.
On the above issue, many classical structural reliability methods have been proposed in literature in order to model and analyse the seismic safety of a system and to identify the components which, after retrofitting, maximise the system probability of survival (Nuti et al., 2010). In particular past studies deal with the seismic safety of both stand-alone structures (e.g. a hospital, a bridge) (Nuti andVanzi, 2005; Cimellaro et al., 2010) and capacitive network like systems (e.g. electric network, water distribution, roads network) (Nuti et al., 2007; Vanzi et al., 2005; Nuti et al., 2009; Nakamura et al., 2011; Huang et al., 2010). In this context, capacitive indicates that the network has a finite (however big or small) transportation capacity, being it of goods (electricity, water) or people (roads).
The procedure described in this paper belongs to the former class and, differently from the previous studies, focuses on urban centres. The historical centre of “Montebello di Bertona” (Abruzzo, Italy) is chosen as case study. The system (a portion of a municipality) is modelled via its cut sets and a fragility curve, specifically computed, is assigned to each element. An optimization procedure, aiming at maximizing the global system safety and minimizing retrofitting costs, is then set up. The results clearly indicate the best seismic retrofitting strategy.
2. A STRATEGIC APPROACH FOR HISTORICAL CENTRES
A historical centre is, like a general infrastructure, a complex mix of different functions which are in part in series and in part in parallel. This last distinction is very relevant.
A series system is a configuration such that, if any component of the system fails, the entire system fails. Conceptually, a series system is as weak as its weakest link. Contrarily a parallel system is a configuration such that, as long as not all the system components fail, the entire 3 4 5 6 7 8 9 10 11 12 13 14 15 16 17 18 19 20 21 22 23 24 25 26 27 28 29 30 31 32 33 34 35 36 37 38 39 40 41 42 43 44 45 46 47 48 49 50 51 52 53 54 55 56 57 58 59 60
For Peer Review Only
system works. Conceptually, in a parallel configuration, the total system reliability is higher than the reliability of any single system component.
These basic approaches have to be redefined for historical centres, above all if little towns in marginal territories are considered, like those existing in the Abruzzo Region, in Italy. In this case historical centres show low inhabitant density and a great part of uninhabited or partially inhabited buildings, characterized by a poor maintenance.
So, under the above mentioned circumstances, it is not possible to simply classify a building as part of a series or parallel system: probably these buildings are out of any system from a functional point of view and it is not clear how to manage their failure. On the contrary, these same buildings may have a great value from an urban point of view. That is, they may be particularly relevant in terms of architectural content and touristic use. Finally it could be extremely complex to individuate the owners, so it could be difficult to understand the damage level of these buildings.
Moreover, in a historical centre, the choice if restoring or not a building (or if seismically improve it or not) could be devoted to urban or architectonical considerations and not to economic or purely structural evaluations. In this framework an accurate evaluation of the historical evolution of the urban pattern should be a crucial step and the population size trend could be a fundamental parameter. In fact, the population size can affect both building construction and maintenance. That is if in a certain period a town has a great population, it needs a high number of buildings for home and service; if the same town later looses population, those buildings will be not maintained or will be abandoned. In the case of an earthquake this town will be more fragile than another one with constant population size trend. Therefore, for a historical centre, there is a link between population size trend and damage response. 2 3 4 5 6 7 8 9 10 11 12 13 14 15 16 17 18 19 20 21 22 23 24 25 26 27 28 29 30 31 32 33 34 35 36 37 38 39 40 41 42 43 44 45 46 47 48 49 50 51 52 53 54 55 56 57 58 59 60
For Peer Review Only
2.1 Urban risk assessment and reduction
Recently, as a result of the seismic events occurred in Italy and in other parts of Europe, the analysis of urban seismic vulnerability has become a topic of considerable interest. Various procedures for the safety evaluation of network systems like electric powers, roads, hospitals, bridges or strategic buildings, were proposed in literature (Nuti and Vanzi, 2005; Vanzi et al., 2005; Nuti et al., 2007; Nuti et al., 2009; Cimellaro et al., 2010; Huang et al., 2010; Nuti et al., 2010; Nakamura et al., 2011).
Differently from the above studies, this study focuses on the urban risk assessment. In this specific case, a new system has to be defined: the UMS, i.e. a peculiar urban system composed of strategic buildings, open spaces and public ways (Calvi et al., 2006). Strategic here means either crucial to its operation (e.g. hospitals, industries, commercial and governmental buildings, bridges, major roads, etc.) or essential to achieve strategic objectives (e.g. if a policy of sustainable energy development is adopted, the system of production facilities, wind farms, solar, biomass power plants, etc.).
The UMS is therefore a system of functions, strategic buildings and spaces that are considered essential for the post-earthquake vitality of the urban organism, even after further events caused by the earthquake (fire, landslides, damage and geological phenomena, etc.). The UMS includes structures and functions, so that no component can be removed without compromising the overall operation of the city. If the UMS includes infrastructural networks and external risks (environmental and geological risks), it can be referred to as a complex system.
From a mathematical point of view, considering that many aleatory quantities are involved, a probabilistic approach should be applied; on the other hand, if a urban plan has to be approved, it is necessary to assume practical and operational decisions.
3 4 5 6 7 8 9 10 11 12 13 14 15 16 17 18 19 20 21 22 23 24 25 26 27 28 29 30 31 32 33 34 35 36 37 38 39 40 41 42 43 44 45 46 47 48 49 50 51 52 53 54 55 56 57 58 59 60
For Peer Review Only
Generally, when a seismic safety evaluation is carried out, it is necessary to construct a procedure able to maximize the safety of the selected nodes and minimize the economic cost, in order to identify which components, within each part of the system, have to be upgraded with the aim of obtaining the maximum economic convenience.
In the case of an urban system, this approach has to be revisited in order to take into account the functional, and social, roles of the different parts of a city. Many aspects have to be simultaneously considered in the hypothesis of a seismic event: i) structural safety; ii) functionality of shops, public offices, schools, hotels; iii) functionality of public roadways. There is no a unique UMS identification method. The approach presented in this paper is an attempt to define the minimum urban structure synthesizing structural and urban design, reassembling two different visions of the same problem, the structural engineering and the urban design.
The first phase of the urban risk assessment involves the analysis of the spatial elements at risk, listed below:
• The population in the wider sense, the human element, that is the permanent population (residents and people who work in the city) as well as the temporary one (people who work but do not live in the city – professional visitors, tourists, etc.). • The residences, buildings and infrastructures of the city.
• Buildings of strategic significance characterized by their usefulness in crisis periods, such as hospitals, fire and police stations, communications centres, general infrastructure and basic decision-making centres (administrative officials, city hall, etc.), organizations.
• Monuments, buildings that belong to the cultural heritage of the city, buildings of architectural significance. 2 3 4 5 6 7 8 9 10 11 12 13 14 15 16 17 18 19 20 21 22 23 24 25 26 27 28 29 30 31 32 33 34 35 36 37 38 39 40 41 42 43 44 45 46 47 48 49 50 51 52 53 54 55 56 57 58 59 60
For Peer Review Only
• Transportation networks (roadway, railway) with their subcomponents (bridges, streets, terminal stations, etc.).
• Utility networks (electricity supply, telecommunications, water supply, natural gas, sewage disposal) with their subcomponents (substations, tanks, pipelines, etc.).
Furthermore, an urban risk analysis also includes a population distribution study, an analysis of its socioeconomic characteristics and structure, functions of the city, productive and economic activities taking place within it, systems of its substructure and its superstructure as well as its relation to the wider region.
In the case of a historical centre, a reasonable logical scheme for a UMS is shown in Figure 1a. This scheme is composed of four sub-systems (strategic buildings, open spaces, external risks, public ways) arranged in series; each of these sub-systems is arranged in series too. When a system is arranged in series, it means that each element has to be safe in order to preserve the global safety (Figure 1b). So a strategic building, such as for example a primary school, can be considered safe if the open spaces near the school are accessible, electric power is at disposal, water network is operative, eventual ground sliding remains in a quiescent stage, public ways preserve their accessibility from the entire community and, above all, from ambulances or civil protection assistance and fire engines.
On the other hand, when a sub-system shows some redundancies, the corresponding components can be assumed as arranged in parallel. So, for example, if the same primary school can be reached by means of two different road ways, these two ways result in parallel, that is one of these can collapse if the other one remains fully efficient (Figure 1c).
Any macro sub-system is firstly assumed as in series with the others, while a punctual analysis successively allows to distinguish the two categories of in-series and in-parallel components. 3 4 5 6 7 8 9 10 11 12 13 14 15 16 17 18 19 20 21 22 23 24 25 26 27 28 29 30 31 32 33 34 35 36 37 38 39 40 41 42 43 44 45 46 47 48 49 50 51 52 53 54 55 56 57 58 59 60
For Peer Review Only
3. PROPOSED METHODOLOGY
Due to the uncertainties involved in the analysis, a probabilistic approach is herein applied. The proposed methodology involves the following steps: i) identification of the UMS; ii) selection of the target safety level, which is dependent on the component type; iii) definition for each component of the fragility curve, which gives the probability of a structure to exceed a certain limit state; iv) evaluation of the fragility behavior of the whole system by applying structural reliability methods; v) identification of an optimal retrofitting strategy.
3.1 Fragility curves
On the basis of the data already available or that can be acquired through a survey and after a preliminary study of the characteristics of the built environment in the urban area under investigation, the first step of the vulnerability assessment is to proceed to a proper classification of buildings. In fact, the vulnerability assessment at territorial scale requires grouping the buildings that have a similar response under the seismic action, in order to evaluate the damage and losses of the built environment due to a given hazard assessment. Successively, suitable fragility functions can be defined for each building class, by using existing ones or by developing new specific curves. The fragility functions describe the probability of a structure to be in or exceed different damage states (e.g. minor, moderate, extensive and complete) for a given level of ground shaking (Vanzi et al., 2005; Calvi et al., 2006). They are usually modeled as two or multi-parameter cumulative probability density functions, characterized by a mean value of ground shaking and an associated dispersion factor (standard deviation) for each damage state.
Many fragility functions have been proposed in the scientific literature for the risk analysis of buildings. They have been derived according to different approaches, which can be classified into: 1) empirical (Nuti and Vanzi, 2005; Rota et al., 2011); 2) expert elicitation based (Lagomarsino and Giovinazzi, 2006); 3) analytical, based on non linear static or dynamic 2 3 4 5 6 7 8 9 10 11 12 13 14 15 16 17 18 19 20 21 22 23 24 25 26 27 28 29 30 31 32 33 34 35 36 37 38 39 40 41 42 43 44 45 46 47 48 49 50 51 52 53 54 55 56 57 58 59 60
For Peer Review Only
approaches (Lagomarsino and Cattari, 2013; Rota et al., 2010); 4) hybrid methods (Jaiswal et al., 2011).
The fragility functions herein adopted belong to the first category. They have been obtained, in a previous study, from observed damages after the occurrence of past earthquakes in Italy (Nuti et al., 1998; Nuti et al., 2001; Nuti et al., 2011). More precisely, they were evaluated by applying the Bayesian updating method (Bensi et al. 2013; De Risi et al. 2017) to damage data recorded in past earthquakes. The assumed distribution function for each component fragility was lognormal, defined by two parameters, i.e. median value and coefficient of variation. Through the Bayes' method, the median of the distribution was updated using the data collected in the 1976 Friuli and 1980 Irpinia earthquakes.
Two performance levels, Significant Damage (SD) and Damage Limitation (DL), were considered (respectively corresponding to the SLD and SLV limit states in the Italian technical code (MIT, 2008)).
The obtained fragility functions define the probability of failure Pf of each class of buildings
as a function of the earthquake intensity expressed in terms of Mercalli – Cancani – Sieberg (MCS) intensity scale.
3.2 Brief overview on reliability methods
After defining the fragility curves of the different components, the fragility function of the UMS can be computed by applying the classical structural reliability methods (Ang and Tang, 1984; Ditlevsen and Madsen, 1996; Lupoi et al., 2006). This Section highlights some key features of the main steps needed to compute the fragility curve of the UMS used throughout this study.
A series system is one which fails if any one or more of its components fail; such a system has no redundancy and, for this reason, is also named “weakest link” system. If Fi denotes 3 4 5 6 7 8 9 10 11 12 13 14 15 16 17 18 19 20 21 22 23 24 25 26 27 28 29 30 31 32 33 34 35 36 37 38 39 40 41 42 43 44 45 46 47 48 49 50 51 52 53 54 55 56 57 58 59 60
For Peer Review Only
the failure of the ith component, the combined system failure event FS is given by the union
“ ∪ ” of all single failure events Fi as follows:
S i
i
F =
∪
F (1)The corresponding probability of system failure can be expressed as:
( )
S ii
P F = ⎜P⎛ F⎞⎟
⎝
∪
⎠ (2)A parallel system is one which fails only if all its components fail, that is failure of one component will not necessarily lead to the failure of the whole system. Coherently with the above-introduced definitions, the combined system failure event of a parallel system FP of k
components, is given by the intersection or mutual occurrence “ ∩ ” of all failure events Fi, as
follows:
P i
i
F =
∩
F (3)The corresponding probability of system failure can be written as:
( )
S ii
P F = ⎜P⎛ F⎞⎟
⎝
∩
⎠ (4)A general system is one that consists of a combination of series and parallel subsystems. A set of components whose joint failure implies failure of the system is called cut-set. In this case the failure event Fg of the general system can be schematized as:
g ij
j i
F =
∪∩
F(5)
Fij being the ith component failure in the jth failure path (i.e. in the jth parallel subsystem). The probability of failure of such a system can be thus calculated from:
2 3 4 5 6 7 8 9 10 11 12 13 14 15 16 17 18 19 20 21 22 23 24 25 26 27 28 29 30 31 32 33 34 35 36 37 38 39 40 41 42 43 44 45 46 47 48 49 50 51 52 53 54 55 56 57 58 59 60
For Peer Review Only
( )
g ijj i
P F = ⎜P⎛ F ⎞⎟
⎝
∪∩
⎠ (6)By particularizing the described mathematical formulation into the context of a historical centre, the different components are represented by buildings, open spaces, external risk elements and public ways; as discussed in Section 2, they can be arranged in series or in parallel. More in detail, if the failure events, each one associated to a single component, can be considered as independent and arranged in series, the probability of failure of the system conditional on the sample ground motion k can be easily evaluated as (Lupoi et al., 2006):
(
)
, , 1 1 1 m f k f tk t P P = = −∏
− (7)m being the number of components and
∏
•the product operator. The fragility function of the system is obtained by calculating Pf for a convenient number of seismic intensity values k. So in Eq. (7) Pf,tk represents the value of the fragility curve of component t in correspondence of seismic intensity value k.In a general cut-set formulation of the problem, the probability of failure of a completely general system (not necessarily serial) can be written as:
, , 1 c C j n f k f ijk j i I P P = ∈ =
∪ ∩
(8) where nc is the number of cut-sets Cj, and ICj is the set of indices of the failures belongingto the j-th cut set. The cut-set formulation is a conventional way to describe the logical arrangement of components for the evaluation of the state of a system (Der Kiureghian 2005). The analytical calculation of the probability of failure of a system including only components arranged in series by Eq. 7 is rather simple, while, if also components arranged in parallel are involved, the application of Eq. 8 can become too much complex. An alternative way to compute the probability of failure by Eq. 7 or Eq. (8) is by applying a standard Monte Carlo 3 4 5 6 7 8 9 10 11 12 13 14 15 16 17 18 19 20 21 22 23 24 25 26 27 28 29 30 31 32 33 34 35 36 37 38 39 40 41 42 43 44 45 46 47 48 49 50 51 52 53 54 55 56 57 58 59 60
For Peer Review Only
simulation, which is simple and comparatively inexpensive since it does not require any structural analysis. Monte Carlo simulation is the most general reliability method actually available; it works by generating samples, or realizations, of the random variables from their specified distributions and evaluating the limit state functions to determine whether failure occurs. This process is repeated many thousands of times, and the probability of failure is approximated by the fraction of failures conditional on one or more load variables. A fragility curve is constructed using this approach by varying the load parametrically if it is deterministic, or otherwise deriving the load conditions for each realization of the model(s).
3.3 Sensitivity analysis
The main goals of this study are both the safety assessment of the urban system in the current state (i.e. as it is) and the identification of an optimal retrofitting strategy.
The optimal retrofitting strategy consists of the determination of the priority order according to which the different components have to be strengthened. In other words, after the as-it-is-system failure probability has been computed, it is checked the strengthening of which component, among all, increases the system safety mostly. This one is chosen as the first in the priority list (I); the check is then repeated (assuming component I as strengthened), the second one is chosen and the priority list up-dated. In this way, limited economic resources can be optimally allocated in terms of system safety.
The component whose strengthening mainly increases the whole system safety is searched for through an optimization algorithm based on a step-by-step procedure. The increase of the whole system safety is measured on the UMS fragility function in terms of increment of the value of the MCS in correspondence of the median failure probability (PF) (that is of PF= 50%), referred to as MCS median failure level in the following. More precisely, at each optimization procedure, for each component, the just defined increment obtained on the UMS fragility curve by increasing of a value equal to 1 the MCS median failure level of that 2 3 4 5 6 7 8 9 10 11 12 13 14 15 16 17 18 19 20 21 22 23 24 25 26 27 28 29 30 31 32 33 34 35 36 37 38 39 40 41 42 43 44 45 46 47 48 49 50 51 52 53 54 55 56 57 58 59 60
For Peer Review Only
component is computed and the one leading to the best performance is chosen, up to the step in corresponding of which the required safety target is reached.
That is a sensitivity analysis is carried out by assuming that the MCS median failure level of the considered component, after retrofitting, increases of a value equal to 1. The flow-chart reported in Figure 2 can further clarify the retrofit decision process.
The main goal is to establish an intervention order, without addressing the possible retrofitting strategies, which represent a successive level of detail.
4. THE CASE STUDY: “MONTEBELLO DI BERTONA”
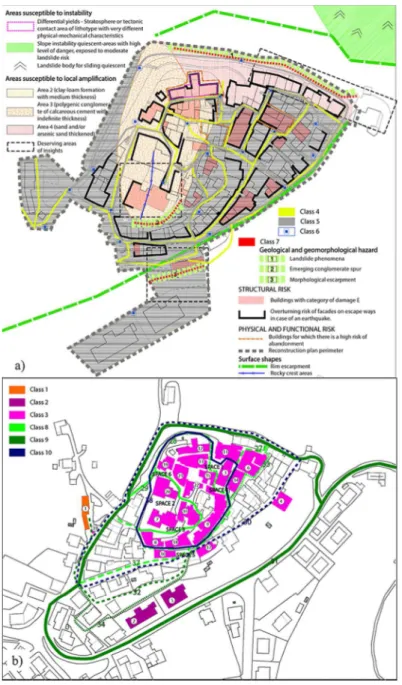
The practical application of the method concerns the town of “Montebello di Bertona”, which belongs to the so called “cratere sismico aquilano” (i.e. municipalities near the epicentre of the recent L'Aquila earthquake). This small village has about 1000 inhabitants and is exposed to many potential risk sources. As summarized in Figure 3a, these risks are structural (red buildings are those with critical occupancy judgments, black thick lines are those building fronts that can collapse on public ways or open spaces), functional (orange dotted lines are those building that are abandoned or without clear property situation, i.e. without any structural and functional maintenance), geological (green portions are sliding ground, green dashed tick lines are those for potential sliding fault, black dotted lines are those ground portion with insufficient geological information, violet dotted lines are those for potential differential settlements due to ground discontinuity).
All buildings are classified into six classes on the basis of three structural typologies, i.e. masonry, reinforced concrete and mixed ones, and two classes of height, i.e. less or more than three floors. The considered components are in total 39 and include buildings, utility networks linked to external risks, open spaces and public ways, assembled in series or in parallel. 3 4 5 6 7 8 9 10 11 12 13 14 15 16 17 18 19 20 21 22 23 24 25 26 27 28 29 30 31 32 33 34 35 36 37 38 39 40 41 42 43 44 45 46 47 48 49 50 51 52 53 54 55 56 57 58 59 60
For Peer Review Only
The median value and the coefficient of variation of the fragility curves for each class of components are reported in Table 1 (Nuti et al. 1998; Nuti et al. 2001), while the 39 components of the whole system are summarized in Table 2, specifying the corresponding fragility classes. All the components, with the respective classes, are also depicted in Figures 3 a-d. According to the studies from Nuti et al. (1998, 2001), for the buildings whose collapse would cause the interruption of traffic on public ways, the SD performance level is considered, while for the others the DL performance level is accounted for.
The logical scheme for the “Montebello di Bertona” UMS is reported in Table 3 and can be reconstructed by observing Figures 3 a-b. In particular, by focusing on Figure 3b, it is possible to recognize all the spaces and the paths on the basis of which the logical scheme has been assembled. This scheme is composed of 20 sub-systems arranged in series; each subsystem is in turn composed of: i) just one component or ii) more components arranged in series or iii) more series of components arranged in parallel.
For example the sub-system 13 (space 6) includes the components 19, 20 and 21 (masonry buildings) arranged in series and can remain therefore serviceable only if none of the three components overcomes the SD performance level.
The sub-system 20 is instead constituted of 7 in parallel systems, representing 7 alternative ways to connect the inner path (i.e. the town centre) with the external roads (components 30 and 31); each of these 7 systems in turn comprises more components disposed in series.
Moreover, by observing Table 3, it emerges that also a church and some buildings with social
functions (for example “Palazzo Falco”) are included in the UMS. In fact the goal of the
study is to ensure the continuity of the main physical, social and economic functions of the
analyzed urban center after a possible seismic event, in order to avoid its potential
abandonment in case of an earthquake. Especially for a small urban centre such as
“Montebello di Bertona”, particular buildings like a church should be preserved not only for
2 3 4 5 6 7 8 9 10 11 12 13 14 15 16 17 18 19 20 21 22 23 24 25 26 27 28 29 30 31 32 33 34 35 36 37 38 39 40 41 42 43 44 45 46 47 48 49 50 51 52 53 54 55 56 57 58 59 60
For Peer Review Only
their special historic or architectural interest but above all for their human life and social
value. Earthquakes are emergency situations with often devastating consequences on human
life, living conditions, economic and cultural activities as well on the built environment. So
one of the fundamentals of the proposed methodology is represented by the belief that an
appropriate operational plan should take into consideration all the principal distinctive
features, material and immaterial, of the urban space components exposed to seismic risk. For
this reason the church as well as “Palazzo Falco” are treated as essential components of the
UMS and result arranged in series in the logical scheme depicted in Table 3. Actually this
choice is also due to the circumstance that the church (component 2) and “Palazzo Falco”
(component 6) could be subject to the risk of façade overturning on escape ways under a
seismic action (Figure 3a), as a consequence of which their preservation becomes particularly
important. The same considerations can be applied to other components/sub-systems of the
logical scheme. It should be further underlined that the initial selection of the components of
the UMS partially contains subjective choices. These choices derive from the interaction
between experts and politicians and depend on the peculiarities of the urban centre under
examination.
By adopting the general cut-set formulation, the described logical scheme is firstly decomposed into 4842 sub-systems (i.e. cut-sets) arranged in series, each of one comprising one component or just components arranged in series. In fact there exist 4800 different combinations of component failures according to which the 7 systems constituting sub-system 20 simultaneously collapse, consequently causing the collapse of sub-sub-system 20 itself. Successively, by adopting the minimum cut-set decomposition, i.e. by eliminating redundancies, a final logical scheme of the UMS including just 44 in series sub-systems, each one constituted by a single component or by components exclusively arranged in series, is obtained (Figure 4b). That is, the 4800 possible collapse modes of sub-system 20 are reduced 3 4 5 6 7 8 9 10 11 12 13 14 15 16 17 18 19 20 21 22 23 24 25 26 27 28 29 30 31 32 33 34 35 36 37 38 39 40 41 42 43 44 45 46 47 48 49 50 51 52 53 54 55 56 57 58 59 60
For Peer Review Only
to 14 by deleting redundancies. This decomposition enables the application of Eq. (7) to analytically calculate the UMS fragility curve.
The fragility curves for the component classes (Nuti et al. 1998; Nuti et al. 2001) and the as-it-is UMS (red thick line) are shown in Figure . The fragility curve of the UMS is obtained both in analytical way through the application of Eq. (7) and by a Monte Carlo simulation. More precisely, a Monte Carlo simulation of nr = 10000 runs is carried out. The fragility
curves so obtained are compared in Figure 6 and, as it can be seen, they are very close to each other.
By observing Figure 5, it is possible to note that the value of the failure probability PF= 50% for the whole system is reached in correspondence of a value of MCS intensity equal to 5.70, i.e. this little town is too much vulnerable to seismic action. It is worth to note that the earthquake intensity corresponding to a MCS level~6 is rather low and does not involve damages to structures (Wood and Neumann, 1931; Calvi et al., 2006). A retrofitting strategy is then necessary in order to obtain an acceptable safety level. Considering the nature of a historical town where masonry buildings represent the prevalent building typology, an MCS median failure level = 10, with reference to the whole system fragility curve, can be assumed as an acceptable risk level target. In fact the earthquake intensity corresponding to a MCS level ~10 can be considered high, implying not-negligible structural damages to buildings. A sensitivity analysis consisting of 40 steps is then performed according to the flow-chart reported in Figure 2, at the aim to obtain a significant improvement of the system safety. Figure 6 Fragility curve of the as-it-is UMS: comparison between analytical and Montecarlo methods.
Figure 7a shows the MCS median failure level for each component and for the UMS at each retrofitting step. The MCS median failure levels for the UMS at each retrofitting step are summarized in Figure 7b, while the fragility functions of the UMS at each step are reported 2 3 4 5 6 7 8 9 10 11 12 13 14 15 16 17 18 19 20 21 22 23 24 25 26 27 28 29 30 31 32 33 34 35 36 37 38 39 40 41 42 43 44 45 46 47 48 49 50 51 52 53 54 55 56 57 58 59 60
For Peer Review Only
in Figure 8. It clearly emerges that the system fragility mainly depends on few components characterized by high fragility. In particular the components 2 (school), 5 (school), 4 (commercial compound), 1 (“ex mattatoio”) and 6 (“Palazzo Falco”) result the first ones that should be retrofitted in order to obtain an improvement of the system behavior and of its safety level. As it can be observed from Figures 7, retrofitting these building would amplify the MCS median failure level of the UMS from the value 5.7 to the value ~7.6 (reached after the first 5 steps). An important safety level for the urban system would so be achieved by retrofitting few components.
Finally, at the end of the 40 steps, a more acceptable MCS intensity value equal to 10.20 is obtained in correspondence of the median failure probability of the UMS.
5. CONCLUSIONS
In this study a new system reliability strategy aimed at assessing the seismic safety of a whole historical centre has been developed and applied to a complex case study.
The proposed methodology can be summarized by the following main steps: i) identification of the minimum set of activities and buildings which are required to remain operational after an earthquake (named UMS); ii) definition of the fragility function for each component; iii) evaluation of the fragility behavior of the whole system by structural reliability methods; iv) choice of the final safety level; iv) identification, by a step-by-step procedure, of the priority order according to which the different components have to be strengthened.
The method has been described and exemplified with reference to the town of “Montebello di Bertona” in Italy. The whole system has been simplified by adopting the UMS concept, which is derived from town planning sciences and adapted to structural engineering.
The results of the study show that a sensible prioritization and system optimization, even for a complex system like a historical centre, is feasible and allow to give a clear indication of the system component retrofitting priority. The findings of the study show that the retrofitting 3 4 5 6 7 8 9 10 11 12 13 14 15 16 17 18 19 20 21 22 23 24 25 26 27 28 29 30 31 32 33 34 35 36 37 38 39 40 41 42 43 44 45 46 47 48 49 50 51 52 53 54 55 56 57 58 59 60
For Peer Review Only
process has to be well calibrated and fragility assumptions have to be carefully selected, reflecting the actual situation that depends on both local seismicity and building maintenance.
REFERENCES
Anastassiadis, A.J., Argyroudis, S.A. 2007. Seismic vulnerabilityanalysis in urban systems and road networks. Application to the city of Thessaloniki, Greece. Int. J. Sus. Dev. Plann., 2(3): 287-301.
Ang, A.H.S., and Tang, W. H. 1984. Probability Concepts in Engineering Planning and
Design, Vol. 2: Decision, Risk, and Reliability. John Wiley & Sons.
Bensi, M., Der Kiureghian, A., Straub, D. 2013. Efficient Bayesian network modeling of systems. Reliab. Eng. Syst. Saf., 112: 200–213.
Bergami, A.V., and Nuti, C. 2013. A design procedure of dissipative braces for seismic upgrading structures. Earthquake and Structures, 4: 85-108.
Braga, F., Gigliotti, R., Monti, G., Morelli, F., Nuti, C., Salvatore, W., and Vanzi, I. 2015. Post-seismic assessment of existing constructions: Evaluation of the shake maps for identifying exclusion zones in Emilia. Earthquake and Structures, 8(1): 37-56.
Briseghella, B., Mazzarollo, E., Zordan, T. and Liu, T. 2014. Friction Pendulum System as a Retrofit Technique for Existing R.C. Building. Structural Engineering International, 23: 219-224.
Calvi, G. M., Pinho, R., Magenes, G., Bommer, J. J., Restrepo-Vélez, L.F., Crowley, H. 2006. Development of seismic vulnerability assessment methodologies over the past 30 years. ISET Journal of Earthquake Technology, 472: 75-104.
Cimellaro, G. P., Reinhorn, A. M., Bruneau, M. 2010. Seismic resilience of a hospital system.
Structure and Infrastructure Engineering, 6: 127-144.
De Risi, R., Goda, K., Mori, N., Yasuda, T. 2017. Bayesian tsunami fragility modeling considering input data uncertainty. Stoch Environ Res Risk Assess, 31: 1253-1269. Ditlevsen, O., and Madsen, H.O. 1996. Structural reliability methods. New York: J. Wiley &
Sons.
Fiore, A., and Monaco, P. 2010. Earthquake-induced pounding between the main buildings of the "Quinto Orazio Flacco" school. Earthquakes and Structures, 1(4): 371-390.
Fiore, A., Marano, G. C., Monaco, P. 2013. Earthquake-Induced Lateral-Torsional Pounding between Two Equal Height Multi-Storey Buildings under Multiple Bi-Directional Ground Motions. Advances in Structural Engineering, 16(5): 845-865.
Huang, Y. N., Whittaker, A. S., Luco, N. 2010. Seismic performance assessment of base-isolated safety-related nuclear structures. Earthquake Engineering and Structural
Dynamics, 39: 1421–1442. 2 3 4 5 6 7 8 9 10 11 12 13 14 15 16 17 18 19 20 21 22 23 24 25 26 27 28 29 30 31 32 33 34 35 36 37 38 39 40 41 42 43 44 45 46 47 48 49 50 51 52 53 54 55 56 57 58 59 60
For Peer Review Only
Huang, Y., Briseghella, B., Zordan, T., Wu, Q., Chen, B. 2014. Shaking table tests for the evaluation of the seismic performance of an innovative lightweight bridge with CFST composite truss girder and lattice pier. Engineering Structures, 75: 73-86.
Jaiswal, K., Wald, D., D’Ayala, D. 2011. Developing empirical collapse fragility functions for global building types. Earthq Spectra, 27(3): 775-795.
Lagomarsino, S., and Cattari, S. 2013. Seismic vulnerability of existing buildings: Observational and mechanical approaches for application in urban areas. In Seismic
Vulnerability of Structures, di P. Gueguen, 1-62. Grenoble: ISTE Ltd and John Wiley.
Lagomarsino, S., and Giovinazzi, S. 2006. Macroseismic and mechanical models for the vulnerability assessment of current buildings. Bulletin of Earthquake Engineering, 4(4): 445-463.
Lavorato, D., and Nuti, C. 2015. Pseudo-dynamic tests on reinforced concrete bridges repaired and retrofitted after seismic damage. Engineering Structures, 94: 96-112. Liu, T., Zordan, T., Briseghella, B., Zhang, Q. 2014. Evaluation of equivalent linear analysis
methods for seismically isolated buildings characterized by SDOF systems.
Engineering Structures, 59: 619-634.
Lupoi, G., Franchin, P., Lupoi, A., Pinto, P.E. 2006. Seismic fragility analysis of structural systems. Journal of Engineering Mechanics, 132(4), pp. 385-395.
MIT. 2008. D.M. 14/01/2008. Norme Tecniche per le Costruzioni. Ministero Infrastrutture e Trasporti, Roma, Italy.
Nakamura, I., Otani, A., Sato, Y., Takada, H., Takahashi, K., Shibutani, T. 2011. Investigation of the seismic safety capacity of aged piping system shake table test on piping systems with wall thinning by e-defense. ASME 2011 Pressure Vessels and
Piping. Baltimora.
Nuti, C., Santini, S., Vanzi, I. 1998. Seismic Risk of Italian Hospitals. Proceedings of the 11th
ECEE. Paris.
Nuti, C., Santini, S., Vanzi, I. 2001. Seismic Risk of Italian Hospitals. International Journal
of Earhquake Engineering and Engineering Seismology, 15(1): 11-19.
Nuti, C., Rasulo, A., Vanzi, I. 2009. Seismic assessment of utility systems: Application to water, electric power and transportation networks Safety. Reliability and Risk Analysis: Theory, Methods and Applications. ESREL 2008 and 17th SRA-Europe. Valencia: CRC Press. 2519-2529.
Nuti, C., Rasulo, A., Vanzi, I. 2010. Seismic safety of network structures and infrastructures.
Structure and Infrastructure Engineering, 6(1-2): 95-110.
Nuti, C., Rasulo, A., Vanzi, I. 2007. Structural safety evaluation of electric power supply at urban level. Earthquake Engineering and Structural Dynamics, 36: 45-263.
3 4 5 6 7 8 9 10 11 12 13 14 15 16 17 18 19 20 21 22 23 24 25 26 27 28 29 30 31 32 33 34 35 36 37 38 39 40 41 42 43 44 45 46 47 48 49 50 51 52 53 54 55 56 57 58 59 60
For Peer Review Only
Nuti, C., Vanzi, I. 2005. A method for the (fast) evaluation of the seismic vulnerability of hospitals. ICOSSAR 2005 9th International Conference on Structural Safety and Reliability. Rome.
Nuti, C., Santini, S., Vanzi, I. 2011. Seismic risk of the Italian hospitals. European
Earthquake Engineering, 11-19.
Resta, M., Fiore, A., Monaco, P. 2013. Non-Linear Finite Element Analysis of Masonry Towers by Adopting the Damage Plasticity Constitutive Model. Advances in
Structural Engineering, 16(5): 791-803.
Rota, M., Penna, A., Strobbia, C.L. 2011. Processing Italian damage data to derive typological fragility curves. Soil Dynamics and Earthquake Engineering, 28(10): 933-947.
Rota, M., Penna, A., Magenes, G. 2010. A methodology for deriving analytical fragility curves for masonry buildings based on stochastic nonlinear analyses. Engineering
Structures, 32: 1312-1323.
Vanzi, I., Bettinali, F., Sigismondo, S. 2005. Fragility curves of electric substation equipment via the Cornell method. 9th International Conference on Structural Safety and Reliability. Rome. 19-23.
Vanzi, I., Marano, G.C., Monti, G., Nuti, C. 2015. A synthetic formulation for the Italian seismic hazard and code implications for the seismic risk. Soil Dynamics and
Earthquake Engineering, 77: 111-122. 2 3 4 5 6 7 8 9 10 11 12 13 14 15 16 17 18 19 20 21 22 23 24 25 26 27 28 29 30 31 32 33 34 35 36 37 38 39 40 41 42 43 44 45 46 47 48 49 50 51 52 53 54 55 56 57 58 59 60
For Peer Review Only
List of Table captions
Table 1 Parameters of the fragility curves for each class of components Table 2 List of components
Table 3 Composition of the UMS
List of Figure captions
Figure 1 Idealized representations of a UMS. Figure 2 Decision flow-chart.
Figure 3 “Montebello di Bertona” historical centre: a) potential risk sources map - component classes 4, 5, 6, 7; b) component classes 1, 2, 3, 8, 9, 10.
Figure 4 “Montebello di Bertona” case study: a) logical scheme; b) minimum cut-sets. Figure 5 Fragility curves for the the as-it-is UMS and the ten component classes.
Figure 6 Fragility curve of the as-it-is UMS: comparison between analytical and Montecarlo methods.
Figure 7 a) MCS median failure level for each component and for the UMS at each retrofitting step; b) MCS median failure level for the UMS at each retrofitting step.
Figure 8 Fragility functions of the UMS at each retrofitting step. 3 4 5 6 7 8 9 10 11 12 13 14 15 16 17 18 19 20 21 22 23 24 25 26 27 28 29 30 31 32 33 34 35 36 37 38 39 40 41 42 43 44 45 46 47 48 49 50 51 52 53 54 55 56 57 58 59 60
For Peer Review Only
Ref: UARC-2017-1761
Title: Seismic Vulnerability Assessment of Historical Centres at Urban Scale Journal: International Journal of Architectural Heritage
ANSWER TO REVIEWERS' COMMENTS
All the new/changed parts in the manuscript are outlined in red. In the following the comment of Reviewer #1 is answered. The authors wish to thank Reviewer #1 for his suggestion to better clarify a topic particularly important for the full comprehension of the case-study.
Reviewer 1
Comments to the Author
Section 4: The case study: Montebello di Bertona
In the application of the proposed methodology to a case study, several steps and assumptions are unclear. Page 13 – line 18-25: the Authors state that “the logical scheme […] is composed of four sub-systems […] arranged in series; each of the components of these sub-systems is arranged in series too”, making reference to Figure 3. If I understood correctly (by also looking at Table 3), this means that, if any of the components would fail, the entire UMS would not be operational anymore. To be honest, I do not see any reason why an entire city could be non-operational just because the church is damaged. Similar comments could apply to several other components of the UMS.
Answer:
As outlined in the Introduction, the key issue of the study is to identify the essential parts and functions of a urban centre and to adopt suitable prevention measures aimed at ensuring that all these selected parts and functions will remain operational also after a seismic event. In this perspective, in the Authors’ opinion the functions connected to a church should be preserved if an earthquake would occur and more precisely, with reference to the case study, also a church and other buildings with social functions (for example “Palazzo Falco”) are included in the UMS.
In detail, the goal of the study is to ensure the continuity of the main physical, social and economic functions of the analyzed urban center after a possible seismic event, in order to avoid its potential abandonment in case of an earthquake. Especially for a small urban centre such as “Montebello di Bertona”, particular buildings like a church should be preserved not only for their special historic or architectural interest but above all for their human life and social value. Earthquakes are emergency situations with often devastating consequences on human life, living conditions, economic and cultural activities as well on the built environment. So one of the fundamentals of the proposed methodology is represented by the belief that an appropriate operational plan should take into consideration all the principal distinctive features, material and immaterial, of the urban space components exposed to seismic risk. For this reason the church as well as
2 3 4 5 6 7 8 9 10 11 12 13 14 15 16 17 18 19 20 21 22 23 24 25 26 27 28 29 30 31 32 33 34 35 36 37 38 39 40 41 42 43 44 45 46 47 48 49 50 51 52 53 54 55 56 57
For Peer Review Only
scheme depicted in Table 3. Actually this choice is also due to the circumstance that the church (component 2) and “Palazzo Falco” (component 6) could be subject to the risk of façade overturning on escape ways under a seismic action (Figure 3a), as a consequence of which their preservation becomes particularly important. The same considerations can be applied to other components/sub-systems of the logical scheme. It should be further underlined that the initial selection of the components of the UMS partially contains subjective choices. These choices derive from the interaction between experts and politicians and depend on the peculiarities of the urban centre under examination.
The above concepts have been better stressed in Section 4.
3 4 5 6 7 8 9 10 11 12 13 14 15 16 17 18 19 20 21 22 23 24 25 26 27 28 29 30 31 32 33 34 35 36 37 38 39 40 41 42 43 44 45 46 47 48 49 50 51 52 53 54 55 56
For Peer Review Only
Class number Description Median value (MCS) C.O.V.1 masonry building with less than 3 floors, (DL) 7.2 0.15 2 r.c. building with less than 3 floors, (DL) 5.9 0.15 3 masonry building with less than 3 floors, (SD) 10 0.15
4 electric power 12 0.01
5 water network 12 0.01
6 fire risk 11 0.01
7 geological risk 12 0.01
8 four 3rd-class in series buildings 9 0.15 9 ten 3rd-class in series buildings 8.65 0.15 10 sixteen 3rd-class in series buildings 8.46 0.15 2 3 4 5 6 7 8 9 10 11 12 13 14 15 16 17 18 19 20 21 22 23 24 25 26 27 28 29 30 31 32 33 34 35 36 37 38 39 40 41 42 43 44 45 46 47 48 49 50 51 52 53 54 55 56 57
For Peer Review Only
Componentnumber Type Material Floor number Description
Class number 1 strategic building masonry 1 “ex mattatoio” 1 2 strategic building r.c. 2 primary school 2 3 strategic building masonry 2 church 3 4 strategic building masonry 3 commercial compound 1 5 strategic building r.c. 1 school 2 6 strategic building masonry 2 “Palazzo Falco” 1 7 strategic building masonry 2 “Palazzo Ducale” 3
8 building masonry 2 3 9 building masonry 2 3 10 building masonry 2 3 11 building masonry 2 3 12 building masonry 2 3 13 building masonry 2 3 14 building masonry 2 3 15 building masonry 2 3 16 building masonry 3 3 17 building masonry 3 3 18 building masonry 3 3 19 building masonry 3 3 20 building masonry 3 3 21 building masonry 3 3
22 building masonry 3 commercial compound 3 23 external risk electric power 4 24 external risk water network 5
25 external risk fire 6
26 external risk geological 7
27 public way - inner path 8
28 public way - inner path 8
29 public way - inner path 8
30 public way - inner path 10
31 public way - inner path 9
32 public way – part of inner path 9
33 public way - inner path 8
34 public way - inner path 9
35 public way - inner path 9
36 public way - inner path 8
37 public way - inner path 8
38 public way – part of inner path 10
39 building masonry 1 3 3 4 5 6 7 8 9 10 11 12 13 14 15 16 17 18 19 20 21 22 23 24 25 26 27 28 29 30 31 32 33 34 35 36 37 38 39 40 41 42 43 44 45 46 47 48 49 50 51 52 53 54 55 56
For Peer Review Only
In series components===> N. Number of redundancies Description List of redundancies Component number I II III IV V VI 1 1 “ex mattatoio” 1 1 2 1 primary school 1 2 3 1 church 1 3 4 1 commercial compound 1 4 5 1 school 1 5 6 1 “Palazzo Falco” 1 6 7 1 “Palazzo Ducale” 1 7 8 1 space 2 1 22 7 9 1 space 3 1 7 8 9 10 10 1 space 1 1 3 11 12 13 11 1 space 4 1 3 14 15 12 1 space 5 1 16 17 18 13 1 space 6 1 19 20 21 14 1 electric power 1 23 15 1 water network 1 24 16 1 fire risk 1 25 17 1 geological risk 1 26 18 1Path to reach the “ex
mattatoio” 1 27 32 39
19 1 Inner minimum path 1 38 3 11 12 13 18 19 20 21
20 15 ways connecting the 1 28 29 30 31 37
inner path with the 2 31 34
external roads 3 28 29 30 34 4 33 34 5 33 31 28 29 6 33 30 29 28 37 7 33 31 37 2 3 4 5 6 7 8 9 10 11 12 13 14 15 16 17 18 19 20 21 22 23 24 25 26 27 28 29 30 31 32 33 34 35 36 37 38 39 40 41 42 43 44 45 46 47 48 49 50 51 52 53 54 55 56 57
For Peer Review Only
Figure 1 Idealized representations of a UMS. 150x143mm (300 x 300 DPI) 3 4 5 6 7 8 9 10 11 12 13 14 15 16 17 18 19 20 21 22 23 24 25 26 27 28 29 30 31 32 33 34 35 36 37 38 39 40 41 42 43 44 45 46 47 48 49 50 51 52 53 54 55 56
For Peer Review Only
Figure 2 Decision flow-chart. 150x226mm (300 x 300 DPI) 2 3 4 5 6 7 8 9 10 11 12 13 14 15 16 17 18 19 20 21 22 23 24 25 26 27 28 29 30 31 32 33 34 35 36 37 38 39 40 41 42 43 44 45 46 47 48 49 50 51 52 53 54 55 56 57
For Peer Review Only
Figure 3 “Montebello di Bertona” historical centre: a) potential risk sources map - component classes 4, 5, 6, 7; b) component classes 1, 2, 3, 8, 9, 10. 149x255mm (250 x 250 DPI) 3 4 5 6 7 8 9 10 11 12 13 14 15 16 17 18 19 20 21 22 23 24 25 26 27 28 29 30 31 32 33 34 35 36 37 38 39 40 41 42 43 44 45 46 47 48 49 50 51 52 53 54 55 56
For Peer Review Only
Figure 4 “Montebello di Bertona” case study: a) logical scheme; b) minimum cut-sets. 150x50mm (300 x 300 DPI) 2 3 4 5 6 7 8 9 10 11 12 13 14 15 16 17 18 19 20 21 22 23 24 25 26 27 28 29 30 31 32 33 34 35 36 37 38 39 40 41 42 43 44 45 46 47 48 49 50 51 52 53 54 55 56 57
For Peer Review Only
Figure 5 Fragility curves for the the as-it-is UMS and the ten component classes. 150x99mm (300 x 300 DPI) 3 4 5 6 7 8 9 10 11 12 13 14 15 16 17 18 19 20 21 22 23 24 25 26 27 28 29 30 31 32 33 34 35 36 37 38 39 40 41 42 43 44 45 46 47 48 49 50 51 52 53 54 55 56
For Peer Review Only
Figure 6 Fragility curve of the as-it-is UMS: comparison between analytical and Montecarlo methods. 140x82mm (300 x 300 DPI) 2 3 4 5 6 7 8 9 10 11 12 13 14 15 16 17 18 19 20 21 22 23 24 25 26 27 28 29 30 31 32 33 34 35 36 37 38 39 40 41 42 43 44 45 46 47 48 49 50 51 52 53 54 55 56 57
For Peer Review Only
Figure 7 a) MCS median failure level for each component and for the UMS at each retrofitting step; b) MCS median failure level for the UMS at each retrofitting step.
150x71mm (300 x 300 DPI) 3 4 5 6 7 8 9 10 11 12 13 14 15 16 17 18 19 20 21 22 23 24 25 26 27 28 29 30 31 32 33 34 35 36 37 38 39 40 41 42 43 44 45 46 47 48 49 50 51 52 53 54 55 56
For Peer Review Only
Figure 8 Fragility functions of the UMS at each retrofitting step. 150x81mm (300 x 300 DPI) 2 3 4 5 6 7 8 9 10 11 12 13 14 15 16 17 18 19 20 21 22 23 24 25 26 27 28 29 30 31 32 33 34 35 36 37 38 39 40 41 42 43 44 45 46 47 48 49 50 51 52 53 54 55 56 57