Full Terms & Conditions of access and use can be found at
https://www.tandfonline.com/action/journalInformation?journalCode=tejr20
European Journal of Remote Sensing
ISSN: (Print) 2279-7254 (Online) Journal homepage: https://www.tandfonline.com/loi/tejr20
Shoreline changes near river mouth: case study of
Sant’Agata River (Reggio Calabria, Italy)
G. Foti, G. Barbaro, G. Bombino, V. Fiamma, P. Puntorieri, F. Minniti & C.
Pezzimenti
To cite this article: G. Foti, G. Barbaro, G. Bombino, V. Fiamma, P. Puntorieri, F. Minniti & C. Pezzimenti (2019): Shoreline changes near river mouth: case study of Sant’Agata River (Reggio Calabria, Italy), European Journal of Remote Sensing, DOI: 10.1080/22797254.2019.1686955
To link to this article: https://doi.org/10.1080/22797254.2019.1686955
© 2019 The Author(s). Published by Informa UK Limited, trading as Taylor & Francis Group.
Published online: 02 Nov 2019.
Submit your article to this journal
View related articles
view recent advances in remote sensing and GIS techniques allow to estimate with great precision the shoreline changes over the years. The paper analyzes the shoreline changes near the mouth of the Sant’Agata River (Reggio Calabria, Italy), carried out through the comparison of various cartography data. Furthermore, the paper analyzes the main factors influencing the coastal dynamics in order to identify possible correlation between these factors and the shoreline changes. The analysis of these factors shows that, in this case study, the rainfall regime has a considerable influence on shoreline change. The methodol-ogy described in this paper is particularly useful for better understanding the factors that most influence the coastal balance and, therefore, is applicable to many contexts which are similar to the Sant’Agata river mouth.
position; EPR; NSM; longshore transport; river transport
Introduction
Coastal areas represent the transition zone between sea and land and are of particular importance for the presence of housing settlements. In fact, over 30% of the world (Syvitski, Vorosmarty, Kettner, & Green,
2005) and the Mediterranean (European Union,
2012) population live a short distance from the coast-line. The demographic increases and the remarkable anthropization that characterized the second half of the last century have had a major impact on the equilibrium of the coastal areas and this process is visible both near the coastal cities and at the river mouths.
From this point of view, the shoreline position and, above all, its changes have become one of the major environmental problems affecting coastal zones worldwide. Indeed, nearly 80% of the world’s coasts are eroding, with rates ranging from 1 cm/year to 10m/year (Pilkey & Hume,2011). In particular, shore-line position is the most important geoindicator of coastal evolution (Boak & Turner,2005) and is related to the coastal sediment budget, whose changes may indicate natural or human-induced factors along the
shoreline or in nearby river basins (Addo, 2013;
Komar,2000; Walling,2006; Yang, Wang, Voisin, &
Copping, 2015). Recent advances in remote sensing
and geographical information system (GIS) techni-ques allow us to estimate with great precision the
shoreline position and the shoreline changes over the years (Alesheiikh et al.,2007; Ayadi, Boutiba, Sabatier, & Guettouche,2015; Braga, Tosi, Prati, & Alberotanza, 2013; Maglione, Parente, & Vallario, 2014; Maiti & Bhattacharya, 2009; Mills, Buckley, Mitchell, Clarke,
& Edwards, 2005; Moore, 2000; Moussaid, Fora,
Zourarah, Maanan, & Maanan, 2015; Natesan,
Parthasarathy, Vishnunath, Kumar, & Ferrer, 2015;
Palazzo et al., 2012; Pardo-Pascual,
Almonacid-Caballer, Ruiz, & Palomar-Vázquez, 2012), and it
should be noted that the use of any particular method of analysis being influenced by the data sources and the resources available.
Amongst the human-induced factors (Manca,
Pascucci, Deluca, Cossu, & Andreucci, 2013), the
increase in anthropogenic pressure, observed in coastal areas over the last 50 years, has increased the vulnerabil-ity of the territory under the action of natural events such as floods (Fiori et al.,2014; Scionti et al.,2018), debris flow, storms and coastal flooding (Li, Yamazaki, Roeber, Cheung, & Chock, 2018), or a combination of these (Destro et al., 2018; Barbaro Petrucci et al., 2018). Furthermore, the construction of buildings, infrastruc-tures, ports and coastal defence works are of particular importance. Other important factors are the
construc-tion of hydraulic structures interfering with fluvial
dynamics such as levees, dams, inert drains from river beds and soil erosion by water (WSE).
CONTACTG. Foti [email protected] DICEAM Department, Mediterranea University of Reggio Calabria, Reggio Calabria 89122, Italy
© 2019 The Author(s). Published by Informa UK Limited, trading as Taylor & Francis Group.
This is an Open Access article distributed under the terms of the Creative Commons Attribution License (http://creativecommons.org/licenses/by/4.0/), which permits unrestricted use, distribution, and reproduction in any medium, provided the original work is properly cited.
Amongst the natural factors which influence the shoreline position, sea level (Rahman, Dragoni, & El-Masri,2011), wave action (Arena, Barbaro, & Romolo, 2013) and the interaction between longshore and river
transport (Borrello, Foti, & Puntorieri, 2017;
Tomasicchio, D’Alessandro, Barbaro, Musci, & De Giosa,2015) are of particular importance.
Misdiagnosis of the factors listed above can lead to environmental disasters as in the case of Saline Joniche, near the Messina Strait (Barbaro,2013), or in the case of Badolato, in the Calabrian Ionian coast (Miduri, Foti, & Puntorieri, 2017). Therefore, an accurate estimation of shoreline position and qualitative analysis of the causes of shoreline change (Li, Zhou, Zhang, & Kuang,2014) is important for coastal zone planning and management (Barbaro,2016). Moreover, for the Italian and Calabrian coasts, the importance of the aforementioned factors is accentuated by the high coastal development of both territories, over 7500 km of coast for Italy and over 700 km for Calabria, many of them in erosion (Barbaro, Foti, & Sicilia, 2014; Pranzini & Williams, 2013).
The paper, following the analysis of Barbaro, Bombino et al., (2018), describes a case study related to the mouth of the Sant’Agata River, where the analysis of the shoreline changes was carried out through the com-parison of various cartography data. Furthermore, the paper analyzes the main factors influencing the coastal dynamics in order to identify possible correlation between these factors and the shoreline changes. In the following sections, after the description of the study area, will be analyzed: wave climate and longshore transport, and river sediment contribution, which depends on var-iations of hydraulic structures, rainfall time series, land cover and WSE. Finally, a cross-analysis of all these factors will be carried out, to understand the relative influence to shoreline changes.
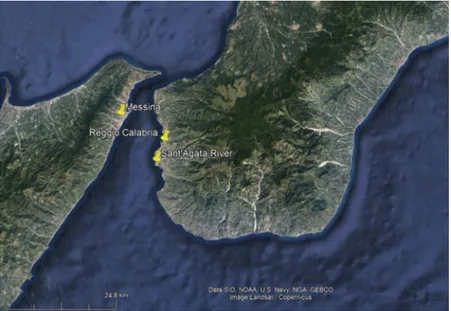
Site description
The study area is located in the Southern part of Reggio Calabria, a city located in Italy in the southern part of the Calabria region near the Messina Strait (Figure 1), and it is characterized by the presence of both sea and mountains very close to each other and
by the presence of“fiumare”. These are typical rivers
of southern Italy with torrential and irregular regime, characterized by extensive dry periods and with
fre-quent events of suddenflood, generated by short and
intense rainfall (Terranova, Antronico, Coscarelli, &
Iaquinta, 2009). In Reggio Calabria there are more
than 10 fiumare and, not far from the Sant’Agata,
there are the Calopinace, Armo and Valanidi rivers, all enclosed in a few kilometers. The study area is heavily anthropized due to the presence, especially,
of the airport, between Sant’Agata and Armo rivers,
a sport center and various industrial activities (Figures 2–3) (Versaci, Minniti, Foti, Canale, & Barillà,2018).
Shoreline changes
The analysis of the shoreline changes was carried out through the comparison of various cartography data, which consists of: aerophotogrammetry provided by Italian Military Geographic Institute, orthophotos taken from the Open Data section of the National Geoportal, and satellite imagery provided by Google Earth.
The analysis was divided into three phases as follows. Thefirst phase concerned the manual digitization of the shoreline, for each cartography data and using QGIS for aerophotogrammetry and orthophotos and using the spatial analysis tools of Google Earth Pro for satellite imagery. The second phase concerned the evaluation of the beach width at a transept positioned at the mouth of the Sant’Agata river (Figures 4–8). Finally, the last phase
concerned the determination of shoreline rates of change using end point rate (EPR) and net shoreline movement (NSM) statistics (Table 1).
Regarding the identification of the correct shoreline, it should be noted that there are many reference lines representing the shoreline position (Boak & Turner,
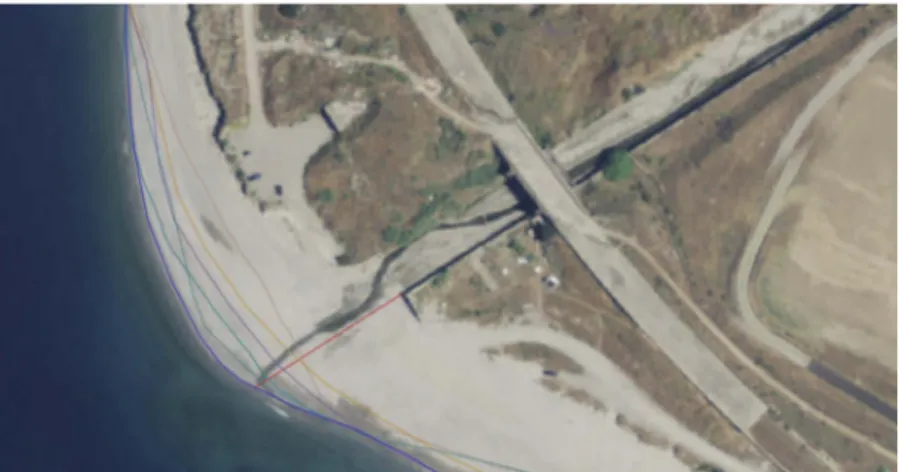
Figure 2.Detail of thefinal part of Sant’Agata river (satellite imagery of google earth pro).
Figure 3.Detail of thefinal part of Sant’Agata river, it is possible to observe the airport, a sport center and some industrial activities (source: satellite imagery of bing maps).
Figure 4.Shorelines and transept digitized using QGIS (scale 1:1000).
Legend: dark blue = 2012, light green = 2006, violet = 1998, yellow = 1996, brown = 1985, dark green = 1954. The transept is shown in red and the background is the orthophotos of 2012.
2005). In the framework of a study based on photo-interpretation, the choice and extraction of a common line used for different images is required. In this paper, due to the varying oceanographic conditions among the different cartographies, the reference line chosen was the wet/dry line. It has been shown that the wet/dry line closely approximates the High Water Line (HWL, Moore,2000). Furthermore, in the area under examina-tion the tidal excursion is of the order of tens of centi-meters (Sannino, Carillo, Pisacane, & Naranjo,2015) so the effects on the variation of the shoreline position are negligible. The digitalization of the shoreline was carried out on a scale of 1:1000 on QGIS and on a higher scale on Google Earth Pro. Therefore, the shoreline position has precision of the order of the meter and the shoreline changes have been approximated to the meter. This accuracy is in agreement with the aims of the paper, which concern the evaluate of the erosion and advance-ment trends, and not their precise quantification.
Regarding the evaluation of the beach width at the transept, to automate the calculation a function which can determine the distance from a given point was
implemented on QGIS, using the“field calculator” in
the program attribute table as the starting point.
Furthermore, the transept originates from a fixed
point, represented by the end point of the levee located in the hydraulic left of the Sant’Agata River.
From the analysis of the results shown in Table 1
and in Figures 4–8, it is possible to observe how
advancement and erosion phases alternated from 1954 to today, from these data it is clear that: mini-mum width was observed in 2002 (32 m) while the maximum width was observed in 2015 (82 m).
Wave climate and longshore transport
The wave climate was analyzed starting from the wave data provided by the ABRC-MaCRO software,
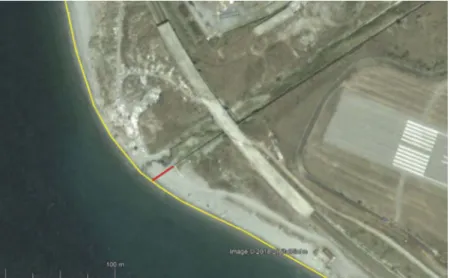
Figure 5.Shorelines of July 2002 and transept digitized using the spatial analysis tools of google earth pro.
Legend: yellow = shoreline, red = transept. (source: satellite imagery of google earth pro).
Figure 6.Shorelines of July 2007 and transept digitized using the spatial analysis tools of Google Earth Pro.
Legend: yellow = shoreline, red = transept. (source: satellite imagery of Google Earth Pro).
developed by HR Wallingford Ltd. This software allowed us to obtain a time series of wave data, starting
from the information available at the Met Office
data-base. This database is composed of data reconstructed
via the European Wave Model starting from windfield
data. The time series obtained using this software extends from 16 October 1986 to 31 March 2006 and consists of 147467 sea states, for each of which
significant height, mean and peak periods and
direc-tion are available. These data were grouped in sectors of 10° each and in classes with a significant height of 0.5 m each and a further grouping was made in time intervals (Table 2). These intervals were in agreement with the intervals emerged from the analysis of the shoreline changes. Starting with the time series, the following was calculated: frequency of occurrence of
Figure 7.Shorelines of March 2015 and transept digitized using the spatial analysis tools of google earth pro.
Legend: yellow = shoreline, red = transept. (source: satellite imagery of Google Earth Pro).
Figure 8.Shorelines of September 2017 and transept digitized using the spatial analysis tools of Google Earth Pro.
Legend: yellow = shoreline, red = transept. (source: satellite imagery of Google Earth Pro).
Table 1.Beach width at a transept positioned at river mouth, and NSM and EPR statistics.
Date Source Beach width [m] NSM [m] EPR [m/year]
2017 (September) Satellite 81 −1 −0.5 2015 (March) Satellite 82 0 0 2012 (June) Orthophotos 82 36 7.2 2007 (July) Satellite 46 −30 −30 2006 (May) Orthophotos 76 44 11 2002 (July) Satellite 32 −33 −8.3 1998 (May) Orthophotos 65 7 3.5 1996 (August) Orthophotos 58 5 0.5 1985 Aerophotogr. 53 −18 −1 1954 Aerophotogr 71
sea state (hereinafter referred to as frequency) (Figure
9), mean energy flux (Figure 10) and longshore
transport.
From the analysis of the results shown in Table 2
and inFigures 9–10, it is possible to observe that the
study area is characterized by modest wave motion: indeed, less than 1% of the recorded sea states exceeds the threshold of 1.5 m and no sea level exceeds the threshold of 3 m. This result is due the morphology of the territory: the study area is located within the Strait of Messina, in an area characterized by small fetch, of the order of ten km. The frequency is concentrated in two main directions: one from the North-West and one from the South. Regarding thefirst direction, it is associated with a high frequency but has a low energy content due to the small fetches. Regarding the second direction, it is characterized by a lower frequency than
the first but has much higher energy content due to
exposure to the wave coming from the southern mouth of the Strait.
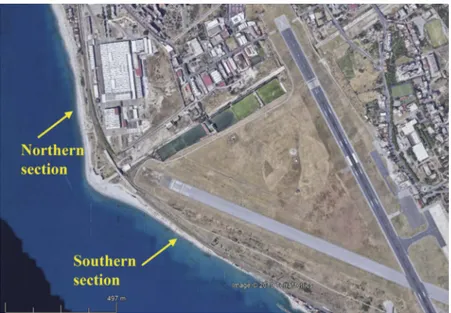
Longshore transport was estimated using the Tomasicchio, D’Alessandro, Barbaro, and Malara (2013) model (Table 3) and the study area was divided into two sections, one to the north and one to the south of the mouth, due to the different exposure to wave motion (Figure 11). The southern section has a small beach, of the order of meters, while the northern section has greater width, on average between 20 and 30 m.
From the analysis of the results shown inTable 3and inFigure 11, it is possible to observe that in the northern section the average value is about 20,000 m3/year while in the southern section the average value is about 11,000 m3/year, in both cases it is directed from South to North.
River sediment contribution
To study the river sediment contribution, variations of hydraulic structures, rainfall time series, land cover and WSE, estimated using the Gavrilovic (1959) model, were analyzed as for below. Preliminarily it was necessary to identify and morphometrically characterize the catch-ment area using QGIS and MapWindow and its Watershed Delineation plugin.
Table 2.Wave data, grouped in classes and in time intervals.
Hs[m]/Recorded 1986–2006 1986–1996 1996–1998 1998–2002 2002–2006 0.0–0.5 125595 62953 12449 29430 20763 0.5–1.0 19240 12885 768 3632 1955 1.0–1.5 1777 1695 1 64 17 1.5–2.0 732 709 0 0 23 2.0–2.5 113 113 0 0 0 2.5–3.0 10 10 0 0 0 Total 147467 78365 13218 33126 22758
Figure 9.Frequency of occurrence of the entire time series.
Figure 10.Mean energyflux of the entire time series.
Table 3.Longshore transport on southern and northern sec-tions in different time periods.
Time period
Longshore transport on southern section [m3/year]
Longshore transport on northern section [m3/year] 1986–2006 20000 11000 1986–1996 32000 14000 1996–1998 3600 6000 1998–2002 4500 7300 2002–2006 11600 9000
Morphometric characteristics of the Sant’Agata River basin
The identification and morphometric characterization
phase of the catchment area was carried out by starting with the data available in the OpenData section of the
Calabrian Geoportal (http://geoportale.regione.calab
ria.it/). In particular, the DEM with square mesh of 5 m and the shapefile of the watercourses were used
and the river basin (Figure 12), the perimeter, the
main stream length, the maximum, minimum and the average heights, the average slope, the Horton order, the run-off time and the Gravelius index were calculated (Table 4). The basin has an elongated shape, has a considerable altitude difference between moun-tain and mouth sections, over 1600 m, a high slope, about 40%, and a modest run-off, less than 3 hours. Hydraulic structures
The latest census of hydraulic structures in the Sant’Agata River dates back to 2010, the results have been implemented in the Archimede information
system (Labate,2010). This system is a section of the territorial information system of Calabria region civil
protection. The first structures date back to 1880;
subsequent interventions were carried out several times in 1913, between the years 1924 and 1937, between the years 1950 and 1956, around the years 1980 and 2000. Currently, 130 transverse works were surveyed along the main stream and along 3 tribu-taries (Sant’Elia, Cropazzoli and Basile) and about 75% of these are in good condition.
Rainfall data
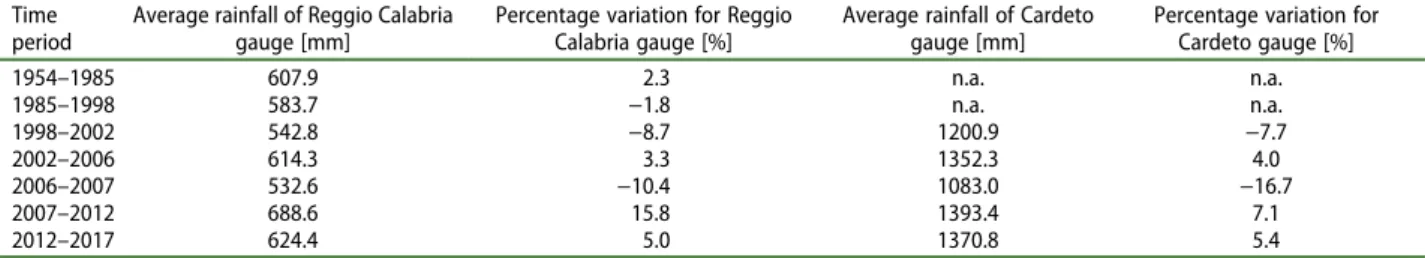
There are 2 gauges in the Sant’Agata River basin and in its neighboring areas (Figure 13). Table 5 shows the registration period, the number of years available, the elevation, the weight, calculated using the Thiessen poly-gon method (ASCE,1996; Fiedler,2003), and the average rainfall and temperature for each gauge.Table 6shows the average annual rainfall values for each gauge from a sufficiently large period before 1954 to today, divided into time intervals consistent with those identified in the
Figure 11.Southern and northern sections in which the study area was divided.
paragraph on the shoreline changes.Table 6also shows the percentage variations, compared to the average rain-fall, for each gauge and for each time interval.
From the analysis of the results shown inTables 5–6, it is possible to observe that in each interval the percen-tage variations are of an agreed sign for both stations. Moreover, the greatest positive variation for both stations were observed in the same period, 2007–2012, with about 16% more for Reggio Calabria gauge and 7% more for Cardeto gauge. Also, the major negative variations for both stations were observed in the same period, 2006–2007, with about 10.5% less for Reggio Calabria gauge and about 17% less for Cardeto gauge. Other
significant variations were observed in the
2012–2017 period, between 5 and 5.5% positive for both stations, and in the 1998–2002 period, between 8 and 9% negative for both stations.
Land cover
The land cover data used was from the Corine Land Cover project and relates to the years 1990 to 2012. This was divided into three periods, being 1990–2000,
2000–2006 and 2006–2012, and was freely available on
the government agency website“Istituto Superiore per la
Protezione e la Ricerca Ambientale (ISPRA)”. It should be noted that data before 1990 and after 2012 is not available. Comparing these periods, it is possible to observe that only negligible percentages of the entire surface of the basin have undergone changes (Figure 14).
Soil erosion by water (WSE)
Over recent decades, WSE has become a severe and extended issue affecting all European countries, although to varying degrees. The European Mediterranean coun-tries are particularly prone to erosion, because they are subject to prolonged dry periods followed by heavy ero-sive rains falling on steep slopes characterized by fragile soils (Grimm, Jones, & Montanarella, 2002,2003; Van der Knijff, Jones, & Montanarella,1999). In particular, natural conditions and the human impact have made Calabria in southern Italy particularly prone to intense WSE (Terranova et al.,2009). For this reason, river sedi-ment contribution was evaluated using the Gavrilovic (1959) model, which is based on an analytical equation to determine the annual volume of detached soil due to surface erosion. This equation depends on the average yearly precipitation, the average yearly temperature, the drainage area, the average slope of the basin and some coefficients related to the soil protection (a function of the type of vegetation cover), the erodibility (a function of type of rock), the erosion, and the stream network devel-opment (a function of the type of basin erosion). The annual river sediment transport averages 20,000 m3/year.
Discussion and conclusions
The analysis of shoreline changes is very important for coastal planning and management. This paper describes a case study on the analysis of shoreline changes near the mouth of the Sant’Agata river, which analyzed the
Figure 13.Active gauges in Sant’Agata River basin and in its neighboring areas.
Table 5.Registration period, number of years available, elevation, weight and average rainfall and temperature for each gauge.
Gauge Registration period Years available Elevation[m] Weight [%] Average rainfall [mm] Average temperature [°C] Reggio Calabria 1917–2017 98 10 20 594.4 18.9
Cardeto 1999–2017 19 690 80 1300.6 11.1
Table 4. Morphometric characteristics of Sant’Agata River basin.
Parameter Value
Area 52.3 km2
Perimeter 54.3 km
Main stream lenght 26.2 km
Maximum height 1665 m
Minimum height 0 m
Average height 865.6 m
Average slope 37.4%
Horton order 5
Run-off time 2.9 hour
possible correlations between the shoreline changes and the main factors that influence it. In particular, the wave climate, the longshore transport and the contribution of river sediments were analyzed, influenced by changes in hydraulic structures, precipitation regime, land cover and WSE. This last factor has been analyzed because the Mediterranean European countries, including the Calabria region, are particularly exposed to the WSE.
The analysis of possible correlations between the shoreline changes and the main factors that influence it was carried out using an empirical decomposition method, which is one of the classic models of time series analysis. The method was applied to each factor examined, to compare the evolutionary trend of this factor with the evolutionary trend of the shoreline to assess if there is a correlation between them. This analysis was restricted mainly to the interval 1986–2006, in which data of all the parameters exam-ined are available. In particular, it is possible to observe that river transport is, on average, of the same amount of longshore transport south of the mouth, and in this section the beach is a few meters wide, while north of the mouth is larger, and in this section the beach is between 20 and 30 m wide.
Moreover, due to the morphology of the territory, both the wave motion and, consequently, the long-shore transport are modest. During the period 1986–1996, where the shoreline has progressed slightly, longshore transport has assumed the highest values. In the period 1996–1998, where the shoreline
advanced at a speed of 3.5 m/year, longshore trans-port has assumed the lowest values. In the period
1998–2002, where the shoreline has eroded at
a speed of over 8 m/year, longshore transport has assumed lower than average values. In the period 2002–2006, in which the shoreline advanced at a speed of 11 m/year, on the other hand, longshore transport has assumed values above the previous interval, but still below average values. Therefore, there seems to be no correlation between these parameters.
Regarding the contribution of river sediments, the
influence of hydraulic structures is limited because
most of them were built before the period analyzed and the changes to the land cover affected a negligible portion of the basin. Furthermore, changes in precipi-tation have always been consistent with shifts in the shoreline in all periods analyzed. Therefore, in this case study, there seems to be a direct correlation between precipitation and changes in the coastline. This is consistent with the hydrological characteristics of most of the Calabrian rivers and, in general, of many Mediterranean rivers in which the WSE plays an important role.
The methodology for analyzing shoreline changes, as described in this article, is particularly useful to
better understand the factors that most influence the
coastal sediment balance and, therefore, is applicable to many contexts that are similar to the mouth of the Sant’Agata river.
Figure 14.Land cover variations in the Sant’Agata River basin.
Disclosure statement
No potential conflict of interest was reported by the authors.
References
Addo, K.A. (2013). Shoreline morphological changes and the human factor. Case study of Accra Ghana. Journal of Coastal Conservation, 17(1), 85–91. doi: 10.1007/s11852-012-0220-5
Alesheikh, A.A., Ghorbanali, A., & Nouri, N. (2007). Coastline change detection using remote sensing. International Journal of Environmental Science and Technology, 4(1), 61–66. doi:10.1007/BF03325962
Arena, F., Barbaro, G., & Romolo, A. (2013). Return period of a sea storm with at least two waves higher than afixed threshold. Mathematical problems in engineering, 2, 1–6. doi:10.1155/2013/416212.
ASCE. (1996). Hydrology handbook. ASCE Manuals and Reports on Engineering Practice n. 28.
Ayadi, K., Boutiba, M., Sabatier, F., & Guettouche, M.S. (2015). Detection and analysis of historical variations in the shoreline, using digital aerial photos, satellite images, and topographic surveys DGPS: Case of the Bejaia bay (East Algeria). Arabian Journal of Geosciences, 9, 1–18. Barbaro, G. (2013). Saline Joniche: A predicted disaster.
Disaster Advances, 6, 1–3.
Barbaro, G. (2016). Master Plan of solutions to mitigate the risk of coastal erosion in Calabria (Italy), a case study. Ocean & Coastal Management, 132, 24–35. doi:10.1016/j. ocecoaman.2016.08.001
Barbaro, G., Bombino, G., Fiamma, V., Foti, G., Puntorieri, P., Minniti, F., & Pezzimenti, C. (2018). Shoreline changes at Sant’Agata River mouth (Reggio Calabria, Italy). Proocedings of the 9th Conference of the Italian Society of Remote Sensing, Firenze, Italy.
Barbaro, G., Foti, G., & Sicilia, C.L. (2014). Coastal erosion in the South of Italy. Disaster Advances, 7, 37–42. Barbaro, G., Petrucci, O., Canale, C., Foti, G., Mancuso, P.,
& Puntorieri, P. (2018). Contemporaneity offloods and storms. A case study of metropolitan area of Reggio Calabria in Southern Italy. Prooceedings of New Metropolitan Perspectives (NMP), Reggio Calabria, Italy. Boak, E.H., & Turner, I.L. (2005). Shoreline definition and
detection: A review. Journal of Coastal Research, 21(4), 688–703. doi:10.2112/03-0071.1
Borrello, M.M., Foti, G., & Puntorieri, P. (2017). Shoreline evolution near the mouth of the Petrace River (Reggio Calabria, Italy). Proceedings of the 9th International Conference on River Basin Management, Prague, Czech Republic.
Braga, F., Tosi, L., Prati, C., & Alberotanza, L. (2013). Shoreline detection: Capability of COSMO-SkyMed and high-resolution multispectral. European Journal of Remote Sensing, 46(1), 837–853. doi:10.5721/ EuJRS20134650
Destro, E., Amponsah, W., Nikolopoulos, E.I., Marchi, L., Marra, F., Zoccatelli, D., & Borga, M. (2018). Coupled prediction offlash flood response and debris flow occur-rence: Application on an alpine extreme flood event. Journal of Hydrology, 558, 225–237. doi:10.1016/j. jhydrol.2018.01.021
European Union. (2012). Sustainable tourism in the Mediterranean. Report. ISBN: 978-92-895-0667-0. doi: 10.2863/69472.
Fiedler, F.R. (2003). Simple, practical method for determin-ing station weights usdetermin-ing thiessen polygons and isohyetal maps. Journal of Hydrologic Engineering, 8(4), 219–221. doi:10.1061/(ASCE)1084-0699(2003)8:4(219)
Fiori, E., Comellas, A., Molini, L., Rebora, N., Siccardi, F., Gochis, D.J., . . . Parodi, A. (2014). Analysis and hindcast simulations of an extreme rainfall event in the Mediterranean area: The Genoa 2011 case. Atmospheric Research, 138, 13–29. doi:10.1016/j.atmosres.2013.10.007
Gavrilovic, S. (1959). Method for classification of stream basins and new equations for the calculation of high waterflood and sediment load. Vadoprivreda. Belgrado, Serbia.
Grimm, M., Jones, R.J.A., & Montanarella, L. (2002). Soil erosion risk in Europe. European Soil Bureau Research Report, EUR 19939 EN. Luxembourg: Office for Official Publications of the European Communities.
Grimm, M., Jones, R.J.A., & Montanarella, L. (2003). Soil erosion risk in Italy: A revised USLE approach. European Soil Bureau Research Report No. 11, EUR 20677 EN. Luxembourg: Office for Official Publications of the European Communities.
Komar, P.D. (2000). Coastal erosion–Underlying factors and human impacts. Shore & Beach, 68(1), 3–16. Labate, A. (2010). Sviluppo di un sistema informative
terri-toriale per la catastazione delle opere di sistemazione idraulica aifini del monitoraggio e della prevenzione del rischio idrogeologico: un esempio applicativo in Calabria (Agrarian Degree Thesis). (in Italian)
Li, N., Yamazaki, Y., Roeber, V., Cheung, K.F., & Chock, G. (2018). Probabilistic mapping of storm-induced coastal inundation for climate change adaption. Coastal Engineering, 133, 126–141. doi:10.1016/j.coastaleng.2 017.12.013
Li, X., Zhou, Y., Zhang, L., & Kuang, R. (2014). Shoreline change of Chongming Dongtan and response to river sediment load: A remote sensing assessment. Journal of
Hydrology, 511, 432–442. doi:10.1016/j.
jhydrol.2014.02.013
Maglione, P., Parente, C., & Vallario, A. (2014). Coastline extraction using high resolution WorldView-2 satellite imagery. European Journal of Remote Sensing, 47(1), 685–699. doi:10.5721/EuJRS20144739
Maiti, S., & Bhattacharya, A.K. (2009). Shoreline change analysis and its application to prediction: A remote sen-sing and statistics based approach. Marine Geology, 257 (1–4), 11–23. doi:10.1016/j.margeo.2008.10.006
Manca, E., Pascucci, V., Deluca, M., Cossu, A., & Andreucci, S. (2013). Shoreline evolution related to coastal development of a managed beach in Alghero, Sardinia, Italy. Ocean and Coastal Management, 85, 65–76. doi:10.1016/j.ocecoaman.2013.09.008
Miduri, M., Foti, G., & Puntorieri, P. (2017). Impact gener-ated by Marina of Badolato (Italy) on adjacent coast. Proceeding of the 13th International Congress on Coastal and Marine Sciences, Engineering, Management and Conservation MEDCOAST, Mellieha, Malta.
Mills, J.P., Buckley, S.J., Mitchell, H.L., Clarke, P.J., & Edwards, J. (2005). A geomatics data integration techni-que for coastal change monitoring. Earth Surface Processes and Landforms, 30(6), 651–664. doi:10.1002/ (ISSN)1096-9837
Moore, L.J. (2000). Shoreline mapping techniques. Journal of Coastal Research, 16, 111–124.
Moussaid, J., Fora, A.A., Zourarah, B., Maanan, M., & Maanan, M. (2015). Using automatic computation to
Pilkey, O.H., & Hume, T. (2011). The shoreline erosion problem: Lessons from the past. Water & Atmosphere, 9 (2), 22–23.
Pranzini, E., & Williams, A. (2013). Coastal erosion and protection in Europe. Oxon: Routledge.
Rahman, A.F., Dragoni, D., & El-Masri, B. (2011). Response of the Sundarbans coastline to sea level rise and decreased sediment flow: A remote sensing assessment. Remote
Sensing of Environment, 115(12), 3121–3128.
doi:10.1016/j.rse.2011.06.019
Sannino, G., Carillo, A., Pisacane, G., & Naranjo, C. (2015). On the relevance of tidal forcing in modeling the Mediterranean thermohailine circulation. Progress in
Oceanography, 134, 304–329. doi:10.1016/j.
pocean.2015.03.002
Scionti, F., Miguez, M.G., Barbaro, G., De Sousa, M.M., Foti, G., & Canale, C. (2018). An integrated methodology for urban flood risk mitigation: The case study of Cittanova (Italy). Journal of Water Resources Planning
model. Coastal Engineering, 104, 69–75. doi:10.1016/j. coastaleng.2015.07.003
Van der Knijff, J.M., Jones, R.J.A., & Montanarella, L. (1999). Soil erosion risk assessment in Italy. EUR 19044EN. European Soil Bureau. Luxembourg: Office for Official Publications of the European Communities. Versaci, R., Minniti, F., Foti, G., Canale, C., & Barillà, G.C.
(2018). River anthropization: Case studies in Reggio Calabria (Italy). Proceedings of 10th International Conference on Sustainable development and Planning, Siena, Italy.
Walling, D.E. (2006). Human impact on land–Ocean sedi-ment transfer by the world’s rivers. Geomorphology, 79, 192–216. doi:10.1016/j.geomorph.2006.06.019
Yang, Z., Wang, T., Voisin, N., & Copping, A. (2015). Estuarine response to riverflow and sea-level rise under
future climate change and human development.
Estuarine, Coastal and Shelf Science, 156, 19–30. doi:10.1016/j.ecss.2014.08.015