A simple and robust event-detection algorithm for
single-cell impedance cytometry
F. Caselli, P. Bisegna
Abstract—Microfluidic impedance cytometry is emerging as a powerful label-free technique for the characterization of single biological cells. In order to increase the sensitivity and the specificity of the technique, suited digital signal processing methods are required to extract meaningful information from measured impedance data.
In this work, a simple and robust event-detection algorithm for impedance cytometry is presented. Since a differential measuring scheme is generally adopted, the signal recorded when a cell passes through the sensing region of the device exhibits a typical odd-symmetric pattern. This feature is exploited twice by the proposed algorithm: first, a preliminary segmentation, based on the correlation of the data stream with the simplest odd-symmetric template, is performed; then, the quality of detected events is established by evaluating their E2O index, that is, a measure of the ratio between their even and odd parts.
A thorough performance analysis is reported, showing the robustness of the algorithm with respect to parameter choice and noise level. In terms of sensitivity and positive predictive value, an overall performance of 94.9% and 98.5%, respectively, was achieved on two datasets relevant to microfluidic chips with very different characteristics, considering three noise levels.
The present algorithm can foster the role of impedance cytometry in single-cell analysis, which is the new frontier in “Omics”.
Index Terms—single-cell analysis, impedance cytometry, event detection, odd-symmetry, correlation.
I. INTRODUCTION
S
INGLE cell analysis will be critical in the future in a va-riety of applications with extremely high socio-economic impact, including early cancer diagnosis, pharmaceutics and food analysis. However, a simple and cheap, yet high per-formance, single-cell assay system is presently lacking. Stan-dard methods like flow-cytofluorimetry-based assays require complex equipment, costly fluorescent labeled antibodies and skilled technicians. In the last two decades, microfluidic impedance cytometry has emerged as a simple and label-free alternative approach, exploiting electrical techniques to provide cell characterization on the basis of differences in size and dielectric properties [1].F. Caselli and P. Bisegna are with the Department of Civil Engineering and Computer Science, University of Rome “Tor Vergata”, 00133 Rome, Italy (e-mail:{caselli, bisegna}@ing.uniroma2.it).
The research leading to this work was supported by the European Union Seventh Framework Programme (FP7/2007-2013) through the Research Ex-ecutive Agency under Grant 286692-DIMID Project entitled “Development of an Innovative Microfluidic Impedance-Based Device for Multi-Parametric Cell Analysis,” and by the Scientific Independence of Young Researchers Programme (SIR 2014) under Grant RBSI14TX20-MUSIC Project entitled “Multidimensional Single-Cell Microfluidic Impedance Cytometry.”
Copyright (c) 2014 IEEE. Personal use of this material is permitted. However, permission to use this material for any other purposes must be obtained from the IEEE by sending an email to [email protected].
-+ -+ -+ flow
~
cell AC (0.1-10 MHz) electrodes microchannel (typical cross section: 40 um x 40 um)detection circuit
Fig. 1. Schematic diagram of a single-cell impedance analysis system. The device consists of two sets of parallel facing electrodes fabricated inside a microfluidic channel. AC excitation signals are applied to the top pair of electrodes, and the difference in current flowing through the bottom two electrodes is measured using a differential amplifier. Cells suspended in an electrolyte flow through the microchannel one at a time, so that the circuitry can determine the AC electrical properties of single cells.
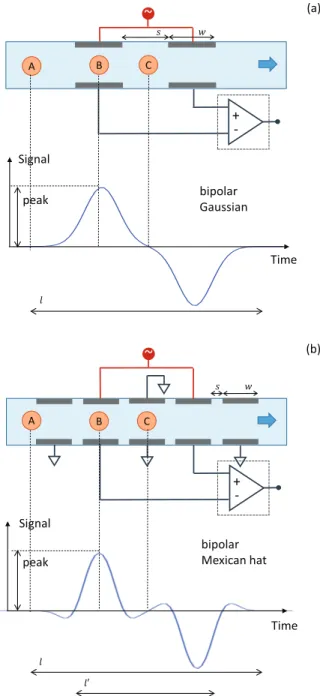
The schematic and the working principle of an impedance cytometer are illustrated in Fig. 1 [4]. Two pairs of parallel facing microelectrodes are integrated into the wall of a fluid-filled microchannel. An AC, possibly multifrequency, excita-tion signal is applied to the top electrodes, and the differential current flowing through the bottom electrodes is measured by means of a differential amplifier. The output signal is demodulated by a lock-in amplifier giving the in-phase and out-of phase components for each frequency. Individual cells, focused on the microchannel axis by means of sheath flow or dielectrophoretic forces [5], [6], flow sequentially through the microchannel. When a cell passes through the electrode region, a variation of the differential signal is recorded, which exhibits a typical odd-symmetric pattern (Fig. 2(a)). In fact, when the cell passes position A, it begins to pose an hindrance to the current drained by the left bottom electrode. Such an hindrance is maximal when the cell is aligned with the center of the left electrode pair (position B), where the signal peak amplitude is recorded. The signal then progressively decreases and reaches zero when the cell is in the middle of the sensing region (position C), which corresponds to a symmetric configuration. Past position C, a specular and reversed profile is recorded. The overall profile is well described by means of a bipolar Gaussian function [2]. Different electrode patterns can give rise to bipolar profiles deviating from the Gaussian shape. In particular, in case of the multi-electrode chip depicted in Fig. 2(b) [3], a bipolar Mexican-hat profile is observed. In
~
+ -bipolar Gaussian Time Signal peak C B (a) A ݓ ݏ ݈~
+ -C A bipolar Mexican hat Time Signal B (b) peak ݈ ݓ ݏ ݈ԢFig. 2. Idealised differential signal seen when a particle focused on the microchannel axis passes through the sensing region of the device. (a) Standard four-electrode chip (e.g., [2]): the differential impedance signal exhibits a bipolar Gaussian profile. (b) Multi-electrode chip [3]: the differential impedance signal exhibits a bipolar Mexican-hat profile.
fact, when the cell passes position A, it initially offers an hindrance to the current drained by the leftmost grounded electrode, thus facilitating the current drained by the adjacent measuring electrode.
For cells in a highly conductive fluid, multi-frequency mea-surements in the radio-frequency range (100 kHz – 10 MHz) give multiparametric, high-content data that can be used to dis-tinguish cell populations. At low frequencies (below 500 kHz), the cell membrane, exhibiting a capacitive behaviour, offers significant barrier to current flow and the signal amplitude reveals the cell size. At intermediate frequencies (around 1 MHz), membrane polarization is reduced, and the signal
Time [ms] 2960 2980 3000 3020 3040 3060 Signal [mV] -20 -10 0 10 20 (a) Time [ms] 2993.7 2994.7 -10 -5 0 5 10 (b) Time [ms] 3011.7 3012.7 -1 0 1 (c)
Fig. 3. Impedance cytometry data at 0.5 MHz (courtesy of University of Southampton), real part shown. (a) A portion of the data stream. Two events are highlighted with a box, and zoomed in (b) and (c). Signal-to-noise ratio is SNR = 22 dB in (b) and SNR = 5 dB in (c).
conveys information about membrane capacitance. At high frequencies (above some MHz), the membrane is minimally polarized, and measurements give information about cyto-plasm conductivity and permittivity [1].
Recent work using microfabricated systems has demon-strated the capability to analyze micro-organisms [7], [8], erythrocytes [9], [10], leukocytes [11], platelets [12], and animal and human cell lines [13], [14], [15], [16]. However, microfluidic impedance cytometry has not yet reached full maturity, since sensitivity, specificity and throughput still need to be improved to cope with the most demanding applications. In this regard, effort has focused on fabricating novel designs of micro-device and developing new detection techniques (e.g. [17], [18], [19], [20]), but there has been little attempt at developing ways of extracting meaningful data from measured signals using signal processing [2].
The first step in impedance cytometry data processing is the event detection, that is the identification of a cell passing through the sensing region of the device (Fig. 3). This step provides the total cell count and is critical to the further steps of feature extraction and classification. A reliable event-detection strategy is especially important in case that rare cells (e.g., circulating tumor cells) or small cells (e.g., platelets) have to be detected.
Event detection represents an essential step in many biomed-ical signal processing applications, such as QRS complex detection [21], electrogram event detection [22], detection of rapid-eye movements in sleep studies [23], heartbeat and respiration detection [24], pulse peak determination in digital volume pulse waveforms [25]. Accordingly, many different methods have been developed, which most often rely on some peculiar feature of the application at hand.
In the available literature on impedance cytometry, the event detection is usually performed with proprietary algorithms or custom-built programs, and quantitative performance analysis is not reported. Frequently, simple peak-finding approaches
are adopted [26], [27], [28], which however require a suitable threshold choice, whose setting can be critical, and suffer from sensitivity to noise, so that a preliminary denoising step is often needed. A wavelet-based event detection has been adopted in [12]. In [2] an approach has been described that uses correlation of the signal with a bipolar Gaussian template depending on three parameters (transit-time, peak width and peak amplitude), whose optimal values were fitted with ref-erence to beads of two different sizes. In general, the fitting template may vary due to chip electrode configuration, which influences the shape of the bipolar profile (e.g., Gaussian vs Mexican-hat profile), or flow rate and cell off-centering, which determine the transit-time. Extreme cell off-centerings can also induce an altered shape (e.g., bipolar M-shaped profiles [29], [30]). Finally, for non-spherical cells, the signal profile may be affected by cell orientation [3].
In this paper, a simple and robust event-detection algorithm is presented, which fruitfully exploits the odd-symmetric na-ture of the measured differential signal. The algorithm acts in two steps: a preliminary segmentation is followed by an event-quality check. The segmentation is based on the correlation of the data stream with the simplest odd-symmetric template, which emphasizes the odd-symmetric structures present in the data stream; the quality of a detected event is then established by evaluating its E2O index, that is, a measure of the ratio between its even and odd parts. If such an index is too high, the event is rejected.
The paper is organized as follows: the algorithm is described in Section II, performance evaluation is reported in Section III, and conclusions are drawn in Section IV. A Matlab script generating synthetic impedance cytometry data is provided as supplementary material to the interested Reader.
II. ALGORITHM DESCRIPTION A. Segmentation
The frequency channel with the best signal-to-noise ratio (SNR) is selected for the segmentation. The relevant signal, comprising an in-phase (real) and out-of-phase (imaginary) component, is denoted by s.
1) Cross-Correlation: In order to emphasize the odd-symmetric structure typical of an event (Fig. 4(a)), the cross-correlation c of the signal s with the odd-symmetric template h depicted in Fig. 4(b) is computed, that is,
c = s⊗ h , (1) with h[n] = 1 n =−L , . . . , −1 , 0 n = 0 , −1 n = 1 , . . . , L . (2)
The half-length L of the template h is chosen as discussed in Section II-A3. An event is characterized by the appearance of a three-peak feature in the modulus|c| of the correlation signal (Fig. 4(c)). In order to obtain a one-peak feature (Fig. 4(e)), the signal |c| is cross-correlated with a Gaussian template of standard deviation σg= L/2 (Fig. 4(d)), that is,
b =|c| ⊗ g , (3) Time [ms] 479 480 481 482 483 484 485 486 Signal [mV] -10 -5 0 5 10 A B C (a) Time [ms] 479 480 481 482 483 484 485 486 Smoothed correlation 0 0.2 0.4 0.6 bP (b)
Fig. 5. Peak finding. (a) Recorded data stream comprising three events: event A is relatively small, events B and C are close to each other. The real part of the signal at 0.5 MHz is shown. (b) After cross-correlation, modulus and smoothing, events A, B and C are singled out by peak finding.
where
g[n] = exp (−n2/(2σg2)) , n =−L , . . . , L . (4)
The smoothed counterpart b of signal|c| is then aligned with the original signal s.
2) Peak detection: The events are singled out from signal
b by peak finding (Fig. 5). In particular, the local maxima pi exceeding a given threshold bth, and their locations Ci, are provided by the Matlab functionfindpeak. Events ei are defined by
ei[n] = s[Ci+ n] , n =−L , . . . , L . (5) An effective choice of the threshold bth, not requiring any in-formation on signal amplitude, is given by a suitable percentile bP of the samples of b. In order to avoid sensitivity loss, the relevant percentage P is chosen to be lower than the expected overall percentage of signal samples not interested by events (with usually adopted dilutions, a value of P around 90–95% is expected). Even lower values of P may be safely adopted in case of very noisy signals, high specificity being guaranteed by the event-quality check (Section II-B). The percentile ranks ri of local maxima pi, to be used in Section II-A3, are also recorded.
3) Template-length selection: The odd-symmetric template h is maximally effective at emphasizing a bipolar event, provided that its length is matched to the event length. The latter is given by the product of sampling frequency fsand cell transit-time T along the measuring zone, which is the ratio of measuring-zone length l and cell-velocity v, i.e. T = l/v. In turn, cell velocity depends on velocity profile and cell position within the cross-section. Assuming laminar flow and steady state conditions, cells flowing along the channel axis have the highest velocity, vmax, that can be easily computed from the flow rate and the channel dimensions [31]. Accordingly, the minimum transit-time is
(a)
s
Rs
I(b)
h
(c)
|c|
(d)
g
(e)
b
Fig. 4. (a) Example of signal recorded when a particle passes through the sensing region of the device shown in Fig. 2(b) (0.5 MHz excitation frequency). Both real sRand imaginary sI parts exhibit a bipolar Mexican-hat profile. (b) The simplest odd-symmetric template h. (c) Modulus of the cross-correlation signal c, exhibiting a three-peaks feature. (d) Gaussian smoothing template g. (e) Smoothed counterpart b of signal|c|, characterized by only one peak.
Sample [-] 5 10 15 20 25 Signal [mV] -1 -0.5 0 0.5 1 e E2O = 0.31 25 50 -1 -0.5 0 0.5 1 eE 25 50 -1 -0.5 0 0.5 1 eO
Fig. 6. A measured event e (SNR = 6 dB) along with its even and odd parts, eEand eO, respectively, upsampled at a rate R = 4. The relevant E
2O index is sufficiently small (E2O = 0.31), testifying the odd-symmetric pattern.
In order to catch fast (centered) as well as slow (off-centered) cells, the segmentation steps described in Sections II-A1 and II-A2 are therefore repeated by adopting the half-lengths of the following set:
L∈ ⌈fsTmin× (1.0, 1.1, 1.2, 1.5, 1.9, 2.4, 3.0)/2⌉ . (7)
Here cell velocities are assumed to be spread in the range
[vmax/3, vmax], and ceil brackets denote rounding to upper
integer. In case of bipolar Mexican-hat profiles, Tmin in (6) is preferably computed by referring to the reduced length
l′ ≈ 3l/5 (Fig. 2(b)), thus leaving out the two extremal zones
where the signal sign is opposite to that of the adjacent main peak, though the full length l is adopted for the event-quality check (Section II-B).
Repeating the analysis with several template half-lengths may lead to multiple detection of the same event. Therefore, the overall event collection {ei} is further processed as fol-lows: if two events emand enare closer than a small tolerance ∆, i.e. if|Cm− Cn| ≤ ∆, only the one with higher percentile rank r is retained. The tolerance ∆ is not critical, e.g. 30% of the sum of the events half-lengths is appropriate.
B. Event-quality check: the E2O index
In order to reject false positives, the quality of the detected events is assessed. To this end, the events are preliminarily cleansed of the local baseline. Then, for each event e (the i-subscript being omitted for ease of notation), the even and odd parts are computed
eE= e
++ e−
2 , e
O= e+− e−
2 , (8)
where e− and e+ denote the left and right portions of the event with respect to its center
e−[n] = e[−n] , e+[n] = e[n] , n = 0 , . . . , L . (9) In order to check the event quality, the following index is introduced
E2O =
||eE||
||eO||, (10)
where||·|| denotes the Euclidean norm of the enclosed vector. Any sampling error on the computation of the E2O index may be reduced by preliminarily upsampling eE and eO.
Due to typical odd-symmetric pattern, the even part eE of a true event is expected to be small with respect to its odd part eO, thus yielding a small value of the E
2O index. Conversely, a large value of the E2O index reveals a false positive, thus prompting event rejection. As shown in Section III, a threshold TE2O= 0.4 is effective.
As an example, Fig. 6 shows an event e (SNR = 6 dB) along with its even and odd parts, upsampled at a rate R = 4. The relevant E2O index is sufficiently small (E2O = 0.31), testifying the odd-symmetric pattern of a true event.
III. PERFORMANCE EVALUATION
The performance of event-detection algorithms is evaluated on the basis of the fraction of false positives and missed events. In particular, sensitivity and positive predictive value are usually taken as metrics (e.g., [24], [23]). In order to carry on a quantitative assessment of the latter, a ground truth is needed. Unfortunately, no impedance cytometry dataset with labeled events is publicly available. A gold standard signal processing method is not available either. On the other hand, manual an-notation by an expert technologist, besides being a tedious and time-consuming task, therefore limiting the number of events analyzed, is also prone to errors and subjectivity. In order to achieve an objective and reproducible performance analysis, in this work effort has been devoted to build reference datasets of synthetic impedance cytometry data, which reproduce with high fidelity experimentally measured data (Section III-A). The Matlab script developed for data synthesis is provided as supplementary material for the interested Reader, as a resource for developing and testing novel digital signal processing methods for impedance cytometry.
A. Data description
Two datasets relevant to microfluidic chips with very differ-ent characteristics have been built. Dataset 1 reproduces data reported in [2], whereas Dataset 2 mimics data measured in the framework of the DIMID FP7 Project [3].
1) Dataset 1: The experimental data shown in [2] have been acquired with a 20 µm× 20 µm channel equipped with two pairs of parallel-facing electrodes (Fig. 2(a)). Electrodes width w and spacing s were 20 µm both, yielding a measuring zone length l ≈ 100 µm. Polystyrene beads of 5.49 µm or 7.18 µm diameter were measured at 0.5 MHz, and the in-phase (real) part of the relevant differential signal was reported, with sampling frequency fs = 1 kHz. In correspondence with the passage of a bead, the signal exhibited a bipolar Gaussian profile well described by the following function of time t [2]:
f (t) = A(eg1(t)− eg2(t)) , (11) with g1(t) =− (t/δ + 1/2)2 2(σ/δ)2 , g2(t) =− (t/δ− 1/2)2 2(σ/δ)2 . (12) In the previous equations, δ is the peak-to-peak transit-time, the ratio σ/δ is a shape parameter governing the peak width, and A controls the amplitude. The optimal fitting parameters were δopt = 20 ms, (σ/δ)opt = 0.18, Aopt= 12.4 mV, for the 5.49 µm diameter bead, and δopt = 20 ms, (σ/δ)opt = 0.275,
Aopt = 32.1 mV, for the 7.18 µm diameter bead (Ref. [2], Figure 5). For the given geometry, a transit-time of 20 ms yields a bead velocity of 2 mm/s.
By adopting equation (11), a synthetic data stream contain-ing about 1500 events was generated. Half of the events were built using the parameters of the 5.49 µm bead, the other half using the parameters of the 7.18 µm bead. In particular, for each of the two populations, a normally distributed amplitude
A with mean value Aopt and standard deviation 0.3 Aopt
was considered. The event transit-times δ were generated by considering a laminar velocity profile [31] with peak-value of 2 mm/s (yielding a flow rate ϕ = 0.023 µL/min), and assum-ing a normally distributed off-centerassum-ing with zero mean and standard deviation 30% of channel size, along each transversal direction. Finally, a normally distributed shape parameter σ/δ with mean value (σ/δ)opt and standard deviation 0.02 was used.
For each population, a concentration of 400 particles/µL was considered. Denoting by c the overall concentration, the average number of events per sample of data stream was
λ = ϕ c/fs= 3.1× 10⁻⁴ sample−1. In order to generate the
event locations, occurrence of the cell counts was assumed to be a Poisson process [32]. Accordingly, the sequence of inter-arrival times is exponentially distributed with mean
1/λ ≈ 3300 samples. The expected fraction of coincidences
(i.e., two cells simultaneously present in the sensing region) is approximately given by ν ≈ c V , where V is the volume of the measuring zone. With the present settings it turns out
ν ≈ 3.2%. A slightly higher value ν = 4.5% was obtained in
the synthetic data, due to variability of particle velocities. Additive white noise was imposed, with standard deviation σN= 1 mV, which mimics the experimental data in Figure 5
Time [ms] 7673.8 7674.8 Signal [mV] -10 -5 0 5 10 (a) Time [ms] 39541.4 39542.4 Signal [mV] -1 0 1 (b)
Fig. 7. Examples of synthetic events. (a) SNR = 22 dB and (b) SNR = 6 dB.
TABLE I
2D-GAUSSIAN DISTRIBUTION OF(COMPLEX)EVENT AMPLITUDES: µ, MEAN VALUE; α,SLOPE OF LARGEST EIGENVALUE OF REAL AND IMAGINARY PART COVARIANCE MATRIX; σR,STANDARD DEVIATION OF REAL PART; ρ,REAL AND IMAGINARY PART CORRELATION COEFFICIENT.
µ [mV] α σR[mV] ρ
RBCs −8.22 − 2.65i 0.316 3.47 0.846 Beads −7.70 − 3.17i 0.460 2.33 0.784
of [2]. Noise level was amplified while testing the algorithm (see Section III-B2).
2) Dataset 2: The data were collected at the University
of Southampton by Prof. H. Morgan’s group. Microfluidic channel dimensions were 40 µm× 40 µm. Multiple parallel-facing electrode-pairs were integrated into the channel [3], as in Fig. 2(b). The electrode width and spacing were w = 30 µm and s = 10 µm, respectively, yielding a measuring zone length
l≈ 200 µm. The excitation frequency was 0.5 MHz, whereas
the sampling frequency was fs = 57.5 kHz. The analyzed sample consisted of a mixture of red blood cells (RBCs) and 6 µm diameter polystyrene beads, dispersed in phosphate buffered saline. For each population, real and imaginary peak amplitudes relevant to about 3500 events were fitted with a 2D-Gaussian distribution (Table I). The events exhibited bipolar Mexican-hat profiles, whence a reference template was obtained by averaging, upon rescaling to the same amplitude and duration.
A synthetic data stream of about 1500 events was then generated assuming a flow rate of 20 µL/min and a concen-tration of 50 particles/µL (both for beads and RBCs). Event transit times and locations were generated as for Dataset 1. Event amplitudes were drawn from the distributions reported in Table I. Corresponding scaled copies of the reference template were adopted to generate event profiles. A fraction of coincidences ν = 4.2% was observed in the synthetic data. Additive white noise affecting both the in-phase and the out-of-phase signal components was imposed, with standard deviation σN = 1.7(1 + i) mV mimicking the experimental data. Noise level was amplified while testing the algorithm (see Section III-B3). In the recorded data, a wandering baseline b was also present, which is well described by
b(t) = q + m t , (13)
with off-set q = (0.15− 0.3i) mV and slope m = (−6 + 12i) µV/s. That baseline has been imposed to the synthetic data stream.
Template half-length, L 5 10 15 20 25 30 35 40 45 E2 O index 0 0.2 0.4 0.6 0.8 1 mean confidence bound
Fig. 8. Mean value and two-sigma confidence bound of E2O index relevant to (false) events caught in a white noise stream, for different template half-lengths.
As an example, Fig. 7 shows two syntectic events, with (a) SNR = 22 dB and (b) SNR = 6 dB.
B. Results
1) Preliminary examination: Before testing the algorithm on the two aforementioned datasets, a preliminary investiga-tion has been conducted to assess the algorithm performance with respect to noise and parameter choice. As metrics, sen-sitivity (S) and positive predictive value (PPV) were adopted, defined as:
S = TP
TP + FN, PPV = TP
TP + FP, (14)
where TP, FN and FP are the number of true positives, false negatives, and false positives, respectively.
First, a data stream containing no events, consisting of white noise with uncorrelated real and imaginary parts, has been processed. Template half-lengths L ranging from 5 to 45 samples were adopted. The segmentation procedure described in Section II-A caught some (false) events, whose E2O index statistics are reported in Fig. 8 as a function of L. Though the cross-correlation with odd-symmetric templates h tends to favor E2O index values lower than 1, a mean value higher than 0.7 is found for L > 15. Even shorter template lengths, that may catch nearly odd-symmetric patterns randomly occurring in short sequences, provide a mean E2O index greater than 0.55. This result does not significantly depend upon noise stan-dard deviation, number of samples in data stream and centile percentage. Since true events are generally characterized by smaller values of the E2O index due to their odd-symmetric pattern, false events caught by the segmentation procedure (Section II-A) can be rejected by means of the quality check procedure described in Section II-B.
Second, a data stream containing 170 equal-amplitude bipolar-Gaussian events, generated according to equation (11), was processed under several noise levels. The shape parameter of the events was that of the 5.49 µm diameter bead in [2]. Event durations and locations were built as in Dataset 1. Coincidences were purged out from the data stream. Different
TABLE II
SENSITIVITY ANDPOSITIVEPREDICTIVEVALUE. Noise S[%] PPV[%] S∗[%] PPV∗[%] 1× 96.8 98.6 99.5 99.3 Dataset 1 2× 95.9 98.6 98.7 99.2 ν = 4.5% 3× 93.7 98.7 96.6 99.2 1× 97.0 98.2 99.7 98.9 Dataset 2 3× 95.6 98.2 98.3 98.8 ν = 4.2% 5× 90.6 98.5 93.1 99.1 Mean 94.9 98.5 97.7 99.1
algorithm parameter settings were investigated. In particular, centile percentages P ranging from 90% to 99.9%, and thresh-olds TE2O ranging from 0.25 to 0.75 were considered.
Fig. 9 shows algorithm sensitivity and PPV for SNRs of 5, 10, or 15 dB as a function of P and TE2O. As expected, PPV is favored by low values of TE2O. For all considered noise levels and centile percentages, TE2O≤ 0.5 yielded full PPV. On the other hand, sensitivity is favored by high values of TE2O and low values of P . For SNR = 15 dB and SNR = 10 dB, TE2O≥ 0.25 provided full sensitivity at P ≤ 95%, whereas TE2O≥ 0.4 was needed for SNR = 5 dB. In the range 0.4≤ TE2O≤ 0.5, the value of P is by no means critical, because for P ≤ 95% sensitivity and PPV are independent of P .
2) Test on Dataset 1: The algorithm was then tested on Dataset 1. With the reference noise level (σN = 1 mV), the statistics of the event SNRs turned out to be SNR = 15.6± 3.4 dB for the 5.49 µm beads and SNR = 24.5± 3.0 dB for the 7.18 µm beads. As a matter of fact, the method gives a good SNR, because the energy in the excitation signal is concentrated at discrete frequencies and the lock-in amplifier rejects all other noise sources [2]. However, in order to simulate worse conditions, the standard deviation of the noise was amplified by a factor 2× or 3×, thus decreasing the mean SNR value by 6 dB or 9.5 dB, respectively.
According to the results of the preliminary investigation, a centile percentage of 90% along with an E2O threshold of 0.4 were selected. Table II reports sensitivity and positive predictive value, for the three considered noise levels. The values obtained by purging out the coincidences from the data, denoted by S∗ and PPV∗, are also reported for comparison.
3) Test on Dataset 2: Finally, the algorithm was tested on Dataset 2. With the reference noise level (σN = 1.7(1 + i) mV), the statistics of the event SNRs turned out to be SNR = 23.4± 4.6 dB for the RBCs and SNR = 23.2 ± 3.0 dB for the 6 µm beads. The standard deviation of the noise was amplified by a factor 3× and 5×, in order to simulate worse conditions.
As in the previous case, a centile percentage of 90% along with an E2O threshold of 0.4 were selected. Table II reports sensitivity and positive predictive value, for the three noise levels, along with the values obtained after purging out the coincidences.
C. Discussion
Impedance cytometry is emerging as a powerful and ef-fective tool for single-cell analysis. A great effort is presently
0.6 SNR = 5 dB 0.4 90 95 0.5 1 0 (a) S PPV TE 2O P [%] 0.6 SNR = 10 dB 0.4 90 95 0.5 1 0 (b) S PPV TE 2O P [%] 0.6 SNR = 15 dB 0.4 90 95 0.5 1 0 (c) S PPV TE 2O P [%]
Fig. 9. Sensitivity (S) and Positive Predictive Value (PPV) as a function of algorithm parameters (centile percentage, P , and E2O index threshold, TE2O),
for different noise levels (SNR = 5, 10, 15).
being devoted to the identification of the most sensitive designs and technologies. However, along with hardware enhancement, software enhancement is required. There is the need for robust yet simple signal processing methods, able to effec-tively extract high-content information from measured data. In particular, the first processing step, pivotal to the following ones, is the event detection.
The original event-detection algorithm proposed in this work enjoys a number of valuable features. First of all, the algorithm is not strictly dependent on an event profile-shape, which in turn depends on factors like chip configuration, or cell off-centering and shape [30], [3]. Instead, event odd-symmetry is exploited, which is the common feature among different chips/cells, as long as a differential measurement scheme is adopted. Few parameters are involved in the algorithm, whose setting is non-critical. Preliminary denoising is not required. Algorithm implementation is quite simple and computational complexity is limited. As an example, the analysis of Dataset 1 required about 50” for each noise level, with a non-optimized Matlab code running on a Intel Core i7-4930K [email protected] processor with 16 GB RAM.
The performance analysis of the algorithm showed very good sensitivity and positive predictive value. The latter metrics can be further improved by limiting the number of event coincidences, e.g. optimising the process parameters (cell concentration, flow rate, sensing volume) or by using hy-drodynamic or inertial focusing [33], [34]. On the other hand, ad hoc coincidence-detection and feature-extraction algorithms could also be pursued.
To the best of Authors’ knowledge, for the first time in digital signal processing of impedance cytometry data a rigorous performance analysis has been presented, and two synthetic datasets, accurately mimicking experimental data, have been provided. One feature of experimental data which is not accounted for in the synthetic data is the correlation between cell off-centering and cell amplitude/shape, which, however, should have no impact on the algorithm performance. Absolute measurement schemes, instead of differential ones, are sometimes adopted in microfluidic impedance cytometry
(e.g., [8]), generally yielding even-symmetric event patterns. The proposed algorithm may be adapted to those situations by replacing the odd-symmetric template h with a rectangular window, and exchanging the role of the even and odd parts in the quality check procedure.
The present version of the algorithm uses only one fre-quency channel. In case more than one channel is available, inter-channel correlations could be exploited.
The algorithm can be also source of inspiration for other fields, where odd-symmetric (or even-symmetric) event pat-terns can be expected.
IV. CONCLUSIONS
A simple and robust event-detection algorithm suited to impedance cytometry data has been presented. The algorithm profitably exploits the odd-symmetric feature of the measured profile, arising from a differential measurement scheme. Very good overall performances are achieved (94.9% sensitivity and 98.5% PPV). Further work will be devoted to coincidence detection strategies.
ACKNOWLEDGMENT
The authors would like to thank Prof. Hywel Morgan, Dr. Daniel Spencer and Dr. Greg Elliott for providing impedance cytometry data.
REFERENCES
[1] K. C. Cheung et al., “Microfluidic impedance-based flow cytometry,” Cytometry Part A, vol. 77, no. 7, pp. 648–66, 2010.
[2] T. Sun et al., “Digital signal processing methods for impedance mi-crofluidic cytometry,” Microfluid. Nanofluid., vol. 6, pp. 179–187, 2009. [3] “Final publishable summary,” FP7 DIMID project, GA 286692, http://cordis.europa.eu/docs/results/286692/final1-4-1-final-publishable-summary-report.pdf, 2013.
[4] D. Spencer et al., “Microfluidic impedance cytometry of tumour cells in blood,” Biomicrofluidics, vol. 8, 2014.
[5] C. H. Lin et al., “Vertical focusing device utilizing dielectrophoretic force and its application on microflow cytometer,” J. Microelectromech. Syst., vol. 13, no. 6, pp. 923–932, 2004.
[6] Choongho Yu et al., “A three-dimensional dielectrophoretic particle focusing channel for microcytometry applications,” J. Microelectromech. Syst., vol. 14, no. 3, pp. 480–487, 2005.
[7] G. Benazzi et al., “Discrimination and analysis of phytoplankton using a microfluidic cytometer,” IET Nanobiotechnol., vol. 1, no. 6, pp. 94–101, 2007.
[8] M. Shaker et al., “Impedance-based flow micro-cytometer for single cell morphology discrimination,” Lab Chip, vol. 14, no. 14, pp. 2548–55, 2014.
[9] K. Cheung et al., “Impedance spectroscopy flow cytometry: on-chip label-free cell differentiation,” Cytometry Part A, vol. 65A, no. 2, pp. 124–32, 2005.
[10] C. K¨uttel et al., “Label-free detection of babesia bovis infected red blood cells using impedance spectroscopy on a microfabricated flow cytometer,” Acta. Trop., vol. 102, no. 1, pp. 63–8, 2007.
[11] D. Holmes et al., “Leukocyte analysis and differentiation using high speed microfluidic single cell impedance cytometry,” Lab Chip, vol. 9, pp. 2881–2889, 2009.
[12] M. Evander et al., “Microfluidic impedance cytometer for platelet analysis,” Lab Chip, vol. 13, no. 4, pp. 722–9, 2013.
[13] L. S. Jang and M. H. Wang, “Microfluidic device for cell capture and impedance measurement,” Biomed. Microdevices, vol. 9, no. 5, pp. 737– 43, 2007.
[14] H. L. Gou et al., “Label-free electrical discrimination of cells at normal, apoptotic and necrotic status with a microfluidic device,” J. Chromatogr. A, vol. 1218, no. 33, pp. 5725–9, 2011.
[15] J. L. Hong et al., “Electrical characteristics analysis of various cancer cells using a microfluidic device based on single-cell impedance mea-surement,” Sens. Act. B Chem., vol. 173, pp. 927–34, 2012.
[16] H. Song et al., “A microfluidic impedance flow cytometer for identifi-cation of differentiation state of stem cells,” Lab Chip, vol. 13, no. 12, pp. 2300–10, 2013.
[17] F. Caselli et al., “EIT-inspired microfluidic cytometer for single-cell dielectric spectroscopy,” J. Microelectromech. Syst., vol. 19, no. 5, pp. 1029–40, 2010.
[18] D. Spencer et al., “A sheath-less combined optical and impedance micro-cytometer,” Lab Chip, vol. 14, no. 16, pp. 3064–3073, 2014. [19] Y. Chen et al., “Rare cell isolation and analysis in microfluidics,” Lab
Chip, vol. 14, no. 4, pp. 626–645, 2014.
[20] F. Caselli et al., “Modeling, simulation and performance evaluation of a novel microfluidic impedance cytometer for morphology-based cell discrimination,” J. Microelectromech. Syst., vol. 23, no. 4, pp. 785–794, 2014.
[21] P. S. Hamilton and W. J. Tompkins, “Quantitative investigation of QRS detection rules using the MIT/BIH arrhythmia database,” IEEE Trans Biomed Eng, vol. BME-33, no. 12, pp. 1157–1165, 1986.
[22] M. Astrom et al., “Wavelet-based event detection in implantable cardiac rhythm management devices,” IEEE Trans Biomed Eng, vol. 53, no. 3, pp. 478–484, 2006.
[23] R. Agarwal et al., “Detection of rapid-eye movements in sleep studies,” IEEE Trans Biomed Eng, vol. 52, no. 8, pp. 1390–1396, 2005. [24] S. Sprager and D. Zazula, “Heartbeat and respiration detection from
optical interferometric signals by using a multimethod approach,” IEEE Trans Biomed Eng, vol. 59, no. 10, pp. 2922–2929, 2012.
[25] D.-G. Jang et al., “A robust method for pulse peak determination in a digital volume pulse waveform with a wandering baseline,” IEEE Trans Biomed Circuits Syst, vol. 8, no. 5, pp. 729–737, 2014.
[26] Y. Zheng et al., “Electrical measurement of red blood cell deformability on a microfluidic device,” Lab Chip, vol. 13, no. 16, pp. 3275–83, 2013. [27] U. Hassan et al., “Flow metering characterization within an electrical cell counting microfluidic device,” Lab Chip, vol. 14, no. 8, pp. 1469–76, 2014.
[28] J. Guo et al., “Precise enumeration of circulating tumor cells using support vector machine algorithm on a microfluidic sensor,” IEEE Trans Emerg Topics Comput, 2014.
[29] K. Fujimoto, “Principles of measurement in hematology analyzers manufactured bySysmex corporation,” Sysmex J Int, vol. 9, no. 1, pp. 31–44, 1999.
[30] D. Spencer and H. Morgan, “Positional dependence of particles in microfludic impedance cytometry,” Lab Chip, vol. 11, no. 7, pp. 1234– 39, 2011.
[31] M. Spiga and G. L. Morini, “A symmetric solution for velocity profile in laminar flow through rectangular ducts,” Int Commun Heat Mass, vol. 21, no. 4, pp. 469–475, 1994.
[32] U. Hassan and R. Bashir, “Coincidence detection of heterogeneous cell populations from whole blood with coplanar electrodes in a microfluidic impedance cytometer,” Lab Chip, vol. 14, no. 22, pp. 4370–81, 2014. [33] G. Mernier et al., “Cell viability assessment by flow cytometry using
yeast as cell model,” Sens. Act. B Chem., vol. 154, no. 2, pp. 160–163, 2011.
[34] J. Oakey et al., “Particle focusing in staged inertial microfluidic devices for flow cytometry,” Anal. Chem., vol. 82, no. 9, pp. 3862–3867, 2010.
Federica Casellireceived the M.Sc. degree in med-ical engineering, the M.Sc. degree in mathematics, and the Ph.D. degree in structural engineering and geotechnics from the University of Rome “Tor Ver-gata”, in 2005, 2008, and 2013 respectively.
Since 2008, she has been a Researcher of Medical Engineering at the Department of Civil Engineering and Computer Science, University of Rome “Tor Vergata”. Her research interests include analysis and development of microdevices for biomedical use, computational biomechanics, and biomedical signal and image processing.
Paolo Bisegna received his M.Sc. degree in engi-neering from the University of Naples “Federico II”, in 1991, his M.Sc. degree in mathematics from the University of Rome “Tor Vergata”, in 1994, and his M.D. degree from the School of Medicine of the University of Rome “Tor Vergata”, in 2006.
He is a Professor of Mechanics at the Department of Civil Engineering and Computer Science, and Director of the Medical Engineering Program, Uni-versity of Rome “Tor Vergata”. His research interests include biomedical instrumentation, biomechanics, mechanics of materials and structures, computational mechanics.