“The use of mathematical models for the management of
operations in water distribution networks”
A thesis submitted in conformity with the requirements
for degree in “Civil Hydraulic Engineering”
“University of Pisa – Faculty of Engineering”
Index
Sommario
Abstract
1. General introduction………..……….…………..………...1
1.1 Scope of the project;
1.2 Justification of the project;
1.3 Resources required for the work;
1.4 Organization of the work.
2. Models in water distribution networks………..……….……....3
2.1 Introduction;
2.2 Uses and benefits of water distribution models;
2.3 Description and classification of the mathematical models in distribution networks;
2.4 Design of a network mathematical model;
2.5 Development of a hydraulic model for a network of water supply;
2.5.1 Collection of system data;
2.5.2 Simplification and skeletonization of the network;
2.5.3 Consumption analysis: estimation of the demand. Modulation of the demand;
2.5.4 Load of the model. Exportation of the model to hydraulic simulator;
2.5.5 Calibration of the model. Adjustment of the parameters;
2.6 Framework required for connection and management of hydraulic models;
2.7 Software for the simulation: EPANET 2.0;
2.7.1 Program features of EPANET;
2.7.2 Steps in using EPANET;
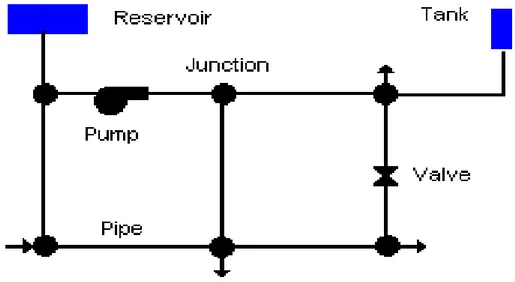
2.7.3 Physical components in water distribution systems;
2.7.4 Non-physical components: curves, time patterns and controls;
2.7.5 Hydraulic simulation model;
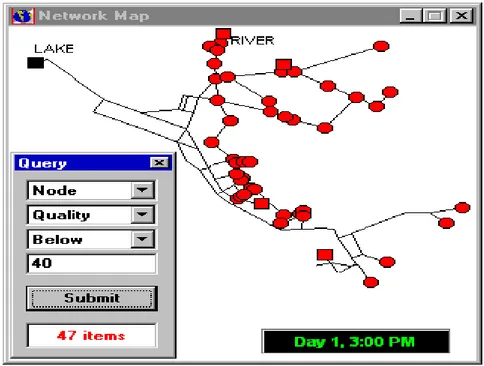
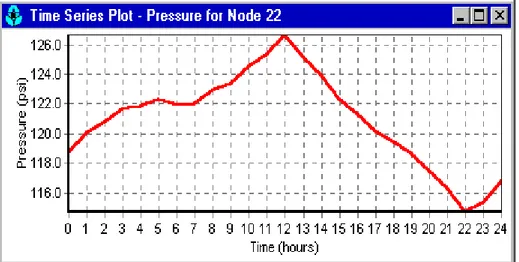
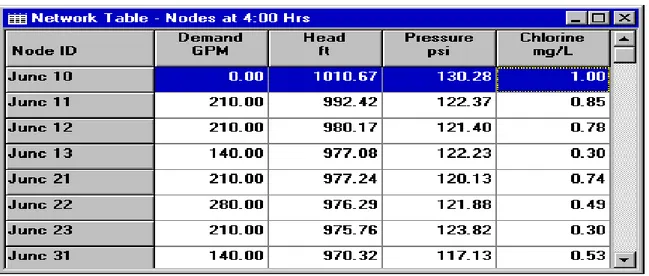
2.7.6 Viewing results: map, graph, table and special reports;
2.8 GIS (Geographic Information Systems);
2.8.1 GIS Basics;
2.8.2 GIS Application in this project: Modeling integration;
2.8.3 Water System Applications: GisRed;
2.8.4 Steps in using GisRed.
3. Integration of models in SCADA System……….………....…….33
3.1 Introduction;
3.2 What’s a SCADA System;
3.3 Program features of a SCADA System: targets, performance, and benefits;
3.4 Structure of a SCADA System;
3.5 Connections between computer tools;
4. Software for the management of the simulation: SCA-Red………....40
4.1 Abstract;
4.2 Main features of SCA-Red;
4.3 The SCA-Red interface;
4.4 Connecting SCA-Red with EPANET;
4.4.1 Imposing the field data;
4.4.2 Connecting with EPANET files;
4.4.3 The treatment of the field data;
4.5 Client-server architecture;
4.5.1 The server module;
4.5.2 The client module;
4.5.3 Hardware architecture;
4.5.4 Software architecture;
4.5.5 Conclusions.
5. The case study: Water supply system in Valencia………..…….….59
5.1 Introduction;
5.2 Description of network and its main characteristics;
5.2.1 The treatment plants;
5.2.2 The pumping groups;
5.2.3 The tanks;
5.2.4 The pipes network and the control valves;
5.3 Simplification of the network. Confection of the strategic model;
5.4 Analysis the study period. Selection of the charging period;
5.4.1 Modulation of the demand;
5.4.2 Charge of the model: setting the input values;
5.5 Simulation of real scenarios;
5.5.1 Topograhy of the area: representation the elevation of the network;
5.5.2 Representation of diameters, speeds and flows in pipes;
5.5.3 The treatment plant: levels in tanks and flows in pumps;
5.5.4 Pressure analysis;
5.5.5 Piezometric head and load loss;
5.5.6 System performance;
5.6 Modifying control rules: An emergency case study;
5.6.1 Simulation of break of the valve in “San Isidro”;
5.6.2 Consequence of break of the valve;
5.6.3 Solution to break of the valve;
5.7 Real-world applications of model to water supply system in Valencia;
6. Conclusions and future research………....…..110
6.1 General conclusions about the work;
6.2 Usefulness of the project: optimization of network through the use of model;
6.3 Future development: optimal resource management and leak detection in detailed model.
Tesi di Laurea Specialistica in “Ingegneria Idraulica, dei Trasporti e del Territorio”
“L’ USO DEI MODELLI MATEMATICI PER LA GESTIONE DELLE
OPERAZIONI NELLE RETI DI DISTRIBUZIONE”
SOMMARIO
L'acqua è sempre stata un elemento essenziale del territorio e del sistema ambientale ed è una risorsa insostituibile per lo sviluppo di varie attività umane e il miglioramento della qualità della vita. Tra i vari usi delle acque, quello destinato al consumo umano, è sicuramente di vitale importanza, come testimoniano i notevoli sforzi compiuti dagli uomini delle più antiche culture nella realizzazione di opere (acquedotti) finalizzate al trasporto e alla distribuzione di acqua potabile.
Gli acquedotti costituiscono quindi una delle più importanti questioni di ingegneria idraulica, che ha attirato sempre più l'attenzione di ricercatori e ingegneri, a causa della quantità di acqua via via più richiesta dall'uomo per soddisfare le sue esigenze e delle conseguenti difficoltà a reperire nuove risorse idriche, per garantire l'acqua di caratteristiche adeguate. Il problema è stato aggravato dal fatto che la mancanza d'acqua per uso potabile, soprattutto negli ultimi decenni, è aumentata a causa del deterioramento della qualità delle risorse, dovuta proprio a quei fattori che hanno dato origine alla richiesta di acqua sempre più elevata (miglioramento dello standard di vita, crescita della popolazione, e sviluppo delle attività umane). E’ quindi chiaro che l'acqua di buona qualità è un bene limitato, per questo motivo dobbiamo farne un uso razionale, cercando di contenere le perdite, e adottando misure e azioni necessarie per la tutela delle risorse idriche dall'inquinamento con lo scopo di salvaguardare un bene cosi prezioso. L’acqua potabile, dunque, è stata inserita in numerosi progetti di sensibilizzazione e protezione, che hanno evidenziato la necessità di una tutela sempre più omogenea e globale espressasi prima a livello nazionale e in seguito anche a livello comunitario: una serie di disposizioni legislative hanno imposto una conduzione oculata ed igienicamente controllata della distribuzione acquedottistica.
La tradizionale politica di gestione pubblica che si è concentrata sulla necessità di garantire una qualità di servizio minimo, indipendentemente dai costi connessi con i processi di captazione, trattamento e distribuzione di acqua, in molti casi, anche sconosciuti, si è evoluta verso modelli più efficienti con costi sensibili. Questi nuovi modelli interamente o parzialmente finanziati dai sistemi di gestione pubblica non solo migliorano la qualità del servizio offerto agli utenti, ma soprattutto ottimizzano le risorse, riducendo i costi e causando il minimo impatto ambientale. In aggiunta la nuova sfida sollevata dalla Direttiva Europea quadro sulle acque (2000/60/CE), che impone il recupero dei costi per migliorare l'efficienza idrica e la sostenibilità ambientale, ha portato a un significativo cambiamento a tutti i livelli della gestione idrica. Di conseguenza, nuove priorità sono state stabilite in termini di gestione delle infrastrutture che richiedono la riduzione delle perdite idriche e il miglioramento dell'efficienza dell'acqua nelle reti urbane per il consumo umano.
Il presente progetto, valido come prova finale del Corso di Laurea Specialistica in Idraulica, dei Trasporti e del Territorio, è stato sviluppato a seguito di un periodo di stage all’estero nel Dipartimento di Reti Idrauliche in Pressione presso l’Università Politecnica di Valencia.
Il progetto viene articolato in 6 capitoli distinti:
1. Introduzione generale sul progetto: scopo, motivazioni e descrizione strutturale;
2. Uso dei modelli idraulici nelle reti di distribuzione d’acqua in pressione: vengono introdotti i modelli matematici, esponendo la loro utilità e i vantaggi che se ne traggono dal suo utilizzo. In seguito sono analizzati gli strumenti e le informazioni necessarie al confezionamento del modello e l’applicazione per la simulazione: GIS ed EPANET;
3. Strumenti e informazioni necessarie a integrare il modello: l’applicazione SCADA come sistema di supervisione, monitoraggio, allarme e comando degli organi di regolazione e immagazzinamento dati;
4. Applicazione del sistema SCADA alla rete di distribuzione: SCA-Red, il software per la gestione della simulazione. Successivamente viene utilizzata l’applicazione che permette di analizzare i dati storici della base dati di SCADA relativi all anno 2012, per ricercare lo stato di carica del modello;
5. Applicazione del modello alla rete di Valencia e simulazione di una situazione d’emergenza: descrizione della rete di Valencia e rappresentazione del modello strategico; simulazione di uno scenario passato e disamina della rete attraverso le principali variabili idrauliche; simulazione di una probabile situazione d’emergenza. A conclusione del capitolo vengono elencati tutti i tipici scenari in cui il modello viene utilizzato dall’impresa direttrice Aguas
de Valencia S.A., fungendo da strumento di supporto per prendere le decisioni per la
gestione delle operazioni.
6. Conclusioni e sviluppi futuri: utilità del progetto e campi d’investigazione futura.
Le principali motivazioni che ci hanno spinto a tutelare un bene di primaria necessità come l’acqua, le possiamo sintetizzare in alcuni punti chiave:
• Problematica della gestione: aumento dei costi di captazione, trattamento e distribuzione;
aumento della domanda e diminuzione delle risorse;
• Obiettivi delle imprese: ottimizzare le risorse e ridurre i costi di gestione;
• Direttiva Europea (2000/60/CE): migliorare l’efficienza idrica e la sostenibilità ambientale.
Per salvaguardare un bene cosi prezioso, nell’ultimo decennio, le imprese direttrici si sono preoccupate di cambiare strategia di gestione passando da un’amministrazione tradizionale che si poneva l obiettivo di soddisfare la domanda, a una nuova strategia di conduzione che si pone i seguenti obiettivi:
Migliorare la qualità del servizio agli utenti;
Minimizzare le perdite;
Con lo scopo di raggiungere tali obiettivi, si propone di affrontare gli attuali problemi di gestione delle reti idriche urbane, utilizzando nuove tecnologie di elaborazione delle informazioni con tecniche di modellazione di rete innovative che permettono l’ottenimento di strumenti di supporto per facilitare la diagnosi del sistema, e per poter successivamente gestire al meglio tutte quelle operazioni necessarie al mantenimento della rete idrica urbana.
Uso dei modelli idraulici nelle reti di distribuzione d’acqua in pressione
Nell’ultimo decennio, grazie alle nuove tecniche di modellazione delle reti si è riuscito a capire le potenzialità che può offrire un modello matematico, la miriade di campi in cui riesce a trovare applicazione e i vantaggi che si possono trarre da uno strumento del genere. In maniera sintetica proviamo a rispondere a 3 domande fondamentali per comprendere il concetto di modello matematico esaminando il nostro campo di applicazione, ovvero la rete di distribuzione d’acqua in pressione:
1. Che cos’è un modello matematico?
2. A cosa serve un modello matematico?
3. I vantaggi di un modello idraulico in una rete di distribuzione?
Un modello matematico è un modello costruito usando il linguaggio e gli strumenti della matematica. Un modello di un sistema esprime la conoscenza di un fenomeno e come tale consente di rispondere a domande sul sistema senza la necessità di compiere un esperimento. Esso costituisce quindi un potente mezzo di previsione e descrizione del comportamento di un sistema. Tutti i settori della scienza, ma non solo, fanno largo uso di modelli matematici per modellizzare determinati aspetti del mondo.
Come tutti gli altri modelli usati nella scienza, il suo scopo è quello di rappresentare il più incisivamente possibile un determinato oggetto, un fenomeno reale o un insieme di fenomeni (sistema fisico). Un modello matematico è spesso costruito con lo scopo di fornire previsioni sullo 'stato' futuro di un fenomeno o di un sistema. Generalmente, il modello descrive la probabile evoluzione di un fenomeno o di un sistema sulla base di dati iniziali (condizioni iniziali) forniti dall'utente (l'input) restituendo dei dati finali (output). L'efficacia del modello può essere quindi misurata comparando i dati finali con il risultato effettivo osservato dell'evoluzione del fenomeno o del sistema.
I modelli idraulici sono utilizzati nelle reti di distribuzione per pianificare, progettare e gestire i servizi idrici necessari per servire gli utenti aggiuntivi e mantenere i servizi esistenti negli anni futuri. Durante il funzionamento di una rete di distribuzione si presenteranno delle situazioni problematiche che si potranno risolvere nella maniera più adeguata possibile attraverso l’utilizzo di un modello idraulico: in caso di eventuali guasti o rotture in punti strategici della rete, sarà possibile valutare l’entità del danno e adottare le necessarie precauzioni.
Strumenti e informazioni necessari al confezionamento del modello
Descritta l’utilità di un modello idraulico, come passo successivo si esamina il problema di confezionamento di un modello che rappresenti la rete acquedottistica di Valencia. Vista la complessità di una rete idraulica che fornisce una popolazione di circa 1,5 milioni di abitanti, appare evidente il fatto di avere a che fare con un grande volume di informazioni cartografiche che sono gestite dal sistema di informazione territoriale GIS che permette l’acquisizione, la registrazione, la visualizzazione e la restituzione di informazioni derivanti da dati georeferenziati.
Tale applicazione permette, infatti, di gestire al meglio e nel modo più funzionale possibile:
• Utenti;
• Letture dei contatori; • Dati di telemetria;
• Domanda della portata per ciascun nodo della rete.
Inoltre grazie alla personalizzazione di GIS si è riuscito a sviluppare uno strumento specifico chiamato GISRED per facilitare la confezione dei modelli, la calibrazione e il mantenimento degli stessi, e adottare il modello dei dati al simulatore EPANET.
Per la simulazione di reti di condotte in pressione si è utilizzato il software più conosciuto a livello mondiale: EPANET. Grazie ad esso, siamo riusciti a simulare in un periodo esteso il comportamento idraulico della rete tracciando il flusso dell’acqua in ogni tubazione, la pressione a ogni nodo e il livello in ogni serbatoio. I risultati ottenuti sono mostrati attraverso grafici, e rappresentazioni con mappe delle isolinee per riprodurre con una sola immagine il comportamento dell’intera rete.
L’integrazione del modello con i dati reali, invece, avviene con il software SCADA. Questa applicazione permette il monitoraggio in tempo reale dei sistemi di distribuzione d’acqua, con lo scopo di utilizzare il modello idraulico al fine di aiutare gli operatori della rete nella gestione delle operazioni di manovra. Si tratta di uno strumento indispensabile per gli operatori della rete in quanto permette loro di:
Valutare le azioni riguardanti la situazione attuale in modo tale da anticipare il comportamento della rete nelle prossime ore;
Ottimizzare la rete in tempo reale, ridurre le perdite, minimizzare il consumo energetico e controllare la qualità dell’acqua;
Pianificare le operazioni di mantenimento e gestire le manovre in situazioni d’emergenza;
Esportare il modelo idraulico adattato alle condizioni reali al software di simulazione Epanet. A seguito di una descrizione delle applicazioni e informazioni necessarie alla costruzione di un modello si è passati a esaminare il caso di studio della rete di Valencia: simulando un periodo passato per la riproduzione di risultati simulati per esaminare il comportamento della rete nelle condizioni più sfavorevoli possibili con lo scopo di migliorare la qualità del servizio all’utente, migliorare la capacità di risposta sotto condizioni anomale di funzionamento (simulazione di una situazione d’emergenza), ridurre i costi di operazione con un ottimizzazione del consumo energetico.
Caso di studio: Applicazione del modello alla rete di distribuzione di Valencia
La città di Valencia si trova sulla costa orientale della Spagna, zona densamente popolata da circa 1,5 milioni di persone, distribuite in circa 44 Comuni. La rete che alimenta la città di Valencia è stata costruita nei primi anni del 1900. La prima fonte di acqua potabile è stata l'impianto di trattamento di " La Presa ", che attinge l'acqua dal fiume "Turia".Attualmente, la rete include un sistema di distribuzione più grande che comprende tutte le reti dei 44 comuni menzionati. L’intera rete è chiamata Sistema Basico Metropolitano (SBM), e uno dei suoi scopi principali è stato quello di rendere possibile la fornitura di tutte le popolazioni con l'acqua di superficie. In questo modo, durante gli anni '80, l'aumento del consumo di acqua, l'aumento di nitrati delle acque sotterranee, e la necessità di garantire l'approvvigionamento per la città e la sua area metropolitana, ha costretto l’autorità a progettare un’altra pianta "Picassent", che riceve l'acqua dal fiume "Jucar" per mezzo di un canale di trasferimento, contribuendo così ad
aumentare le fonti alternative per il sistema globale. Come conseguenza, l'intera area metropolitana è attualmente alimentata con acqua di superficie.
Analisi dati storici anno 2012 e Carica del modello
Per ricercare il periodo di carica del modello, cioè quel periodo che rappresentasse la situazione di massimo consumo, ci siamo serviti dei dati immagazzinati da SCADA nella base dati attraverso un’applicazione elaborata dall’impresa che gestisce la rete di distribuzione. Analizzando il consumo giornaliero dell’intero anno 2012, risulta che Giugno è il mese con il consumo più alto. Successivamente è stato esaminato tale mese dal punto di vista qualitativo, poichè non tutti i segnali trasmessi sono accettabili, in quanto, per mancanza di tensione o per errori di comunicazione, non si hanno a disposizione tutti i dati. Inoltre, alcuni di essi assumono valori anomali a causa di “rumori magnetici” ambientali. A seguito di queste analisi è stato scelto come giorno rappresentativo dell’anno il 27: giorno in cui i valori sono prossimi alla realtà nel periodo dell anno in cui si verifica il consumo più elevato.
Simulazione di un periodo passato per la riproduzione di scenari
Scelto lo stato di carica, abbiamo caricato il modello con i dati importati da SCADA ed esportato al simulatore EPANET. Dalle simulazioni abbiamo tirato fuori alcune mappe che rappresentavano la rete, riportando:
∗ quote del terreno di tutti i punti della rete a partire dai serbatoi fino ai punti di sumministro
più estremi;
∗ le tubazioni sono state rappresentate riportando: diametri, velocità e portate nell’ora di
massimo consumo;
∗ i livelli dei serbatoi e lo stato di avvio/arresto delle pompe;
∗ dal punto di vista qualitativo abbiamo analizzato la pressione verificando che soddisfacesse i
valori minimi nell’ora di massimo consumo e i valori massimi nell’ora di minimo consumo in tutti i punti della rete;
∗ l’altezza piezometrica per valutare le perdite di carico nelle tubazioni; ∗ il rendimento globale della rete tenendo conto di tutti i settori parziali.
Simulazione di una situazione d’emergenza
Dall’analisi della rete attraverso lo scenario passato appena descritto, si è individuato un punto critico che presenta valori limiti per quanto riguarda la pressione massima nell’ora di massimo consumo; poichè in tale tratto è presente una valvola riduttrice di pressione si è pensato a una probabile rottura della valvola. La rottura è stata simulata con la chiusura totale della valvola. In seguito si è provati a trovare una soluzione al problema mettendoci nei panni dell’operatore che gestisce le operazioni di manovra, andando ad eseguire tempestivamente tutte le manovre necessarie per ripristinare il servizio.
Scenari tipici di utilizzo del modello idraulico
Aguas de Valencia S.A., l’impresa privata che gestisce la rete di distribuzione, utilizza il
modello quotidianamente in una delle seguenti situazioni:
Conoscere le variabili idrauliche (pressione, portate, livelli) in tutti i punti della rete, anche in quelli dove non sono installati dispositivi telemetrici;
Pianificare la manutenzione, andando a determinare in quali giorni conviene apportare modifiche alla rete;
Progettare la rete in caso di espansione dovuta a una crescita della popolazione o a uno sviluppo industriale;
Durante le situazioni di emergenza, per facilitare la localizzazione del danno e per prevedere come la rete reagirà nelle ore seguenti;
Gestire la rete attraverso la settorizzazione della stessa per calcolare bilanci idrici di ciascun settore e per valutare successivamente l’efficienza di tutto il sistema.
Conclusioni e sviluppi futuri
L'elaborazione di questo lavoro, a partire dalla tutela delle risorse idriche (acqua intesa come elemento essenziale del territorio e del sistema ambientale nonchè risorsa insostituibile per lo sviluppo di varie attività umane e il miglioramento della qualità della vita ) per terminare con l obiettivo fondamentale della presente tesi: la necessità dei modelli matematici per la gestione delle operazioni nelle reti di distribuzione dell'acqua; il modello rappresenta, oggi, uno strumento di estrema importanza per l'intera umanità. D'altra parte, l'uso di strumenti quali SCADA, GIS, EPANET, ci rendono ancora più abili nel riuscire a controllare le grandi reti di aree metropolitane.
Aguas de Valencia S.A., a partire dal 1993, in collaborazione con l' Università Politecnica di
Valencia, si è dedicate all’elaborazione del primo modello statico della rete arteriale della città, e dopo quasi 20 anni di ricerca e sviluppo è riuscita a costruire un modello idraulico, di cui ancora oggi non possono farne a meno.
L’utilità del modello si racchiude essenzialmente sotto 3 aspetti che, in generale, coincidono con gli obiettivi principali dell’impresa che ha il compito di soddisfare le esigenze degli utenti, ottimizzando i costi che permettono di garantire il servizio:
1. Migliorare la qualità del servizio all'utente;
2. Migliorare la capacità di risposta in condizioni di funzionamento anomalo;
3. Ridurre il costo di funzionamento attraverso l’ottimizzazione del consumo energetico.
Gli sviluppi futuri relativi alla gestione ottimale della rete, sono orientati in una prima fase verso l'analisi dei vari fattori che giustificano il consumo incontrollato come le connessioni illegali. Un'altra area di sviluppo futuro è mirata sul sistema di gestione dell'energia e l'ottimizzazione del consumo energetico delle fonti di approvvigionamento. La minimizzazione del consumo di energia in stazioni di pompaggio è un classico problema. Tuttavia, la gestione energetica prende in considerazione molti altri fattori quali la gestione dell'acqua destinata ai serbatoi in funzione del grado di riempimento, la regolazione delle valvole di controllo della pressione, l'impostazione del valore di pressione, la perdita per attrito nei tubi, la perdita di energia associata a perdite, ecc…
Thesis for degree in “Civil Hydraulic Engineering”
“THE USE OF MATHEMATICAL MODELS FOR THE MANAGEMENT OF
OPERATIONS IN WATER DISTRIBUTION NETWORKS”
ABSTRACT
Water has always been an essential element of the territory and of the environmental system and is an irreplaceable asset for the development of various human activities and the improvement of quality of life.
Among the various uses of water, the one intended for human consumption is certainly of vital importance, as evidenced by the considerable efforts made by the men of the most ancient cultures in creating works aimed at the transport and distribution of potable water, even very complex, works of which few examples remain today (like Roman aqueducts).
The aqueducts therefore constitute one of the most important issues of hydraulic engineering, which has attracted more and more attention of researchers and engineers, due to the gradually increased amount of water required by humans to meet their needs and the consequent difficulties in finding new water resources, to ensure water of appropriate characteristics. The problem was exacerbated by the fact that water shortages for potable use, especially in the last decades, have been intensified due to the deterioration in the quality of resources, as a consequence of an augmented water demand (improvement of living standards, population growth, and development of human activities).
It is thus evident that good quality water is a limited asset, therefore, we have to do a rational use, with containment of leaks and waste, and the adoption of measures and actions needed for the protection of water resources from pollution.
The traditional public management policy that focused on ensuring a minimum quality of service regardless of the costs associated with the processes of catchment, treatment and distribution of water, in many cases even unknown, have evolved towards more efficient cost sensitive models. These new wholly or partly public funded management systems will not only improve the quality of service offered to users, but will also optimize resources by reducing the cost and causing a minimum environmental impact.
The new challenges raised by the European Water Framework Directive1 by imposing cost recovery to improve water efficiency and environmental sustainability have led to a significant change at all levels of water management. Consequently, new priorities have been established in terms of infrastructure management that require the reduction of water losses and the improvement of the water efficiency in urban networks for human consumption.
This thesis aims to address the current problems of managing urban water networks by combining new information-processing-technologies with innovative network modelling techniques. It intends to facilitate the system diagnosis and extend the use of models on the decision-making process to provide better solutions to the management of urban water networks.
1Directive (2000/60/CE) of the European Parliament, 23 October 2000, which establishes a European framework for
The use of mathematical models for the management of operations in water distribution networks
Chapter 1: General introduction
1.1 Scope of the project
Advances in information technology in the past two decades have seen innovations in the field of domestic and industrial computing that have led a paradigm shift in the management and operation of urban water systems by water utility companies.
A preliminary step for improving a system of water supply is to make an accurate diagnosis of the same. This is done for two main reasons: first, this is one of the requirements to improve the management and the second it allows the planning actions in the same direction. Indeed, the preparation of a mathematical model is one of the actions that contribute to this end.
The goal of this work is the elaboration of a strategic model that represents the water distribution network in the city of Valencia. This strategic model will allow us to represent a real scenario and a probable case of emergency in order to know where and how we have to operate for maintaining the network within the limits set and trying to ensure an adequate service to all users.
We must also keep in mind that this model may be the object of study and of great help to determine the behavior of the network in case of extension of the same network for future questions and then for the planning of new users, that will support this consumption.
1.2 Justification of the project
The evolution undergone in recent years in the use of mathematical modeling as a tool to support improved understanding and optimization of the exploitation of hydraulic systems has been and continues to be fast and very positive. The main advantages gained in using the information acquired during the process of modeling are indisputable. The experience gained in the past decade has demonstrated that the elaboration and application of models is valuable. These are becoming tools for support in relation to decision-making in a supply. The mathematical model is useful in the previous stage of search and selection of possible solutions, but also in monitoring and verification of its effectiveness upon deciding the application of one of them. A mathematical model is useful also for the planning of rehabilitation activities, for maintenance and restoration, for the simulation of emergency case and restrictions and then for planning improvements in safety and reliability. Furthermore, the mathematical model has additional applications in the activities of design and system expansion project, installation of new elements of regulation, in studies of sectorization, in locating water lost and leaks and in the preparation of water quality models.
Also, it is noticeable that the elaboration of the model involves the collection of a large amount of information, which is a real properly structured and very useful database of hydraulic system characteristics, information that can be used and onward to be consulted at the disposal of the company.
Chapter 1 General introduction
2
1.3 Resources required for the work
In this work were used the following software tools:
GisRed as a tool for collecting of data connected with geographical position;
Sca-Red to simulate operation maneuvers that might be critical for the normal performance of the network;
Data analysis Sca-Red to analyze historical data to be stored from SCADA capture;
EPANET as simulation software for hydraulic scenarios.
1.4 Organization of the work
The work has been organized into 6 chapters, the aim and content of each of the chapters is as follows:
Chapter 1 introduces, in general terms, the contents of this project and the reasons that led me to deal with this subject; the various tools used during the study;
Chapter 2 deals the mathematical models: how are distinguished, how they develop and the programs that we use for their packaging;
Chapter 3 describes SCADA software, its fields of application focusing on the use made in this project;
Chapter 4 analyzes the application of SCADA software to the distribution network, or rather: SCA-Red, how it is structured and how is the connection between the model, the client and the real network;
Chapter 5 discusses the aqueduct of Valencia as a case study of this project, the development and use of strategic model for a real scenario and for an emergency case;
Chapter 6 summarizes the results of the case study focusing on the current utility of the hydraulic models and how they can make much more efficient a water distribution system.
The use of mathematical models for the management of operations in water distribution networks
Chapter 2: Models in water distribution networks
2.1 Introduction
The groundwork for computer modeling of distribution systems was laid by the numerical method developed by Hardy Cross in the 1930s for analyzing looped pipe networks. The first mainframe programs for pipe-networks analysis were based on this method (Adams, 1961), but these were soon replaced with codes that used the more powerful Newton-Raphson method for solving the nonlinear equations of pipe flow. Therefore pipe network flow analysis was among the first civil engineering applications programmed for solution on the early commercial mainframe computers in the 1960s. Since that time, advancements in analytical techniques and computing power have enabled us to solve systems with tens of thousands of pipes in seconds using desktop personal computers. Over the years, step by step, modern-day computers models are used to analyze the hydraulic and water-quality behaviour of distribution systems.
The classical pipe-network flow problem asks what are the flows and pressures are in a network of pipes subject to a known set of inflows and outflows. Two sets of equations are needed to solve this problem. The first set requires conservation of flow to be satisfied at each pipe junction; the second specifies a nonlinear relation between flow and headloss in each pipe, such as the Hazen-Williams or Darcy-Weisbach equation. Whenever a network contains loops or more than one fixed-head source, these equations form a coupled set of nonlinear equations. Such equations can be solved only by using iterative methods, which for all but the smallest-sized problems require the aid of a computer. Because most distribution systems of interest are looped, computer models have become a necessity for analyzing their behaviour.
2.2
Uses and benefits of water distribution models
Water distribution systems models are used in planning, engineering, operations, and management of water utilities. Some examples include the following:
Network models are run to analyze what capital improvements will be needed to serve additional customers and maintain existing services in future years. They also can help a utility prepare for planned outages of specific system components, such as tanks and pump stations;
Establishment of operation plans in case of possible faults or ruptures in strategic points of the network, previously simulated with the model. In this way, the system’s most vulnerable simulations can be detected, and the necessary precautions taken;
Network models are used to locate and size specific network components, such as new mains, storage tanks, pumping stations, and regulator valves;
Pump scheduling, tank turnover analysis, energy optimization, and operator training are some ways in which network models can be used to improve system operations;
Extensions to hydraulic models allow them to analyze a host of questions related to water quality. They can determine how water from different sources blends together throughout a system, how operational changes can reduce the time that water spends in the system, and what steps can be taken to maintain adequate disinfectant residuals without excessive levels of disinfection by-product formation throughout the system;
Fire-flows studies are used to determine if adequate flow and pressure are available for fire-fighting purposes, as required for fire insurance ratings;
Chapter 2 Models in water distribution networks
4
Vulnerability studies are used to test a system’s susceptibility to unforeseen occurrences, such as loss of power, major main breaks, extended drought periods, and intrusion of waterborne contamination.
Summing up, typical scenarios where we can find network models are:
∗ Pressure reduction schemes; ∗ Pressure enhancement schemes; ∗ Emergency planning;
∗ Maintenance planning; ∗ DMA planning;
∗ Mains rehabilitation;
∗ News developments / additional demand.
Many benefits are gained from model building as well as model use. The construction and validation process involves the collection and analysis of a vast amount of data. Much will be learnt about the distribution system during this time and it provides an ideal opportunity to scrutinise and review the quality and accuracy of information available. This procedure itself may lead to changes in record systems and improved performances. Other more tangible benefits occur from monitoring the performance of devices and the identification of system deficiencies. Pump performance will be measured; major meters will be checked; and unknown closed valves may be discovered during field tests. The greater the effort employed in the data logging exercise the greater the return. A proportion of the irregularities found will be of little significance; the odd unknown closed valve in the distribution network is not unusual or often important in terms of system performance. However, there are many occasions when data logging reveals anomalies which, if not resolved, could lead to unnecessary capital expense or poor levels of service when changes are made.
Network models were often designed and constructed for a particular purpose, usually to arrive at an investment decision and/or solve an operational problem. The completed model not only served as a design tool for the engineer but also remained available for future problem solving. The value of this “by-product” relied upon the scope of the original model. Such models were often simplified and restricted in their area of coverage, and so limited subsequent use.
However, we must accept that even these detailed models will have limitations. They will not contain every aspect of the real system. Non-specialist users must take care to understand the information, which the model will present to them: results can only be provided within the framework of the original system data.
2.3 Description and classification of the mathematical models
in distribution networks
The mathematical model of a network is the set of equations of hydraulic character and boundary conditions to simulate the different ways it can behave the distribution network without having physically experience. From the result of these simulations are then extracted consequences to be used in planning and network management.
The objective of any mathematical model is played back through a computer, as accurately as possible, the actual behaviour of the physical system it represents.
Hydraulic models can be classified, according to the mathematical approximation, in:
The use of mathematical models for the management of operations in water distribution networks
• Dynamic models that simulate the behaviour of the network analyzing an extended period.
According to the application of the model, these are classified as:
∗ Planning models: they are used to evaluate the performance and impacts of different
economic or quantitative pipe alternatives, changes in operational procedures or the behaviour of various elements, such as control valves, tanks storage, etc..
∗ Operational models: they are used to predict the behaviour of the system in the short term
(hours, days) to adjust pressure or flow, change levels, train operators, etc.. The aim is to assist in making decisions during system operation.
Depending on the degree of detail of the model, are distinguished in:
Strategic or arterial models: these models incorporate only the main components in terms of their size, role model or final destination. This type of model is suitable as an instrument of planning, design and protection of the fundamental elements of the network for control in real time, the optimal location selection and measurement and control devices, and generally for the design and optimization of the control system, or to study the management of operations in emergency situations;
Detailed models: To cover all the necessary requirements and take full advantage in aspects of project detail and for maintenance and regulation; in particular is necessary to use detailed models, which incorporate almost all the network elements, to reflect the behaviour of all elements of the system, especially for maintenance operations. Models are also required for the development of quality models.
According to the system variables, which are of interest, are classified as:
Hydraulic models: Hydraulic models determine the flow rates and pressures in the network under a certain initial and boundary conditions;
Quality models: they determine the temporal and spatial variation of a given water quality parameters such as the concentration of pollutants or disinfectants, the residence time of water in the network or the retention time in the tanks. Quality models require as a first step, the determination of the hydraulic variables of the system, through the use of a hydraulic model.
2.4 Design of a network mathematical model
Although in practice an analogue process is always followed for any network, it is important to point out that each one has its own peculiarities, which effect in a very significant way each one of these phases:
1. Compilation of the information;
2. Reduction of the network to a skeleton (obtaining a simplified model of the real network);
3. Analysis of the metered consumptions and their allocation to the nodes of the model;
4. Initial distribution of the “not registered” consumptions;
5. Measurements of the network’s parameters such as the pump’s characteristic curves, volume of storage tanks, the settings of the regulating valves, etc…
Chapter 2 Models in water distribution networks
6
After processing this information, we will obtain an Initial model of the system, whose validity will be checked in the following phase:
6. Verification of the initial model, which implies processing the model for different network conditions, and taking measurements of the hydraulic variables (pressure and flow rates) in the real system for the same situations;
The analysis of the differences, which will almost definitely be between the calculated values and the measured ones, can lead us to find errors in the initial data, for instance in the definition of the network topology by having found some closed valves or by errors made in the interpretation of the connection of pipes. Once the possible error sources in the initial model have been found and rectified, the last phase in the preparation of the model can begin:
7. Calibration of the initial model, from the in situ field measurements. During this phase, the most “uncertain” parameters of the model will be conveniently modified. Generally these are pipe roughness, diameter of some conduits (the diameter may have reduced) and the consumptions assigned to the nodes, due to the uncertainty as far as “unregistered consumption” goes, and according to the hourly fluctuations of the flow rates.
After having satisfactorily concluded the last phase we will have the network’s Definitive model, which should be periodically updated and recalibrated so that it does not lose functionality. The use of databases that collect all of the system’s information will be very useful, for the preparation of the model as well as for its later updating.
2.5 Development of a hydraulic model for a network of water
supply
The process of developing a hydraulic model involves gathering all the information existing network, and debug it to be assimilated by the existing analysis programs such as EPANET.
The modeling phases are:
2.5.1 Collection of system data
One of the main points for the preparation of a hydraulic model of a network in service, and this is the first phase of its elaboration, is to compile the greatest quantity possible of information on the network and its operation.
This is a case of familiarizing oneself with the system with the object of knowing the issues that are presented. Apart from using the archived data, it will also be most important to count on the experience of the personnel specialized in the Organization or Company in charge of the operation of the network.
The most important data’s that should be compiled are:
Topology: routes and connections of the pipes that make up the system, as well as location of the main valves. To avoid errors, it is advisable to use as much as detailed and up to date a plan as possible, with a scale between 1:500 and 1:5000;
Elevations: nodes and tank elevations, and especially places where pressure measurements are taken. It is advisable that the contour lines should not be at more than 1 m spacing for the levels to be of use. If the mapping were not reliable it could be convenient to traverse between all the pressure measurements points, following where possible the water’s direction flow;
The use of mathematical models for the management of operations in water distribution networks
Valves: location of the principal valves, diameter, type (regulating, reducing, sustaining, ect…), operation rules, material, state of conservation, etc…
Storage systems: location of the network’s tanks, as well as dimensions, base elevation, maximum and minimum levels, measurement and regulation devices, operation, etc…
Production installations and pumping stations: general description of the installations, regulation equipment and how it is operated, measurement devices, characteristic and efficiency curves of the pumps, aspiration levels, etc…
System input flows: as well as the accumulated values, it would be desirable to know the daily and seasonal evolution of the flows input from each of the inflow points, or at least an estimation of it based on the variation of the water levels in the storage tanks, hours that the pumps work, energy consumed, etc…
Consumptions in the network: the maximum information available about the user’s billed consumptions as well as estimations of public consumptions, leaks, meter errors, etc.. should be obtained. If possible the location and type of each consumer (domestic, industrial, etc..) should be detailed, indicating which pipe of the network is involved. It would also be desirable to obtain the demand modulation curves as a function of the time of day, day of the week, time of year and type of user, through a sample.
The rigorous determination of the starting data is going to be without doubt the most tedious task in the preparation of the model, and it will be a very important factor in the final model’s reliability. On the other hand, having a graphical interface for entering model data can be an immeasurable help.
2.5.2 Simplification and skeletonization of the network
Skeletonization consists essentially in the preparation of a simplified diagram of the network, which will be the topological base of the model. It should depict with sufficient precision the assembly of all the elements and connections.
The degree of simplification depends on the quantity and importance of the pipes that forms the real network, as it does the model’s goal: analysis, design, diagnosis, real time control, etc…
From a hydraulic point of view, when the fundamental use of the model is for analysis or design (prediction of the effect of a manoeuver or fault, planning an expansion or improvement, etc…), going into great detail is a waste of time, as it is not normally necessary to know the pressure at each node and connection of the network, being on the other hand insignificant the hydraulic contribution of the services and lesser pipelines to the behaviour of the arterial network. For this reason many small pipelines can be eliminated from the real network without losing any accuracy in the calculations, and gaining in exchange speed in the execution and comfort in the handling of the data.
Among the most widely used techniques for simplifying the real network enough for its use in applications of analysis and design, we should mention:
• Unification of close nodes; • Association of series pipes; • Association of parallel pipes;
• Elimination of the branches, substituting them by their consumption at the point of connection
with the network;
• Elimination of small diameter distribution pipes.
The unification of nodes contributes to the elimination of convergence problems, caused by short pipes of low resistance.
As for association of series and/or parallel pipes, the procedure to be followed consists in determining the equivalent length and diameter of the assembly. Evidently, the equivalent resultant
Chapter 2 Models in water distribution networks
8
diameters will not correspond to normalized sizes, but this should not be a problem as the meaning of the pipe is that of a fictitious pipe that substitutes various real ones and behaves in a way analogous to the assembly that it came from.
The elimination of small diameter pipes is conditioned by the desired level of detail and by their relative importance in the supply system. A definitive criterion cannot be given, but it is important to realize that pipes that contribute significantly to the carrying capacity of the systems should not be eliminated. The further away a pipe is from the inflow point, the less it contributes to transporting the flow to other areas, and thus its elimination will be more justified. Therefore, not only diameter, but also the location of a pipe in the system, as well as the amount of supplied users, will be deciding factors when the necessary simplifications are to be made.
When a conduit is left out of service as a result of a fault, the pipes in the surrounding area can go on to have strategic importance, this means that is necessary to take this fact into account when the real system is being simplified. In general, it is better to over estimate the carrying capacity of the system, and, if in doubt, to include the pipe. In this way, generally the pressures calculated by the initial model will be greater than those measured. This fact will have to be corrected in the adjustment process, increasing roughness, decreasing diameters or conveniently resituating the uncontrolled consumption floes. In this way, if the calculated pressures were to show continuously smaller values than those measured, this could mean that an excessive simplification of the real physical system has taken place, necessitating then an increase of the carrying capacity of the model.
Fig.2.1:Image of real network (Detailed Model from Epanet)
Skeletonization is fundamental in the process of preparation of a mathematical model of a network and generally is a very delicate operation; its automation is extremely difficult as many simplifications depend on the engineer’s judgement. In any case it is necessary to always have a
The use of mathematical models for the management of operations in water distribution networks
reliable database that contains information on the simplifications that have been made, relating the model’s links to elements of the real network. In the same way, this database should bring together information on how the consumption at nodes is determined, as a function of the simplifications made to the system.
Fig.2.2:Image of simplified network (Strategic Model from Epanet)
Once the simplified model has been obtained, the next step is to enumerate the elements that make up the skeleton. An enumeration is recommended that makes a fast identification possible of the node or pipe that is being dealt with.
2.5.3 Consumption analysis: estimation of the demand.
Modulation of the demand
In order to reproduce in an adequate fashion the working of a network through the use of its mathematical model, it is vital to know the flow required by each consumer or group of consumers for the situation that is to be analysed.
Generally consumption is simulated by outflows at the model’s nodes, so that each node is responsible for one or more consumers. When the model does not go into an excessive degree of detail, approximate methods may be used for defining the consumptions, based on the definition of the consumption areas around each node, in the determination of lengths of pipes supplied from the different nodes of the model, or in the diameters of the pipes that supply the different sectors from the arterial network and the number of inhabitants or bills located in each sector.
However, in sector models it will be necessary to guesstimate as closely as possible to reality the distribution of consumption in the situations that the field measurements will take place in, with the object of contrasting the latter with the results that will be given by the model. The actual
Chapter 2 Models in water distribution networks
10
uncertainty in the distribution of consumptions means that these can be considered as parameters to be adjusted. This uncertainty is not only imposed by hourly variations in consumption, but also by the existence of leaks, illegal connections, meter errors, etc… in short, by uncontrolled consumptions that should be distributed in some way among the system’s nodes.
The reliability of the allocation of this flow (the model’s total load) will increase with a larger amount of available information. It would be desirable to take into account:
Meter readings: these give us the consumed volume for user in a specified time period. It is important to have this information on a magnetic band so that it can be related with network’s databases and its simplified model’s database. In short, it’s a case of relating each user to a service pipe of the network, which in turn is related to one of the mathematical model’s nodes. In this way each one of the users can be related to one of the skeleton’s nodes, so that the model can be adequately loaded;
Temporary evolution of demand: consumption is not constant throughout all hours of the day, nor throughout the week, nor for different times of year.
Consumption modulation exists, initially different for each user, and it depends on very different factors that should be mentioned:
• Type of user: generally classified as domestic, industrial, commercial and community
services. This last type includes hospital, schools, irrigation of parks, street cleaning, etc…;
• Socioeconomic level of the user: this influences decisively not only the total consumed
volume, but also how it is consumed;
• Tourist areas: this has a strong seasonal consumption component, more than half the annual
consumption being concentrated in the three summer months;
• Domestic storage: the user’s greater or lesser storage capacity influences decisively the hourly
modulation slope. In many cases the user has storage tanks, so that the real demand does not correspond to the actual consumption at each moment. However, in the case of direct supply from service pipelines, the peak consumption that the network is subjected to are more pronounced;
• Pressure levels in the network: this influences strongly the value of instantaneous flow rate for
those users that have a direct supply, as there is a large number of consumption devices in which the instantaneous flow rate is a function of pressure.
Generally, to determine the evolution of consumption it is indispensable to take a sample of different types of users, with the object of fixing a characteristic modulation slope for each one. Multiplying the total consumed volume by the modulation coefficient, which corresponds to the situation that is analyzed, we can obtain the instantaneous flow rate of each user.
The use of mathematical models for the management of operations in water distribution networks
Important consumers: it is convenient to take in situ measurements of the flow supplied to large consumers (large industries, hospitals, ect…) so that we may have a consumption distribution that agrees with reality. The relative importance of these in the supply system assembly means that it is necessary to include a node for each one of them, that will be loaded according to the measurements that were taken;
Uncontrolled consumptions, leaks: determining the volume of the water that is not registered in a supply system in the average time between two meter readings is relatively simple, as long as the total input volume is known. The difference between the latter and the volume of registered water will give us the uncontrolled volume, which to start with will include meter reading errors. The volume of registered water over the input volume at a certain moment in time is called the average efficiency of the network in this period. However, the absence of instantaneous consumption data in a supply system means that the uncontrolled instantaneous flow rate of water in a supply system cannot be determined with precision. This means that we must turn to guesstimates, and in the same way it is practically impossible to allocate it in a reliable manner between the model’s nodes.
These uncontrolled flow rates are due to illegal connections, leaks, municipal consumption or services that cannot be measured, meter errors, etc… They also suffer modulations throughout the day or time of year; so for example, the leaks in a water supply system increase as pressures increase, generally in low consumption periods if the piezometric height at the beginning of the system is not reduced. Their spatial distribution is conditioned by factors such as the material used in their pipes and valves, their age and other more or less fortuitous phenomena. To estimate their situations it can be useful to have results of leak analyses that have been carried out on the system. In function of these it is possible to, for example, carry out a distribution that will be proportional to the metres of piping of each material.
In any case, an estimate of uncontrolled flow rates can serve as initial data when they are used as adjusting parameters. During the model’s calibration process this distribution can be modified in such a way that, in some cases, areas of the system can be detected where the consumption is increased, which can mean a greater degree of leaks or of illegal connections. Evidently, it can be very useful to have the instantaneous flow rate values input to the system at each one of the network’s sectors, as in this case the problem of distribution is sectional, so that the errors made in the initial estimates can be considerably less.
Taking into account all of these factors that have been mentioned, it is always possible to establish a method for assigning flow rates to the model’s nodes. We must not forget that it always will be a guesstimate, whose reliability will increase as the initial data improves. We will thus return to what has been said in previous sections: the quality of a model is clearly influenced by the quality of the initial data.
2.5.4 Load of the model. Exportation of the model to
hydraulic simulator
All nodes of connection between pipes or ends thereof are points of consumption. These nodes are declared automatically by tracing the pipes, by assigning the internal numbering scheme and default attributes. In the case of consumer nodes, the most relevant information for the purpose of hydraulic modeling is the base demand and the modulation time of demand.
Once constructed the mathematical model of the network with the support of GIS software, can be exported the file (.shp) to the hydraulic simulator Epanet, with the aid of which calibration is performed and run the simulations.
Chapter 2 Models in water distribution networks
12
2.5.5 Calibration of the model. Adjustment of the parameters
The calibration of a mathematical model involves the correction or adjustment of various parameters of it, with the ultimate aim of having that the results of the simulation approaching as much as possible to the actual measured values.
The adjustable parameters during the calibration process are those likely to introduce a degree of uncertainty in the model. These are usually roughness of pipes, minor losses or localized, and in case as dynamic models like this, the control laws of valves and pumps. Also you can adjust the values of other parameters such as the height on some points of the network and the diameter of a pipe, but it is assumed that these variables are part of the group of network characteristic data obtained with sufficient reliability.
The calibration of a model with these features (with high numbers of tanks, with various regulating and control elements) is particularly complex and laborious. Before addressing the calibration of any model is recommended to set a certain strategy, a fact that, given the circumstances of the system that is intended to model, it becomes indispensable.
The calibration is done gradually, and we first need to simplify the problem, for which it acts in two ways:
1. Divid the general model into several smaller ones. These submodels calibrate first, so after completing the process, in all of them are moved the results of each model to the full model;
2. Reduce the maximum degrees of freedom of the model or sub-model is intended to calibrate. This involves forcing, hour by hour, the behavior of valves and pumps, as well as forcing all flows entry and exit to the system. This is achieved by ensuring that the circulating volume is adequate for the load assigned to the model, thus reducing the degree of uncertainty in the system. It is more reliable to make decisions and make adjustments when it knows that the incoming and outgoing flows are correct when they are not. The same applies to the behavior of valves and pumps. In addition, the calibration process of each sub-model is also develops gradually, so that the number of forced elements is reduced gradually, as the simulation results are getting better.
In general, the calibration process involves a series of actions on two types of variables: first, hydraulic parameters of the network, and secondly, on the control parameters of the pumping units or operated valves during the exploitation of the system.
These actions involve the introduction of new information in the model, as well as the modification of an existing: mainly in pipes, valves, pumps and nodes. The following are the most common changes that occur during the adjustment process of the calibration itself:
∗ Setpoints: these values define the operation of valves and pumps. In some instances, actual
values are known and as such it is sufficient to incorporate the model. In other cases, the values are known but should be adjusted if you want to reproduce with sufficient accuracy the performance of the element in question, since the actual value is not achieved the latter. There is also the possibility that the setpoints are to be estimated, though for two separate cases: they are not known but are estimated basing on indirectly controlled hydraulic variables, such as levels in tanks or water flows, or they are not known because not really exist. The latter case corresponds to the case of valves in the model are defined by a distinct typology of real: one regulating valve can be incorporated into the model as a pressure reducing valve if it is proved that the pressure downstream of it just varies in time;
∗ Control laws: these laws are extremely useful when receiving orders simulate the operation
The use of mathematical models for the management of operations in water distribution networks
13
reproduce the commands scheduled at various local automation, devices that control the operation of all elements basing on records of specific hydraulic parameters. In other cases, the control laws try to simulate the actions ordered by a person who oversees the system from a control station;
∗ Typologies of the valves: they get approach the behavior of the model to real network
operation, improving the results of the simulation;
∗ Lower losses: by default, all the pipes are assigned an initial value of zero coefficient lower
losses. May occure that their respective piping head losses are different from those initially resulting from the simulation carried out. The modification of this divergence between the model and reality may be due to several reasons: one is that the losses in the pipe are lower than expected, which can be explained by not having considered some peculiarity in the way or because the roughness assigned to be different from real; the second reason to change the coefficient of minor losses initially allocated is to reduce the current flow through the pipe to nearest other values are estimated as real;
∗ Heights: dimension values assigned during the making of the model come from
measurements made at the field level, however most of the installations run at some depth so that the assignment of dimensions may take some error both for the height difference both for insufficient levels of measurement points.
During the calibration of the model have been introduced a number of changes in the different parameters of the model definition, have been introduced and a number of discrepancies between the model in Epanet and the file obtained in GIS have been generated. It will therefore be necessary to introduce all the changes that were made during the calibration procedure into the GIS base data. This will allow us to re-export the model of Epanet directly from GIS, in a simpler way.
2.6 Framework required for connection and management of
hydraulic models
Modern software tools are necessary for solution problems with operation of water supply system such as hydraulic, qualitative, and economic and safety problems.
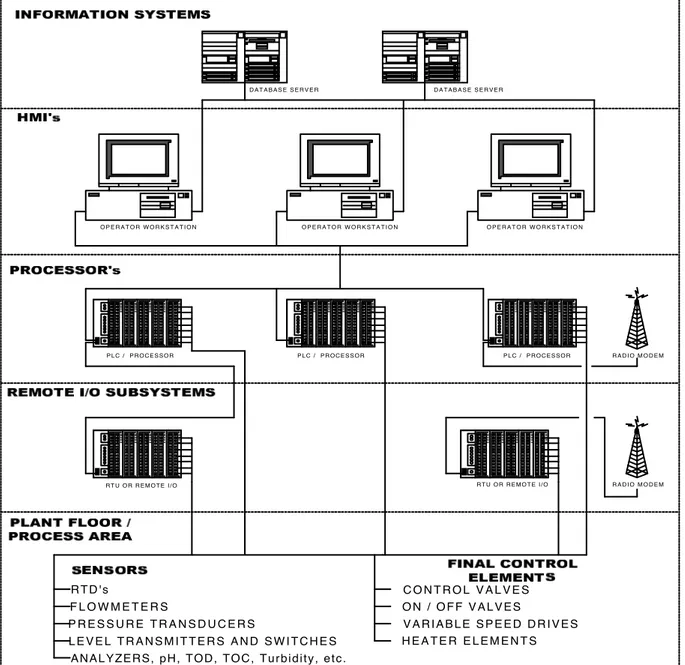
Management is complex tool for administration and operation of water supply system. It contains modern software tools divided in of three groups:
1. Mathematical model;
2. GIS;
3. SCADA.
These processes allowed us manage whole system more effective with information in real time. All three systems works with information data of conditions of water supply system.
! ! "#$!
%&'&()*)'+! ,-! ./*01)2! +//1! 3/4! &5*,',-+4&+,/'! &'5! /0)4&+,/'! /3! 6&+)4! -70018! -8-9 +)*:!;+!./'+&,'-!*/5)4'!-/3+6&4)!+//1-!5,<,5)5!,'!/3!+=4))!(4/70->!
9!%&+=)*&+,.&1!*/5)1-!
9!?@ABA!C?70)4<,-/48!@/'+4/1!A'5!B&+&!A.D7,-,+,/'E! 9!F;?!
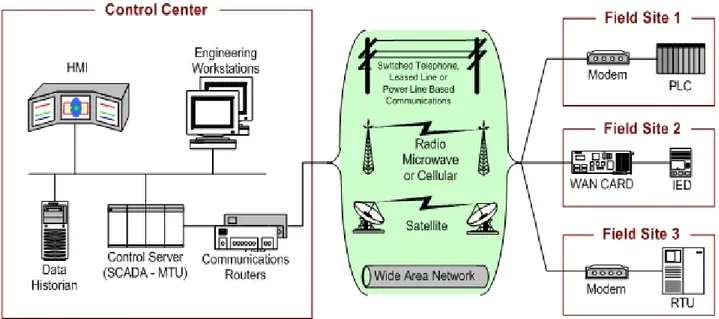
G=)-)!04/.)--)-!&11/6)5!7-!*&'&()!6=/1)!-8-+)*!*/4)!)33).+,<)!6,+=!,'3/4*&+,/'! ,'! 4)&1! +,*):! A11! +=4))! -8-+)*-! 6/4H-! 6,+=! ,'3/4*&+,/'! 5&+&! /3! ./'5,+,/'-! /3! 6&+)4! -70018!-8-+)*:!G=)8!&4)!./'').+)5!+/()+=)4I!,'3/4*&+,/'J-!.&'!04/<,5)!+/!)&.=!/+=)4! CK,(:!LE:! ! !"#$%&$!B&+&!./'').+,/'!/3!F;?I!?@ABA!&'5!*&+=)*&+,.&1!*/5)1!,'!6&+)4!-70018!*&'&()*)'+! '$&%()*+,%-.//01%2"3/)*45"6#% K/4!)33).+,<)18!./'+4/1!/<)4!.=/-)'!+).='/1/(,.&1!-8-+)*!-7.=!&-!6&+)4!-70018!-8-+)*! ,+!,-!&5<,-&M1)!=&<)!-733,.,)'.8!&.+7&1!&'5!=,-+/4,.&1!5&+&!&M/7+!-8-+)*!./'5,+,/'!&'5! +/! =&<)! 0/--,M,1,+,)-! /3! /0)4&+,<)! ,'+)4<)'+,/'! ,'! +).='/1/(,)-:! G=)-)! &11/6-! /0)4&+)! &'5!*/',+/4,'(!-8-+)*!?@ABA!C?70)4<,-/48!@/'+4/1!A'5!B&+&!A.D7,-,+,/'E!9!6&+)4! 5,-0&+.=,'(:! G&-H! /3! 5,-0&+.=,'(! ,-! &7+/*&+,.&118! ./11).+I! +4&'-3)4I! &4.=,<)! &'5! &'&9 18N)!,'3/4*&+,/'!34/*!*/',+/4)5!+).='/1/(,.&1!+//1-!/3!/MO).+-I!&1&4*!M8!+=)!.4)&+,/'! 5)31).+! 34/*! '/4*&1! ./'5,+,/'-I! 4)(,-+)4! +=)-)! )<)'+-I! ./*0,1)! *)--&()-! &'5! 04/+/9 ./1-:!!!
P)*/+)!*/',+/4,'(!&'5!./'+4/1!)1)*)'+-!/3!6&+)4!-70018!-8-+)*!*)&'-!./'').+,/'! /0)4&+/4!6,+=!+=)!5)<,.)-!/'!-=/4+!)<)'!1/'(!5,-+&'.)-:!%/5)4'!6&+)4!5,-0&+.=,'(!,-! +6/96&8!./'+4/1!-8-+)*:!;+!*)&'-!'/+!/'18!*/',+/4,'(!04/57.+,/'!&'5!5,-+4,M7+,/'!/3! 6&+)4I! M7+! &1-/! M&-)5! /'! ./11).+)5! &'5! 04/.)--)5! 5&+&! 34/*! */',+/4,'(! +/! )<&17&+)! -,+7&+,/'!&'5!+/!)'+)4!./**&'5-!3/4!./'+4/11,'(!.=/-)'!-8-+)*!)1)*)'+-:! Q&+)4!5,-0&+.=,'(!=&-!3/74!*&,'!3)&+74)->! 9!;'3/4*&+,/'!37'.+,/'!9!R@!,'!+=)!5,-0&+.=,'(!)'&M1)-!+/!5,-01&8!,'./*,'(!5&+&! 34/*!)'+,4)!6&+)4!-8-+)*S! 9!@/'+4/1!37'.+,/'!9!4)*/+)!./'+4/1!/3!.=/-)'!)1)*)'+-!/3!6&+)4!-8-+)*S!!! 9!A7+/*&+,N&+,/'!37'.+,/'!9!6,+=/7+!,'+)4<)'+,/'!./'+4/1!04/.)--!/3!04/57.+,/'!&'5! Fig.2.4:Connection between tools