University of Rome “Tor Vergata”
COMPARATIVE GENOMIC APPROACH FOR
PROTEIN-PROTEIN INTERACTION VALIDATION
Luisa Montecchi-Palazzi
CONTENTS:
GLOSSARY
ABSTRACT
PART 0: INTRODUCTION
Overview on protein interaction data
• Protein interaction detection methods
• Current status of protein interaction exploration
Approaches to protein interaction validation
• Interaction validation by network intersection
• Interaction validation by co-annotation
• Interaction validation by co-expression
• Interaction validation by genome comparison
PART 1: THE EXPLOTATION OF THE PEPSPOT
TECHNOLOGY TO INVESTIGATE PEPTIDE
BINDING PREFERENCES
PepSpot as a protein interaction detection method
• PepSpot technology
• Proteomic screening of SH3 mediated interactions with PepSpot
method
• PepSpot network comparison
• SH3 mediated network comparison
14-3-3 partner prediction based on PepSpot mutagenesis
• 14-3-3 containing proteins
• PepSpot mutagenesis of 14-3-3 binding peptides
• Implementation of a prediction tool based on PepSpot
mutagenesis
• Benchmark of the prediction tool versus experimental results
PART 2: APPLICATION OF THE COMPARATIVE
GENOMIC FILTER AND OTHER VALIDATION
STEPS FOR AN IN SILICO 14-3-3 BINDING
PEPTIDE SCREENING
Comparative genomic filter
• Scope
• Building of orthologous protein alignments
• Proof of concept using PROSITE patterns and ELM motifs
• Scoring the conservation of putative 14-3-3 ligands
Procedure for the in silico 14-3-3 binding peptide
screening
• Selection criteria at the peptide level
• Selection criteria at the protein level
Result of the in silico screening and comparison with
experimental results
• In vivo detection of 14-3-3 mediated interactions
• Filters benchmark against experimental data
• In silico prediction of 14-3-3 mediated interactions
CONCLUSIONS
APPENDIX
MATERIALS AND METHODS
• Gene Ontology
• Curation of protein-protein interaction
• Building a proteomic table to combine S. Cerevisae data.
• Protein functional pattern
REFERENCES
GLOSSARY:
Interactome : complete set of protein-protein interactions of a given organism.
Proteome : complete set of protein-encoding Open Reading Frames (ORF) automatically translated from fully sequenced genomes of a given organism. Protein pattern or motifs : specific cluster of amino acids known to be associated to a specific protein function.
Position Specific Scoring Matrix (PSSM) : probabilistic representation of a protein pattern, using a matrix storing each residue propensity to occur within a sub-sequence matching the pattern.
Regular expression : deterministic representation of a protein pattern taking advantage of symbols to list the allowed residues within a sub-sequence matching the pattern.
Databases acronyms :
GO: Gene Ontology
ELM : Eukaryotic Linear Motif database SGD : Saccharomyces Genome Database
CYGD : Comprehensive Yeast Genome Database YPD : Yeast Protein Database
MINT: Molecular INTeraction database
BIND : Biomolecular Interaction Network Database DIP : Database of Interacting Proteins
UniProt: Universal Protein resource
Abbreviations:
ORF : Open Reading Frame Co-Ip : CO-ImmunoPrecipitation
PSSM : Position Specific Scoring Matrix BLU : Boheringer Light Units
ABSTRACT
Currently , a large community effort focuses on protein interaction data as a mean to explore uncharacterized proteins function, discover new pathways and identify potential drug targets. However, the redundant screenings carried out in the past four years in Saccharomyces cerevisae show a very weak overlap and underline the need of protein interaction data validation. Here we propose a new comparative genomic validation approach based on the conservation of binding sequences within orthologs alignments of fifteen closely related yeast species.
Taking the 14-3-3 domains as a study case we explore the binding specificities of their ligand peptides taking advantage of mutagenesis analysis carried out by PepSpot experiments. Using these experimental results we create a prediction tool based on regular expression combined with position specific scoring matrix able to screen the full in S. cerevisae proteome and identify putative 14-3-3 domain ligands. The comparative genomic method together with other well established protein interaction validation approaches are benchmarked as filters to increase the accuracy of this prediction. We show that the conservation across several yeast species of 14-3-3 interacting sequences successfully discriminates binding sites from spurious regions matching by chance ligand consensus and increase the prediction accuracy of a four fold.
INTRODUCTION
In the current post-genomic era one of the main issues of molecular biology is the functional characterisation of gene products. Taking advantage of the massive sequence information available we can now list the genes and the proteins encoded by a steadily increasing number of genomes. However, sequence knowledge is just the first step of a “proteome” understanding and is far from enough if we aim at deciphering how cellular networks regulate complex processes such as development or external stimuli responses. Comprehensive protein-protein interaction maps promise to reveal many aspect of regulatory and molecular mechanism underlying cellular function. Moreover, interaction network together with RNA expression data and genomes sequences are the major component whose integration should lead system biologists to re-create comprehensive artificial cellular model in the forthcoming years. To pursuit this aim it is important to establish unified standard to facilitate navigation among different data types and indeed to ensure the reliability of the information provided. Significant efforts are currently done not only to standardize and map related gene RNA and protein sequences (Kersey P et al., 2005) but also to release expression interaction (Brazma et al., 2001) and other proteomic data (Orchard et al., 2004) according to a unified format to the public domain. Our interest focuses on protein-protein interaction, and here we want to briefly summarize the different experimental methods used to determine protein interaction and the issues raised by the recent advance in interaction network exploration in particular the need of data validation procedures.
Overview on protein interaction data
Protein interaction detection methods
Currently we have collected more than a hundred experimental methods described in the literature as tools to detect protein interaction1. (See
materials and methods section Curation of protein-protein interaction). In table 1 we report only some of the most popular methods and their general
features. Each method detects protein interaction at a specific level of resolution. For instance X-ray crystallography provides an atomic resolution of the interaction interfaces, whereas co-immunoprecipitation (Co-Ip) only detects the proteins participating in an interaction but does not give any clue about the topology of the complex. On the other hand, Co-Ip provides an insight on complex formation within living cells and has been implemented in a high through put scale determining the in vivo partners of thousand of proteins. Besides, in order to determine ligand affinity in a straightforward manner others biophysical analysis are required and similarly specific experiments must be performed to assess interaction partners location in vivo
or to determine the specific residues involved in an interaction.
Class Method Analytical
Perspective
Resolution level
Advantages
Biochemical
Co-immunoprecipitation (Co-Ip) Perspective Complex in vivo
ELISA Analytical Protein
Filter Blot Analytical Protein Pull down Analytical Protein/residues Co migration in non denaturing gel Analytical Complex in vivo Biophysical
X-ray crystallography Analytical Atomic
NMR Analytical Atomic
Surface plasmon resonance (Biacore) Analytical Protein kinetics Isothermal titration calorimetry Analytical Protein kinetics Scintillation proximity assay Analytical Protein kinetics Protein Complementation
Two hybrid Perspective Protein
FRET Analytical Protein in vivo location Bacterial two-hybrid Perspective Protein
Array technologies
Protein array Perspective Protein Pep Spot Perspective Residues Phage display Perspective Residues Table 1 : Main features of some protein interaction detection method. We call perspective the methods that have currently been used to explore uncharacterized protein interaction whereas analytical apply to experimental procedures that investigate known interactions.
Overall there is currently no single interaction detection procedure that can provide alone comprehensive information about an interaction in vivo. The only way to collect all possible data about an interaction is through the integration of different experimental results. This is the main scope of protein interaction database such as MINT (Zanzoni et al., 2002), Intact (Hermjakob et al., 2004b), DIP (Xenarios et al., 2002), HPRD (Peri, S. et
al., 2004) and BIND (Alfarano et al., 2005) where all experimental
evidences supporting a given interaction are reported and uniformly collected in a common repository.
In the last five years two techniques have emerged to explore large numbers of proteins interaction without any prior knowledge of their biology apart from their sequences. Two hybrid (Fields & Song 1989)and Co-Ip are in fact well established experimental methods often used in small scale experiments that have also been adapted to high level of automation for systematic detection of large numbers of interacting proteins.
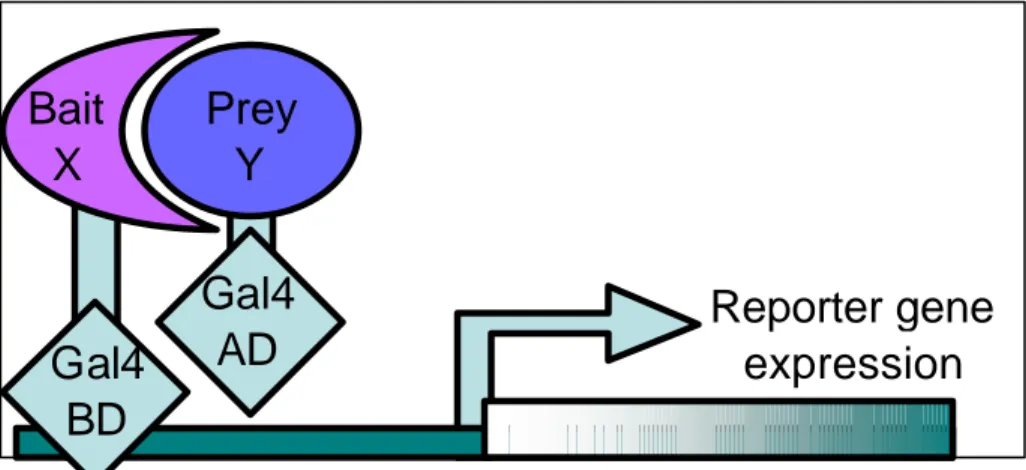
The double hybrid or two hybrid system is a method that uses transcriptional activity as a measure of protein-protein interaction. It relies on the modular nature of the site-specific transcriptional activators GAL 4 (see Figure 1) , which consist of a DNA-binding domain (BD) and a transcriptional activation domain (AD). The DNA-binding domain serves to target the activator to a reporter gene that will be expressed, and the activation domain contacts other proteins of the transcriptional machinery to enable transcription to occur. The two-hybrid system is based on the observation that the two domains of the activator need to be non-covalently brought together by the interaction of any two proteins.
The application of this system requires the expression of two hybrid plasmid encoding the two proteins under study as fusion protein of the activator and DNA binding domain. Several variations of the high throughput implementations of the two hybrid method are reported in the literature and each one has specific features that can deeply influence the reliability of the results. One of these is the two hybrid matrix approach (Uetz et al., 2000) where a collection of haploid yeast strain carrying hybrid plasmids is mated with an equivalent collection of opposite mating type on a microwell plate array.
Figure 1 : Two hybrid mechanisms for protein interaction detection. When a polypeptide fused to the binding domain interact with the one fused to the activation domain a reporter gene is expressed.
This approach has the advantage of exploring systematically all possible protein pairs for interaction testing an interaction in both experimental directionalities (A-bait-B-prey and B-bait-A-prey) and thus the investigations are generally limited to hundreds of proteins. However, the interacting protein identity is associated to their position in the mating matrix and re-sequencing of the positives clones is not always performed. On the other hand, in the library pooling approach (Ito et al., 2001) a complex collection of hybrid plasmid are randomly cloned into yeast cells enabling the exploration of thousands of protein interactions but without guarantee of testing all possible combinations. In the library approach the sequence of the positive clones is always determined downstream certifying the proper insertion of the coding sequence in the plasmid. Moreover using the library approach several clones can detect the same interaction, and the number of double hybrids that independently report an interaction is used as an internal reliability measure. Finally when a library of coding sequence fragments are used (Rain et al., 2001), each interaction is redundantly detected and the minimal binding regions required for the interaction can be derived by comparing the clone sequences. In all cases although two hybrid interactions occur in vivo, the two protein moieties are artificially co-expressed and brought together in the nucleus to test their ability to interact. However, the two proteins under analysis might never be expressed at the same time or in the same cell compartment in a natural system.
Reporter gene
expression
Bait
X
Gal4
AD
Prey
Y
Gal4
BD
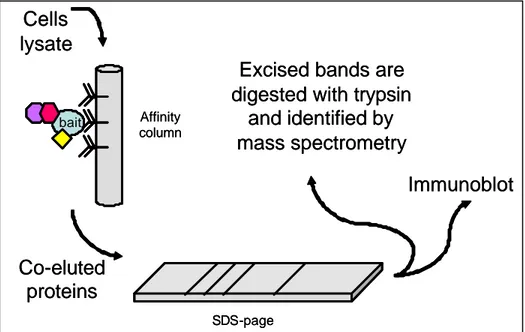
Co-immunoprecipitation instead is a method that can be carried out without altering the natural expression of proteins within cells. In fact Co-Ip relies on an antibody, specific for the protein of interest (generally called bait) or any tag expressed within a fusion protein , used to separate the bait from a protein mixture or a cell lysate and to capture its ligand simultaneously (see Figure 2). The protein partners that bind to the bait protein are retained by the resin are co-eluted, then they are separated by electrophoresis and identified either by immunoblot or by mass spectrometry when the experiment is carried out in a high throughput manner. The exploitation of tags fused to the proteins often implicates transfection of expression plasmids leading, as a consequence, to over-expressing the bait. On the other hand the tags can also be attached to the proteins by genomic integration of the tag coding sequence directly in the genomic copy of the gene under study leaving gene expression under the control of the endogenous promoter. Nevertheless the tags ensure specific retention of the bait in the affinity column and reduce the incidence of contaminant proteins (Ho et al., 2002). For instance engineered tags like the tandem affinity purification (TAP tag) allow a double purification as it encodes a calmodulin-binding peptide and the S.
aureus protein A separated by a cleavage site (Gavin et al., 2002,
Bouwmeester T et al., 2004).
Figure 2 : Main steps of a co-immunoprecipitation experiment.
Cells
lysate
Co-eluted
proteins
Affinity column SDS-pageExcised bands are
digested with trypsin
and identified by
mass spectrometry
Immunoblot
baitCells
lysate
Co-eluted
proteins
Affinity column SDS-pageExcised bands are
digested with trypsin
and identified by
mass spectrometry
Immunoblot
Although Co-Ip is generally considered as a method detecting naturally occurring interaction it does not prove that two or more proteins directly bind each other. Co-Ip detects clusters of aggregated proteins without providing any indication of the binary pairs of interacting proteins within a complex. Such cluster are generally deployed according to two alternative schema, the so call “spoke model” where all possible bait-prey pairs are inferred to interact or the “matrix model” where all bait-prey and prey-prey pairs are predicted to be ligand. In fact only complementary experimental results derived from pull down, ELISA, or other in vitro methods can determine if two purified proteins directly interact without the intermediation of a scaffold or bridging protein. Even two hybrid results although they consist on binary pairs of interacting proteins do not prove an interaction is direct as whenever a third protein bridge the bait and the prey its presence is not detectable by the system.
Current status of protein interaction exploration
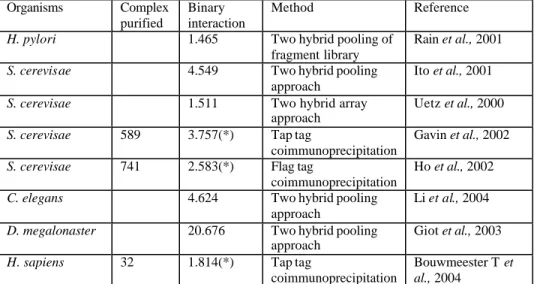
In the past four years many high throughput two hybrid and Co-Ip experiments have been carried out to explore interaction networks of the main model organisms (see Table 2).
Organisms Complex purified
Binary interaction
Method Reference
H. pylori 1.465 Two hybrid pooling of
fragment library
Rain et al., 2001
S. cerevisae 4.549 Two hybrid pooling approach
Ito et al., 2001
S. cerevisae 1.511 Two hybrid array
approach
Uetz et al., 2000
S. cerevisae 589 3.757(*) Tap tag
coimmunoprecipitation
Gavin et al., 2002
S. cerevisae 741 2.583(*) Flag tag
coimmunoprecipitation
Ho et al., 2002
C. elegans 4.624 Two hybrid pooling
approach
Li et al., 2004
D. megalonaster 20.676 Two hybrid pooling approach
Giot et al., 2003
H. sapiens 32 1.814(*) Tap tag
coimmunoprecipitation
Bouwmeester T et al., 2004
Table 2 : High throughput interaction detection experiments.
(*) Binary interactions are derived from the co-purified complex only as a set of bait-prey pairs, according to the “spoke model”.
In the case of C. elegans and D. megalonaster most of the known interactions are derived from the high throughput experiments, whereas for human and yeast other small scale experimental results are available in the public interaction databases. Regarding Homo sapiens 11.500 unique interactions are spread in the various interaction databases, only 15% have been detected on a single large scale experiment and 26 % of them have been observed in two independent experiments (Cesareni et al., 2005). For S.
cerevisae around 13.000 unique interactions can be retrieved, more than
90% of those come from high throughput experiments and only 15 % have two or more supporting experiments (see Graph 1).
Graph 1 : Distribution according to their number of supporting experimental evidences of the yeast 13.000 interactions network.
The lack of overlap between the yeast high throughput experiments is striking and has three possible explanations: the various method may not have reached saturation of an estimated 30.000 interactions network (Ito et
al., 2002, von Mering et al., 2002), the methods may produce a significant
fraction of false positives, some methods may have bias towards certain types of interactions, resulting in the complementarities between the methods.
This observation highlights the necessity of using interaction data with caution and it underlines the need of further experimental investigation to complete our knowledge at least in model organisms of fully covered
85%
Interactions detected once
5%
10%
Interactions detected twice Interactions detected
interaction networks. Moreover it emphasizes the utility of interaction databases as integrative repository of the multiple evidences needed to fully investigate and assess the reliability of protein interactions. Finally the distrust about interaction information obtained by high throughput experiments has stimulated the development of validation procedures to identify interactions that are more likely to be true.
Current approaches to protein interaction validation
Interaction validation by network intersection
The idea of systematically double checking interactions has been first proposed by Tong and co-workers (Tong et al., 2002) that investigate SH3 mediated interactions in yeast both by phage display and by two hybrid. Only 25 % of the interactions are detected by both methods but they show that the intersection is highly significant as the overlap of randomized networks is by far much smaller. Moreover the intersection network they obtain is enriched in interaction derived from the literature over threefold compared to the single method networks. Thus the authors conclude that considering intersection network is a simple but powerful mean to exclude the false positive results of each experimental screening.
Similar conclusions come out of the systematic comparison of all large scale yeast data sets benchmarked against a trusted reference set of manually curated interactions derived from the literature (von Mering et al., 2002). This study confirms that the highest accuracy in recovering known interactions is achieved by deriving intersection networks where every interaction is supported by any pair of evidence and that the overlap of high throughput data is twenty times larger than expected by change. Furthermore the overlap networks mainly consist of interaction in which both partners have the same functional annotation and cellular localisation.
Accordingly in the MINT database a general confidence value is assigned to every interaction based on the following criteria :
Confidence level 1: interaction detected by a single experiment
Confidence level 2: interaction detected by two or more experiments reported in the same publication.
Confidence level 3: interaction detected by two or more experiments from independent publications.
Confidence level 4: interaction detected by two or more independent experiments and at least one of those is an in vivo Co-Ip.
Confidence level 5: interaction detected by two or more independent evidences and at least one of those is an in vivo Co-Ip experiment carried out using antibodies against endogenous proteins.
This simple tool provides a straightforward estimation of the reliability of each the interaction stored in the database.
Interaction validation by co-annotation
This validation method has been currently used only in S. cerevisae not only because its interaction network is the most covered but also because yeast as a model organisms has a very well characterized proteome. More than 4.500 of its predicted 6.200 ORFs have been verified and functionally investigated. The three main repositories dedicated to S. cerevisae are Comprehensive Yeast Genome Database (CYGD) (Guldener et al., 2005),
Saccharomyces Genome Database (SGD) (Balakrishnan et al., 2005) and
Yeast Protein Database (YPD) (BIOBASE Wolfenbuttel, Germany) and they all provide functional annotation about gene products either using Gene Ontology cross-reference (See Materia l and methods section about Gene Ontology) or adopting internal classification systems. Generally a characterized gene product have annotation concerning its subcellular location, its molecular function (such as enzymatic activity, or DNA binding ability) and its cellular-role that refers to its participation in broad cellular process (for instance metabolisms or stress response). Trivially proteins that interact should share the same subcellular compartment and are likely to participate in the same cellula r process whose mechanism may rely on their binding. However binding partners can have very different molecular function as for instance a regulatory interaction can easily involve a protein kinase and a transcription factor. Thus co-location and the sharing of a common cellular-role can be used as supporting evidence of a true positive interaction whereas having the same molecular function cannot be employed as a validation criterion.
The observation that in trusted interactions the protein partners share both their functional annotation in terms of cellular processes and cellular compartment (von Mering et al. 2002) can be used to quantitatively estimate the accuracy of experimental data sets (Sprinzak et al., 2003). In this analysis the rate of true positives is measured for high throughput and for small scale data clustered according to the method used for their detection. The results provide a possible ranking of the various experimental methods and confirm once again that intersection networks are the one with the highest rate of true positives interactions. According to this study affinity chromatography and Co-Ip are the more reliable methods whereas approximately 50% of the two hybrid large screenings are believed to be false positives.
Interaction validation by co-expression
The basic hypothesis underlying such approach is that genes that are co-regulated and co-expressed are likely to be involved in related biological process and thus to be interaction partner. Yeast remain the ideal model organism to carry out this analysis because together with the interaction data large scale RNA expression data are available (Giaever et al., 2002, Kemmeren et al., 2002). The first evidences supporting this well accepted idea are provided identifying clusters of genes having the same expression pattern under different conditions and subsequently counting the protein interactions occurring within or across expression clusters (Ge et al., 2001). In this work it is shown that the number of interactions within any given expression cluster are higher than expect when the same calculation is done on random networks. This confirms that co-expressed proteins more frequently interact among each other than with protein having different expression profiles.
Further studies from the same group focuses on highly connected protein the so called “hub” of the interaction network (Han et al., 2004). By measuring the correlation in RNA level between each hub and its partners two distinct populations are identified: the so called “party hub” that have high expression correlation with their partners (corresponding to the previous intra-cluster interaction) and the “date hub” that show lower expression correlation. Such distinction leads to a model for interaction network where
“party hubs” define the core of subnetwork modules whereas “date hub” ensure interconnection between the various modules. In fact the “party hub” partners have very homogenous annotation in terms of process and subcellular location and often correspond to functional complexes or known pathways. “Date hubs” do not show such homogeneity but interestingly their central role as network organizer is confirmed by the lethality of their gene deletion observed in genetic perturbation screenings.
Other independent works support the statement that among the various types of protein interaction mainly protein functional complexes, such as RNA polymerase or the ribosome, show a strong correlation of RNA expression levels (Jansen et al., 2002). Thus certainly co-expression have an average relation with protein interaction data and a strong expression correlation is a valuable in vivo supporting evidence that two or more proteins are likely to interact. However the problem is this approach do not help in identifying false positives interactions while lower correlation among partners could also be biologically meaningful (see above “date hubs”). Nevertheless a validation approach based on co-expression is currently available at DIP database. Expression data are not used to validate single interactions but to measure the overall reliability of a given interaction screening (Deane et al., 2002). This method calculate expression level Euclidean distance for all protein pairs in dataset under analysis and compare the distribution of such distances with the corresponding values derived from a trusted reference set of interaction and from a completely random network. The distance distribution calculated for two-hybrid screenings in yeast being equidistant from reference and random network distribution plots leads to the authors conclusion that overall 50% of the interactions are false positives.
Interaction validation by genome comparison
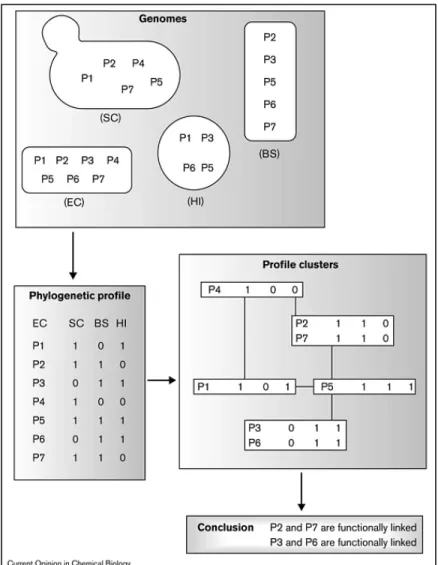
Genomes comparison can also lead to protein interaction validation. Many methods look for the evolutionary relics of protein interaction across fully sequenced genomes to infer functional or physical interaction. For instance one method, so called the Phylogenetic Profile method (see Figure 3), implies that proteins that are consistently present or absent in different proteomes sets are likely to have a functional relationship (Pellegrini et al., 1999). A second one the Rosetta Stone method searches proteomes looking for proteins that are covalently joined in a single peptide chain and interpret
this fusion event as evidence that these two proteins interact either physically or functionally in other organisms (Marcotte et al., 1999, Enright et al., 1999). A third one the Gene Order method, look at relative position of genes on various prokaryotes genomes and infer that genes submitted to an evolution pressure to remain close are likely to share the same function (Dandekar et al., 1999).
Figure 3 : Phylogenetic Profile method to detect protein functional interaction (Pellegrini 2001).
The protein-protein associations detected with these three methods are collected in the STRING database (von Mering et al., 2005) together with the experimental protein interactions and data derived from functional pathways. Data cross-comparison show that the protein relationship detected by genomic methods often correspond either to physical interactions, or to the participation in a same metabolic pathway or cellular process. Thus genomic methods can provide supporting evidence for protein interaction validation and are powerful tools for functional characterisation of newly discovered sequences. The three methods predict protein function with have an average 80% confidence in prokaryotes model organisms (Huynen et al., 2003).
Aside from these methods which explore genome organisation other focuses on conservation at the amino acid sequence level. One instance is the “correlated mutation” method that exploits parallel sequence variations in multiple alignments of orthologous sequences to infer interaction (Pazos & Valencia 2002). The underlying rationale is that pair of residues that are part of two interacting surfaces tend to co-evolve with changes in one protein being remedied by compensatory mutations in the partner protein. When there is a good species coverage for any protein pair under study application if this method by mapping residues involve in an interaction interface can also provide topological information about the interaction complex.
PART 1: THE EXPLOTATION OF THE PEPSPOT
TECHNOLOGY TO INVESTIGATE PEPTIDE
BINDING PREFERENCES
PepSpot, or peptides arrays synthesized on membrane by SPOT synthesis (Frank 1992, Reineke et al., 2001), is a powerful method to investigate molecular recognition events and has been heavily used in our laboratory to determine interaction between short peptides (8-25 residues) and their binding domains. The PepSpot method is not only suitable for protein interaction detection, but it gives direct access to the sequences responsible for the interactions enabling further binding specificities analysis and development of prediction tools.
PepSpot as a protein interaction detection method
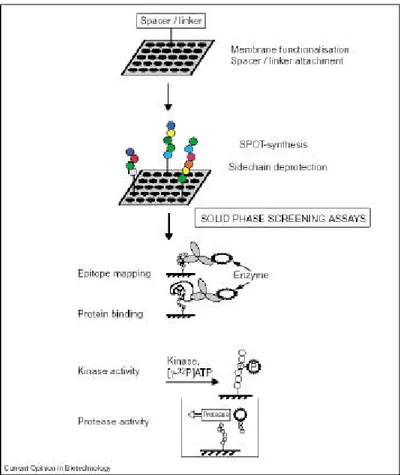
PepSpot technologyThe PepSpot method provides a fast procedure to generate a large number of peptides and screen for their biological properties. The method applications (see Figure 1) include : the identification of peptides that promote immunological activity (epitope mapping), the characterization of enzyme targets (enzyme-substrate screening) and the detection of protein binding peptides (protein binding screening).
Focusing on the PepSpot in vitro protein binding screening, the experimental procedure (Kramer & Schneider-Mergener, 1998) can be summarized in four main steps:
1. Preparation of the membrane before the peptide synthesis. The Cellulose-Amino-hydoxyPropyl Eter (CAPE) membrane is activated by treatments with a number of reagents ensuring the covalent binding of the C-terminus of each peptide.
2. Peptides are automatically synthesized on the cellulose membrane using a SPOT synthesizer under positional control of LISA software (Jerini AG, Berlin Germany) guaranteeing that a specific sequence including residue modifications is synthesized at any given position.
Figure 1: Different application of the SPOT-synthesis peptide arrays (Reineke et al., 2001).
3. Incubation of the membrane with a probe protein previously expressed and purified.
4. Detection of the spot retaining the probe after membrane washes, using anti-probe antibodies. The detection of a peptide-bound protein can be carried out using a chemoluminescence substrate providing a quantitative intensity signal in BLU (Boheringer Light Units), associated to any spot.
The PepSpot method has the great advantage of reproducing synthetically any naturally occurring sequence and any kind of post translation modification on it. On the other hand, the extent of the interaction space that can be explored with this method is clearly limited by the peptide length and by the number of peptides (around 10.000) that can be reasonably synthesized given the current technology. However, a fairly large part of protein interaction relies on small domains (SH2, SH3, PTB, WW, EH, PDZ, GYF, VHS, WD40, 14-3-3, FHA etc.) accommodating in their binding pocket short peptides of the partner protein in extended conformation (Pawson & Nash, 2003). Thus , in a good number of cases it is reasonable to model protein-protein interaction to peptide-domain interaction and consequently use the PepSpot method to identify natural peptides with the potential for binding a given domain. Clearly , the inference of in vivo interactions from PepSpot results could turn out to be incorrect for several reasons. First, the domain recognition determinants on a protein surface may be dispersed discontinuously on the sequence and may not be represented by any linear peptide. Alternatively , a potentially binding peptide could be buried inside the folded protein and therefore inaccessible to interaction partner. Finally, the two inferred partners might never coexist in vivo because they are located in different cellular compartments or expressed in different tissues or at different times during an organism development.
Proteomic screening of SH3 mediated interactions with PepSpot method
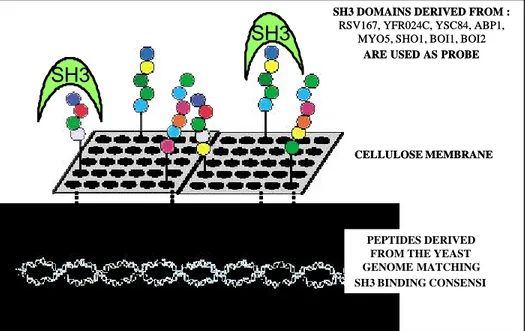
To assess the feasibility of a proteomic screening approach by the PepSpot method, eight S. Cerevisae proteins contain ing SH3 domains (RSV167, YFR024C, YSC84, ABP1, MYO5, SHO1, BOI1 and BOI2) were chosen and tested against two set of peptides (Landgraft et al., 2003). The peptide sets are generated searching all the peptides of the S. Cerevisae proteome that match the two well established binding consensi, the class 1 ([RK]xxPxxP) and the class 2 (PxxPxR) motifs. Each SH3 domain derived from the above mentioned proteins is probed against approximately 1,500 peptides synthesized at high density on cellulose membranes (see Figure 2). 211 peptides resulted to bind one or more of the probe SH3 domains with an intensity higher than a threshold of 20,000 Boheringer Light Units (BLUs), corresponding to a dissociation constant of approximately 10-6 M. The
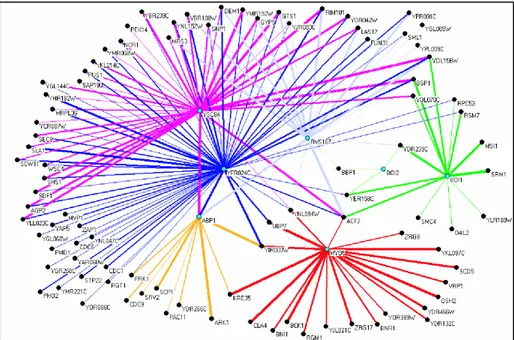
derived network counts 180 inferred interactions (see Figure 3) among 111 proteins (some proteins contain more than one high affinity peptide).
Figure 2 : Strategy to explore all SH3 mediated interaction in S. cerevisae.
As shown in figure 3, the SH3 domains of RSV167, YFR024C and YSC84 have overlapping specificity and thus promiscuous binding partners, whereas ABP1, SHO1, BOI1 and MYO5 have almost exclusive interactors. In the case of BOI2, the fact that it binds only 3 interactors with high affinity, confirms that its binding specificity is divergent from the standard motifs. This underlines the danger of extending a binding motif to all members of a protein family without experimental validation.
SH3
SH3
SH3 DOMAINS DERIVED FROM : RSV167, YFR024C, YSC84, ABP1,
MYO5, SHO1, BOI1, BOI2 ARE USED AS PROBE
CELLULOSE MEMBRANE
PEPTIDES DERIVED FROM THE YEAST GENOME MATCHING SH3 BINDING CONSENSI
SH3
SH3
SH3
SH3 DOMAINS DERIVED FROM : RSV167, YFR024C, YSC84, ABP1,
MYO5, SHO1, BOI1, BOI2 ARE USED AS PROBE
CELLULOSE MEMBRANE
PEPTIDES DERIVED FROM THE YEAST GENOME MATCHING SH3 BINDING CONSENSI
Figure 3: Protein interaction network inferred from PepSpot results. Nodes in cyan represent the SH3 containing proteins used as probe in the screening. The edge thicknesses are proportional to the BLU intensity of the corresponding interaction.
PepSpot network comparison
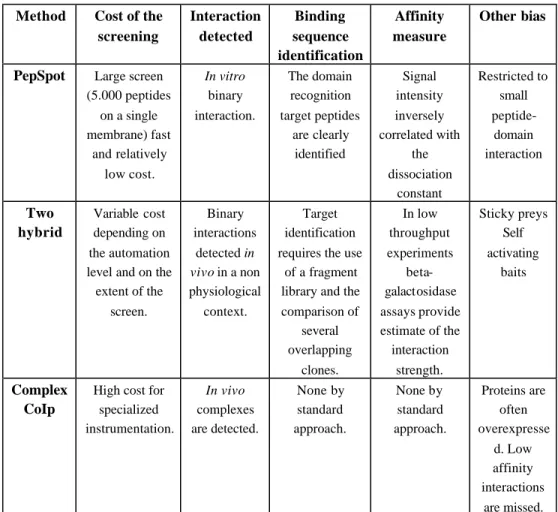
The PepSpot approach when compared with two hybrid and complex purification (see Table 1), offers the advantage of providing direct information about the sequences responsible for interaction and an estimate of the dissociation constant, thus complementing the information obtained by more direct in vivo experiments. Moreover, the lack of a substantial overlap between the results of the high throughput projects meant to cover the entire interactome of Saccharomyces cerevisae, emphasizes the importance of confirming any interaction by different methods (von Mering
Table 1: Comparison of the properties of three protein interaction methods.
In order to compare networks resulting from the different methods and therefore evaluate the PepSpot method performance, we computed the intersection of all major yeast interaction dataset stored in the MINT database (see Table 2, where the PepSpot SH3 dataset is reported as Landgraft et al.).
For each dataset we consider only non redundant interactions (if an interaction is detected twice as A-B and also as B-A we only count it once); by measuring the extent of the intersection network, we also pay attention to
Method Cost of the
screening Interaction detected Binding sequence identification Affinity measure Other bias
PepSpot Large screen
(5.000 peptides on a single membrane) fast and relatively low cost. In vitro binary interaction. The domain recognition target peptides are clearly identified Signal intensity inversely correlated with the dissociation constant Restricted to small peptide-domain interaction Two hybrid Variable cost depending on the automation level and on the
extent of the screen. Binary interactions detected in vivo in a non physiological context. Target identification requires the use
of a fragment library and the comparison of several overlapping clones. In low throughput experiments beta-galactosidase assays provide estimate of the interaction strength. Sticky preys Self activating baits Complex CoIp
High cost for specialized instrumentation. In vivo complexes are detected. None by standard approach. None by standard approach. Proteins are often overexpresse d. Low affinity interactions are missed.
count interactions regardless of their directionality and to avoid double scoring of homodimers.
The intersection networks derived by combining pairwise the yeast two hybrid screens (Ito et al., 2001 and Uetz et al., 2000) and the high throughput analysis of complexes (Gavin et al., 2002 and Ho et al., 2002), are consistent with cross comparison previously reported in the literature (Ito
et al., 2002 and Bader & Hogue, 2002). Besides, with these well known sets,
we compare results of the yeast SH3 containing protein two hybr id experiment performed by Tong and co-workers, that contain all the SH3 domains considered in our studies (Tong et al., 2002). Finally, we benchmark every single set against small scale experiments stored in MINT data base and against an automatically generated network including all known yeast interactions , excluding those from the set under analysis (row named “all” in Table 2). On this latter intersection network we evaluate the percentage of interactions and the percentage of interacting proteins shared by a single set with any other one. Obviously, these two numbers are related, because two networks can hardly have a common interaction if the two protein partners are not present in both sets. Thus, looking at the ratio of the overlapping interaction per common protein, we have a better estimate of the ability to recover an interaction of each set.
From these numbers it is easy to see that the network inferred from PepSpot results has a similar performance in comparison to the two hybrid screen carried out by Tong et al.,. Finally , although the overall coverage in terms of number of interactions explored is low, PepSpot method seams to have the highest capacity to recover interactions once the proteins of interest are submitted to a binding experiment.
Dataset size Intersect with Ito et al. Intersect with Uetz et al. Intersect with Tong et al. Intersect with Gavin et al. Intersect with Ho et al. Intersect with Landgraft et al. Ito et al. interactions 4443 proteins 3236 Uetz et al. interactions 942 188 proteins 996 278 Tong et al. interactions 231 5 2 proteins 144 9 3 Gavin et al. (*) interactions 3757 62 51 5 proteins 1471 102 82 6 Ho et al. (*) interactions 2583 56 50 5 152 proteins 1362 95 81 7 189 Landgraft et al. interactions 180 2 1 32 3 5 proteins 111 3 2 25 4 8
Small scale data
interactions 956 29 37 30 56 34 20 proteins 794 49 60 32 76 56 20 All ($) interactions 276 266 53 272 238 41 proteins 391 376 42 324 302 30 % Overlapping interactions 6.21 28.24 22.94 7.24 9.21 22.78 % Overlapping proteins 12.08 37.75 29.17 22.03 22.17 27.03
% Ratio (ovrlp. Int. / ovrlp. Prot.) 51.41 74.80 78.66 32.87 41.55 84.28 Table 2: Interaction data set cross comparison.
(*) Binary interactions are derived from the co-purified complex only as a set of bait-prey pairs, according to the “spoke model”.
($)The “All” set differs for every single dataset and it is generated by combining all known yeast interactions and excluding only the set under analysis.
SH3 mediated network comparison
Focusing on the comparison of SH3 domain connectivity, we can group interaction networks according to detection method (see Table 3) and generate SH3 mediated subnetworks, by assuming that SH3 containing proteins interact exclusively via this domain.
Dataset Dataset size Number of SH3 containing proteins Inferred SH3 mediated network Average interactions per protein in the original dataset Average interactions per protein in the inferred SH3 mediated network Average interactions per SH3 containing protein in the inferred network Complex CoIp Gavin + Ho interactions 6188 94 proteins 2225 20 90 2.78 1.04 4.70 Two hybrid Ito + Uetz interactions 5197 141 proteins 3535 17 150 1.47 0.94 8.29 Any method
Small scale data
interactions 956 109 proteins 794 18 85 1.20 1.28 6.06 Two hybrid Tong et al. interactions 231 231 proteins 144 27 144 1.60 1.60 8.56 PepSpot Landgraft et al. interactions 180 180 proteins 111 8 111 1.62 1.62 22.50 Table 3 : Network comparison of inferred SH3 mediated interactions.
In each dataset we identify all the proteins containing an SH3 domain, and retrieved their interaction partners. The subnetworks derived from the first three sets are inferred to be mediated by SH3 whereas the last two set are experimentally determined using exclusively the SH3 domains as probe.
Then we calculate the average connectivity of all proteins in each subnetwork and compare it with the corresponding value in the original network. We expect these two values to be similar for each dataset. This would mean that the analysis of SH3 domain containing proteins do not affect each method ability to detect interaction. Finally we calculate the average number of interactions per SH3 domain inferred or detected using each experimental method. These numbers allow the comparison of how many partners are identified on average for an SH3 domain by the single methods.
Although this is an inference, since only a fraction of the interactions in the fourth column are mediated directly by SH3 domains, it is nevertheless surprising to see how far SH3 mediated interactions seem to be under-detected by complex purification approach. The average number of interactions per protein drops by more than 50% when the SH3 subnetwork is considered and the number of inferred interactions per SH3 is also much lower than in any other method. This is consistent with the fact that SH3 mediated interactions are on average weak interactions, less likely to be detected by coimmunoprecipitation (assay requiring several washing steps), than by solid phase peptide arrays or two hybrid assay. It is also evident that the testing of all possible partner peptides, regardless of their physiological co-occurrence with the probe domain, leads to a very high number of PepSpot interactions per SH3, and that some of those are likely to be false positive.
Although the PepSpot proteomic approach we have presented is an in vitro strategy limited to interactions in which one of the partners can be reduced to a relatively short peptide , it has a series of interesting features. First, genomic sequence information can be fully exploited in the array format to equally display a high number of possible partners. Second, the experimental output provides topological information and includes an estimate of the kinetic dissociation constant. Third, interactions that depend on peptide modification can be easily studied. Finally, the identified target peptide can be used as a template to develop tighter binding competitors.
In fact the major advantage of the PepSpot method is the easy modulation of the protein binding screening to different level of granularity (see Figure ?) :
1. Proteome scanning (used for yeast SH3 mediated interaction screening). All the peptides of a proteome that match the binding motif
are synthesized and tested for their ability to undergo interaction with probe proteins.
2. Ligand scanning. All the overlapping peptides derived from a known ligand are tested for their ability to interact with the ligand partner to identify the best binding region.
3. Peptide mutagenesis scanning. All possible mutations of a single binding peptide are synthesized, replacing in each position the wild type amino acid with all other possible residues, leaving the rest of the sequence unchanged. The results of this PepSpot variation give indication of position specific information about the residues that are favourable to binding. As we will explain in the following section, such data can be used to estimate the binding ability of any query peptide, and thus predict potential interaction partners for the probe protein.
14-3-3 partner prediction based on PepSpot mutagenesis
14-3-3 containing proteinsIn the remaining parts of this work our study case are 14-3-3 proteins in yeast. The 14-3-3 is a family of highly conserved proteins found in almost all eukaryotic organisms. In mammalia seven 14-3-3 encoding genes were found and their study revealed that they are functionally related to crucial cellular processes, such as signal transduction, metabolism, cell cycle, apoptosis and malignant transformation (Mackintosh, 2004). 14-3-3 regulates the function of their partners by binding to them. This may lead to alteration of the ligand catalytic activity, to interference with molecular interactions with other partners, or to regulation of the bound protein subcellular localisation (Yaffe & Elia , 2001 ). Interaction screenings in mammalia show that 14-3-3 isoforms have hundreds of partners belonging to very different functional classes (Rubio et al., 2004 Jin et al., 2004 Aitken et
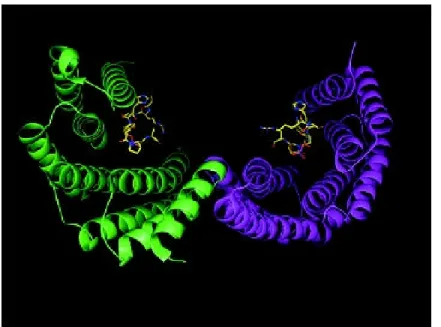
Figure 4 : 14-3-3 pocket showing a phosphopetide ligand bound to each monomeric subunit.
Typically 14-3-3 domain proteins recognize phosphopeptides where serine or threonine is phosphorylated. The X-ray analysis of 2 mammalian isoforms (Liu et al., 1995 Xiao et al., 1995) reveal the dimeric structure of 14-3-3 containing proteins forming a large cup shaped pocket able to bind two peptides in an extended conformation (see Figure 4). The screening of degenerated phosphoserine peptide libraries against human and yeast 14-3-3 (Yaffe et al., 1997) lead to the identification of two 14-3-3 binding motifs (RSxpSxP and RxxxpSxP), while no specie nor isoform specificity was observed. However, a discrete number of interactors have significantly divergent binding sites.
Despite the large number of studies concerning 14-3-3 proteins in higher eukaryotes, little is known about their function in S. cerevisae. In yeast, two 14-3-3 proteins have been characterized, encoded by the BMH1 and BMH2 genes. They are more than 90% and 60% identical respectively to the mammalian epsilon isoform. The single genetic disruption of BMH1 or BMH2 has little effect on cellular growth, while the double mutant is not
viable (Bruckmann et al., 2004). These two proteins seem to be functionally redundant but essential for normal yeast growth.
PepSpot mutagenesis of 14-3-3 binding peptides
To investigate BMH1 and BMH2 binding specificity, we choose to mutagenize two peptides: IPAWLpSLPS and SRIPFpSERK, known for binding 14-3-3 protein, which match only partially the motifs (RSxpSxP and RxxxpSxP).
At a first glance, by analysing the membranes (see Figure 5) we can see that BHM1 and BMH2 have almost identical recognition specificity. According with the binding motifs proposed by Yaffe, positive charges (R, K or H residues) at the peptide N-terminus increase the binding, while negative charges in the same position considerably reduce it. In all membranes position -1 and +1 are the more restrictive in terms of allowed residues 1.
Position +2 has different preferences depending on the mutagenised peptide. While in the case of IPAWLpSLPS position +2 is quite tolerant, with a slight preference for the wild type proline, in the case of SRIPFpSERK only the wild type arginine is allowed. This points out the influence of the sequence context surrounding the single residues. Although according to Yaffe and collaborators proline in position +2 should enhance the binding, in the context of the SRIPFpSERK sequence it diminishes it.
1
In our numbering the phosphorylated serine positions, is positive 0, while residues at the C-terminus or the N-C-terminus side have positive or negative numbers respectively.
Figure 5 : 14-3-3 binding peptides mutagenesis. In the first column of each membrane the wild type peptide is spotted for every row. In the serine column, amino acids are replaced with unphosphorylated serine: this explains the lack of signal on the central phosphoserine row. The spot triplets in the left upper corners are controls of the colorimetric detection.
Implementation of a prediction tool based on PepSpot mutagenesis
Although there is clear evidence that the results of mutagenesis experiments are not independent from the template peptide , we use the intensity of the colorimetric reaction measured in Boehringer Light Unit (BLU) to build a matrix describing each amino acid preference at each position within a generic phosphoserine centred motif (xxxxxpSxxx). To calculate each element of this matrix we use the following formula :
Aff(pos,aa)=BLU(pos,aa)/ (ΣBLU(pos)+ BLUwildtype(pos))
These figures are related to the preference for each specific amino acids relative to all other possible amino acids at any same position. The results obtained from the different mutagenesis experiments are combined by calculating an average matrix with the intent of alleviating the bias of any
specific peptide context. Finally, the 14-3-3 position specific matrix that we obtain (see Table 3) stores relative preference values, ranging from 18% to 0.06% (proline in position +1). The value for the phosphoserine in position 0 is arbitrarily set to 100%. -5 -4 -3 -2 -1 0 1 2 3 A 3.99 5.09 5.08 9.2 3.86 0 7.97 3.29 6.69 D 0.65 1.97 1.3 0.7 0.84 0 5.09 1.49 1.34 E 0.55 1.37 1.12 1.26 1.87 0 8.16 1.33 1.2 F 9.93 9.07 8.6 9.47 10.2 0 11.3 7.68 10.3 G 4.55 3.87 5.5 4.75 1.47 0 1.11 4.76 2.93 H 3.31 3.97 4.62 5.08 3.49 0 2.84 4.12 7.03 I 5.2 5.26 4.92 4.92 2.43 0 2.8 2.16 6.8 K 7.51 5.2 6.21 1.06 6.11 0 1.38 2.11 4.02 L 6.11 3.71 4.68 5.38 4.52 0 18.4 2.44 7.11 M 3.42 4.25 4.91 2.96 2.64 0 1.62 2.07 2.92 N 3.39 3.29 4.15 3.48 2.3 0 1.69 2.26 2.58 P 4.15 4.66 4 5.2 0.91 0 0.06 18.1 3.23 Q 5.4 4.17 3.43 1.97 4.16 0 3.18 2.3 3.05 R 11.8 11.0 9.33 6.53 14.4 0 1.47 18.4 10.9 S 3.77 3.09 6.54 10.2 3.44 100 4.69 2.51 4.78 T 4.12 3.6 4.08 5.84 2.58 0 5.01 2.55 5.4 V 6.79 5.4 4.57 5.03 2.73 0 4.9 2.78 7.57 W 7.68 5.49 5.7 5.18 3.44 0 6.37 2.22 2.33 Y 3.66 3.23 3.31 4.09 3.19 0 3.02 2.66 2.26 Table 3 : 14-3-3 position specific matrix. Higher scores are highlighted in green, lower in red.
In order to implement a prediction tool based on this data that could rank any query peptide for its ability to bind 14-3-3 yeast domains, we follow a combined approach. Combining the strategies of two major motif public resources, SCANSITE (Obenauer et al., 2003) and ELM (Punterwoll et al., 2003), we used the 14-3-3 preference matrix as a position specific scoring matrix (PSSM), but we also to derived a regular expression that could filter out all the peptides containing ill tolerated residues at any specific position. SCANSITE and ELM services will be presented in detail in the next section while a general description of PSSM and regular expressions is given in the materials and methods (see ‘Protein functional patterns’ section). By
analysing the score distribution in our matrix (see Graph 1), we can arbitrarily distinguish three major classes. The “forbidden” residues of each position have a score below 2%, the “neutral” residues range from 2% to 10% and the “preferred” amino acids score above 10%. By using the scores below 2%, we designed a regular expression representing the exclusion of specific residues at each position (coded by the symbol [^]) and setting the requirement of a serine at position 0. The resulting regular expression is:
[^DE][^DE][^DE][^DEKQ][^DEPG]S[^RPKGINMQ][^DE][^DE] Position -5 -4 -3 -2 -1 0 +1 +2 +3 We first apply this regular expression and then we rank the matching peptides by applying the position specific scoring matrix.
Graph 1 : Analysis of the position specific matrix values. Note that position 0 is not reported because it has to be a phosphoserine.
Our approach has the twofold advantage of overcoming the strict rules imposed by a stringent regular expression designed to identify the best binding motif, by setting as mandatory the preferred residues, while at the same time restricting the number of false hits by using a “softer” filtering regular expression. This flexibility suits the case of 14-3-3 peptide recognition, since, for instance, a positive charge is required at the amino terminus of the ligand peptide, but apparently there is no absolute
Relative affinity distribution per position
0 2 4 6 8 10 12 14 16 18 20 A D E F G H I K L M N P Q R S T V W Y Amino Acid % Relative Affinity position -5 position -4 position -3 position -2 position -1 position +1 position +2 position +3
requirement at any specific position. Thus, by using a PSSM, the best ranking ligand peptides will result from any combination of high scoring residues alternated with tolerated residues. Whereas peptides having residues that in the mutagenesis experiments are shown to compromise drastically the binding are discarded by the application of the regular expression.
Benchmark of the prediction tool versus experimental results
In order to assess the validity of our tool to infer 14-3-3 target peptides, we perform a blind test with new experimental results. For this purpose we carry out a PepSpot scanning on the fraction of the yeast proteome experimentally proven to contain phospho-residues. In a recent work, Ficarro and co-workers describe a methodology to characterize phosphoproteins from cell lysate, using immobilized metal affinity chromatography (IMAC) to purify phosphopeptides and nanoflow HPLC/electrospray ionization mass spectrometry to identify the phosphopeptides (Ficarro et al., 2002). They report the sequence of 216 yeast peptides containing a phosphorylated serine, threonine or tyrosine: 60 of these are phosphorylated in the single position, 145 in two positions and 11 in three. Using these results, we therefore synthesise 287 phosphopeptides on cellulose membrane and assay their ability to bind BMH1 and BMH2 (see Figure 6). Peptides that are found to have multiple phosphorylation sites in vivo are synthesise both as single phosphorylated peptides, as well as peptides containing phosphorylated residues at two and three positions.
Figure 6 : Yeast phosphoproteome scanning against BMH1 and BMH2 probe.
Also in this experiment, if we compare the quantitative results of BMH1 and BMH2, we observe an almost identical pattern; we establish an arbitrary threshold of BLU units to separate good ligand from non-ligand. In order to normalize the results of the two membranes (the BMH1 membrane has visibly a stronger signal than the BMH2 one) we set the cut-off value as the 10% of the maximum BLU (see Graph 2), corresponding to BLU values of 22.000 and 17.000 respectively in BMH1 and BMH2 phosphoproteome scanning respectively. Out of 287 peptides known to be phosphorylated in
vivo, 26 had a score higher than the threshold and were therefore classified
Graph 2 : Analysis of phosphospetides BLUs when screened against the 14-3-3 domain of BMH1 and BHM2. T he two 14-3-3 domains show identical specificity, thus we set a cut off value corresponding to 10% of each set maximum BLU value.
We next tested our prediction tool against the same set of 287 peptides by first filtering with the regular expression, and then assigning a score to each peptide by summing the values associated to each residue at each position of the 14-3-3 position specific scoring matrix (the PSSM score). The prediction results are displayed in two table s: in the first (see Table 4) we display the 26 positive peptides experimentally proven to be high affinity ligands. In the second table (see Table 5) we show the top 26 peptides according to their PSSM score. 206 out of the 287 peptides do not match the sequence requirements summarized in the regular expression. As reported in table 4, only one of the positive peptides is filtered out erroneously , whereas potential false positives are appropriately excluded from the prediction (see also Table 5). As it is also evident in Table 4, the sequences of the positive peptides have no striking regularities that could be described by a simple regular expression representing the binding motif. In most cases, the 14-3-3 PSSM succeeded in associating high scores to the experimentally proven ligand peptides. Prediction rank PSSM score Regular
expression Peptide ORF
Average BLU % BLU max Experimental rank
24 0.509 MATCH RMAHRSsLSSLSN YCR023C 152919 100.00 1
Distribution of intesity peptides score
0 10 20 30 40 50 60 70 80 90 100 Peptide Instances % of maximum BLU average score BMH1 score BMH2 score
11 0.534 MATCH ARFSRRsDSGVHS reg1 141543.5 92.56 2
2 0.662 MATCH RKRRASsLKA--- rps6a 131403 85.93 3
5 0.577 MATCH RRLSSLsEFNDPF nth1 98596.5 64.48 4
3 0.634 MATCH PKFRRAsLNSKTI yak1 96201 62.91 5
13 0.530 MATCH KARRSMsLLGYRA myo3 91887 60.09 6
7 0.551 MATCH ERRSMVsSPNRYV spc98 84130.5 55.02 7
91 0.367 MATCH RTSSSMsVGNNKK YMR261C 84062 54.97 8
20 0.502 MATCH SQSRSRsSVMFKS sra1 69896.5 45.71 9
19 0.503 MATCH HRSSLSsLSNQRC YCR023C 68319.5 44.68 10
14 0.527 MATCH LSSKSHsVPALNT YNL321W 58950 38.55 11
60 0.414 MATCH ALKVRTsATFRLP rpl25 46136.5 30.17 12
- - - SKVYARsVYDSRG eno1 43722.5 28.59 13
16 0.520 MATCH SPLRARsATPTLQ blm3 37490.5 24.52 14
8 0.538 MATCH KVARPLsVPGSPR gsy2 36775.5 24.05 15
82 0.378 MATCH RQKSTSsYSSGGR akl1 35210 23.03 16
12 0.531 MATCH GTFRRRsSVFENI syg1 31427 20.55 17
9 0.536 MATCH RQRRLSsLSAFND nth1 30260.5 19.79 18
4 0.581 MATCH GRKRSSsSVSLKA gpd1 29624 19.37 19
17 0.510 MATCH SRSRSHsFYKGGH YGL181W 28791.5 18.83 20
10 0.534 MATCH TFRRRSsVFANIS syg1 25922.5 16.95 21
24 0.472 MATCH GHSRASsFARTLA YML072C 24157.5 15.80 22
26 0.451 MATCH SMGRTAsALSRTR YGR138C 24084.5 15.75 23
25 0.458 MATCH QRRRsSYAF YCR077C 22585.5 14.77 24
16 0.522 MATCH KIARPLsVPGSPK gsy1 17672 11.56 25
62 0.411 MATCH RTATPQsLQGSNK vps13 17524.5 11.46 26 Table 4: Prediction results sorted according to the experimental rank. We report the 26 highest affinity peptides that have BLUs above the cut off threshold. In the first three columns we report in bold the prediction for each of these positive peptides. The peptides underlined in italics are the 4 false negatives wrongly predicted as low affinity ligands, and have a
prediction rank below the 26th position.
PSSM rank
PSSM score
Regular
expression Peptide ORF
Average BLU % BLU max Experimental rank
1 0.717 MATCH YRRRKSsLVVPPA yak1 1927.5 1.26 45
3 0.634 MATCH PKFRRAsLNSKTI yak1 96201 62.91 5
0.609 VRKMSFsGYSPKP YOR175C 5886.5 3.85 35
4 0.581 MATCH GRKRSSsSVSLKA gpd1 29624 19.37 19
0.580 PRKRAAsIRARVK rpl3 12310.5 8.05 29
5 0.577 MATCH RRLSSLsEFNDPF nth1 98596.5 64.48 4
6 0.574 MATCH IRKRRAsSLKA-- rps6a 1364 0.89 49
0.555 RKNRSPsPPPVYD YLR116W 59.5 0.04 83
7 0.551 MATCH ERRSMVsSPNRYV spc98 84130.5 55.02 7
8 0.538 MATCH KVARPLsVPGSPR gsy2 36775.5 24.05 15
9 0.536 MATCH RQRRLSsLSAFND nth1 30260.5 19.79 18
10 0.534 MATCH TFRRRSsVFANIS syg1 25922.5 16.95 21
11 0.534 MATCH ARFSRRsDSGVHS reg1 141543.5 92.56 2
12 0.531 MATCH GTFRRRsSVFENI syg1 31427 20.55 17
13 0.530 MATCH KARRSMsLLGYRA myo3 91887 60.09 6
14 0.527 MATCH LSSKSHsVPALNT YNL321W 58950 38.55 11
0.525 PIRRSDsAVSIVH YOL059W 21 0.01 97
15 0.522 MATCH KIARPLsVPGSPK gsy1 17672 11.56 25
16 0.520 MATCH SPLRARsATPTLQ blm3 37490.5 24.52 14
17 0.510 MATCH SRSRSHsFYKGGH YGL181W 28791.5 18.83 20
18 0.509 MATCH RMAHRSsLSSLSN YCR023C 152919 100.00 1
19 0.503 MATCH HRSSLSsLSNQRC YCR023C 68319.5 44.68 10
20 0.502 MATCH SQSRSRsSVMFKS sra1 69896.5 45.71 9
21 0.499 MATCH AYRRRKsSLVVPP yak1 1712.5 1.12 47
22 0.481 MATCH VMKRSAsYTGAKV YDR074W 12801 8.37 28 23 0.477 MATCH KKSTPVsTPSKEK YHR052W 3548 2.32 41
24 0.472 MATCH GHSRASsFARTLA YMl072C 24157.5 15.80 22
25 0.458 MATCH QRRRsSYAF pat1 22585.5 14.77 24
26 0.451 MATCH SMGRTAsALSRTR YGR138C 24084.5 15.75 23
Table 5 : Prediction results sorted according to the 14-3-3 PSSM. True posit ives are in bold; the only 5 false positives are underlined in italics. Only 4 peptides that have high PSSM score and do not match the regular expression are shown in the table, but these are in total 15 peptides that would rank within the first 26positions if they were not filtered out by the regular expression.
The proposed prediction tool recovers 21 true positives out of the 26 experimentally proven ligand peptides. If we compare the experimental and prediction rank with a cut off on the 26th position, we see that 4 predicted ligand peptides are false negatives (see in Table 4 the experimental positives peptides that are predicted to have low affinity) and 5 are false positives (see
in Table 5 the experimental low affinity peptides that are predicted to be good ligand).
Comparison of our predictions with SCANSITE and ELM
In order to compare the performance of our predictions with SCANSITE1 and ELM2 predictions , we carried out identical blind test on the
same dataset with these two specific tools.
SCANSITE (Obenauer et al., 2003) is based on PSSM derived from experimental data, determined either by phage display or using a degenerated peptide library. Phage display (Scott & Smith., 1990) is a method based on cloning complex peptide libraries in phage vectors expressing the exogenous sequence on their capsides. This phage population then is incubated with the probe domain fixed on a solid support, and the clones expressing ligand peptides are retained. Sequencing the genome of the clones that are selected after this panning procedure leads to the identification of the binding peptide sequences. Similarly , in peptide library experiments (Yaffe & Cantley 2000), degenerate peptides with a single fixed central residue are incubated with a given probe domain. Domain binding peptides are isolated and sequenced as a mixture by Edman degradation. When peptides are sequenced in this manner, one obtains the relative enrichment of each amino acid occurring at each position. Both methods provide sequence information that is normalized to produce a scoring matrix which quantitatively indicates the preference of specific amino acids at each position. Matrices for each analyzed domain can be queried on the SCANSITE public site to scan entire proteomes or a single protein sequence and the server returns high ranking motifs matches. The predictions have three possible levels of stringency (“high”, ”medium”, “low”), based on a comparative scoring approach. A given match is considered high stringency when its score falls within the top 0.2% of all scores calculated when the given motif matrix is applied to a reference set of protein, consisting of all vertebrate proteins in the UniProt database (Bairoch et al., 2005) . The medium and low stringencies are similarly chosen at 1% and 5%
1http://scansite.mit.edu 2