i
U
U
n
n
i
i
v
v
e
e
r
r
s
s
i
i
t
t
à
à
d
d
e
e
g
g
l
l
i
i
s
s
t
t
u
u
d
d
i
i
d
d
i
i
P
P
i
i
s
s
a
a
S
Sc
cu
uo
ol
la
a
d
di
i
D
D
ot
o
t
t
t
or
o
ra
at
to
o
d
di
i
F
Fi
is
si
io
op
pa
at
to
ol
lo
og
gi
ia
a
C
Cl
li
in
ni
ic
ca
a
e
e
S
Sc
ci
ie
en
nz
ze
e
d
de
el
l
F
F
ar
a
rm
ma
ac
co
o
(Diretore Chiar.mo Prof. Paolo Miccoli)
Programma di ricerca: Fisiopatologia Medica e Farmacologia
(Presidente Chiar.mo Prof. Eleuterio Ferrannini)
Titolo:
B
B
i
i
l
l
i
i
o
o
p
p
a
a
n
n
c
c
r
r
e
e
a
a
t
t
i
i
c
c
d
d
i
i
v
v
e
e
r
r
s
s
i
i
o
o
n
n
i
i
n
n
p
p
a
a
t
t
i
i
e
e
n
n
t
t
s
s
w
w
i
i
t
t
h
h
t
t
y
y
p
p
e
e
2
2
d
d
i
i
a
a
b
b
e
e
t
t
e
e
s
s
a
a
n
n
d
d
m
m
o
o
d
d
e
e
r
r
a
a
t
t
e
e
o
o
b
b
e
e
s
s
i
i
t
t
y
y
:
:
i
i
m
m
p
p
a
a
c
c
t
t
a
a
n
n
d
d
m
m
e
e
c
c
h
h
a
a
n
n
i
i
s
s
m
m
s
s
.
.
Dottorando
Brenno Dominguez AstiarragaTutor
Chiar.mo Prof. Eleuterio Ferrannini
ii
Dedico essa tese à Fabiana, minha eterna namorada, que me reconheceu ao nosso primeiro
encontro, que me apoia, me segue e me ama. Dedico à minha filha Laura que com apenas sete aninhos me
disse: "vou porque è importante para você", abriu mão da sua vidinha para me acompanhar. Dedico também
a Sofia que com sua alegria e amor ajuda a manter unida a nossa família e me diz sempre: " você é o
melhor papai do mundo!".
Dedico aos meus pais, a tudo que fizeram por mim, ao amor que me deram e que me ensinaram a
dar!
Por fim, dedico a todas as pessoas especiais que cruzaram meu caminho!
"Enquanto você se esforça pra ser, um sujeito normal e fazer tudo igual
Eu do meu lado aprendendo a ser louco, um Maluco total, na loucura real
Controlando a minha maluquez, misturada com minha lucidez
Vou ficar, ficar com certeza, Maluco beleza!"
Raul Seixas
iii
Ringraziamenti
Prima di tutto vorrei ringraziare il professor Ferrannini per avermi dato la possibilità di fare parte di questo bellissimo gruppo.
Durante i miei anni di lavoro nel campo della ricerca scientifica ho avuto la fortuna di trovare diverse persone speciali. Da loro ho ricevuto appoggio, fiducia e conoscenza. Mi hanno guidato in questo mestieri che ho scelto. Tra queste persone vorrei ringraziare in particolare la Dottoressa Elza
Muscelli con cui ho il piacere di lavorare per oltre 10 anni.
Molti altri sono stati importanti e mi hanno accompagnato nel mio viaggio. Per ognuno potrei nominare una qualità, purtroppo questa non è la sede giusta. Vorrei ringraziare l'amicizia, la fiducia,
iv
Index
Abstract 7
1. Introduction 8
1.1. Epidemiology of Type 2 Diabetes Mellitus 8
1.2. Natural History of Type 2 Diabetes Mellitus 9
1.3. Obese Type 2 Diabetes Mellitus 11
1.4. Nonobese Type 2 Diabetes Mellitus 12
1.5. Pathogenesis of Type 2 Diabetes Mellitus 14
1.5.1. Insulin Resistance 15
1.5.2. Insulin secretion 19
2. Bariatric surgery 20
2.1. Diabetes resolution and improvement after bariatric surgery 21 2.2. Mechanisms of diabetes remission after gastrointestinal
surgery 22
2.2.1. Weight loss effects 22
2.2.2. Effects of BPD on insulin sensitivity 23
2.2.3. Effects of BPD on β-cell function 25
2.3. The entero-insular axis 27
3. Protocol End-points 28
4. Methods 30
4.1. Study Population 30
4.2. Subjects enrolment 31
4.3. Oral Glucose Tolerance test (OGTT) 32
4.4. Mixed Meal Tolerance (MMT) 32
4.5. Euglycaemic hyperinsulinaemic clamp 33
4.6. Surgery 34
4.7. Analytical procedures 35
4.8. Insulin Secretion 36
4.9. Data and Statistical Analysis 37
4.10. Ethical Considerations 38
5. Results 38
5.1. Anthropometrical and fasting data 38
5.2. Oral glucose tolerance test data 39
v
5.4. β-cell function during MMT 41
5.5. Euglycaemic hyperinsulinaemic clamp data 41
6. Discussion 42
7. Publications 48
8. Appendices - figures and tables 84
9. References 103
APPENDICES LIST OF FIGURES
Fig. 1: Schematic protocol representation. 31
Fig. 2: Schematic representation of oral glucose tolerance test -
OGTT 32
Fig. 3: Schematic representation of mixed meal tolerance test - MMT 33 Fig. 4: Schematic representation of euglycaemic hyperinsulinaemic
clamp - CLAMP 34
Fig. 5: Schematic representation of modified BPD for non-morbidly
obese T2DM subjects. 35
Fig 6. Anthropometric and biochemical characteristics of T2DM
subjects before and after BPD. 84
Fig 7. Changes in plasma glucose concentration during OGTT. 85 Fig 8. Metabolic effects of BPD on plasma glucose, insulin and
C-Peptide. 86
Fig 9. Metabolic effects of BPD on plasma glucagon, GLP-1 and
NEFA. 87
Fig 10. Changes in insulin secretion rate after BPD. 88
Fig 11. Effect of BPD on β-cell function. 89
Fig 12. Changes in β-cell glucose sensitivity and rate sensitivity after
BPD. 90
Fig 13. Changes in insulin sensitivity after BPD 91
Fig 14. Changes in insulin action after BPD 92
vi
LIST OF TABLES
Table 1. Anthropometric and biochemical characteristics. 94 Table 2. Metabolic effects of meal stimulation on glucose
metabolism, insulin and glucagon secretion and incretins. 95
Table 3: β-cell function parameters 96
Table 4: Euglycaemic hyperinsulinaemic clamp data. 97
Table 5. Anthropometric and biochemical characteristics divided by
remitters and non remitters. 98
Table 6. Lipid profile divided by remitters and non remitters. 99 Table 7. Metabolic effects of meal stimulation on glucose
metabolism, insulin and glucagon secretion and incretins divided by remitters and non-remitters.
100
Table 8: β-cell function parameters divided by remitters and non
remitters. 101
Table 9: Euglycaemic hyperinsulinaemic clamp data by remitters
7
Abstract
Context Diabetes remission is frequent after biliopancreatic diversion (BPD) in morbidly
obese patients with type 2 diabetes (T2DM). Data, mechanisms, and clinical indications in nonobese T2DM patients are scanty.
Objective To assess remission and investigate insulin sensitivity and ß-cell function after
BPD in non-morbidly obese patients with long-standing T2DM.
Design, setting and patients Clinical research study comparing 15 T2DM patients (age
551 years, duration 16±2 years, BMI=28.3±0.6 kg/m2, HbA1c=8.61.3%) with 15 gender-, age-, and BMI-matched nondiabetic controls. Before surgery, and 2 months and one year later, a 3-hour OGTT, a 5-hour mixed meal test, and a 3-hour euglycemic clamp were performed.
Intervention BPD (gastric resection, distal jejunum anastomosed to remaining stomach,
biliopancreatic tract anastomosed to ileum 75cm from the ileocecal valve).
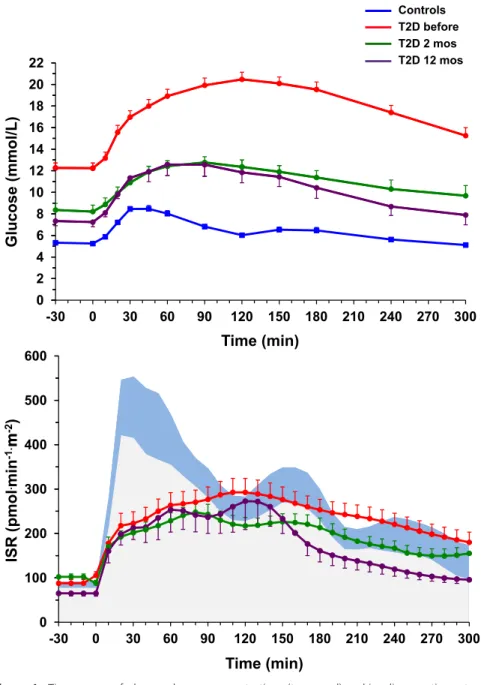
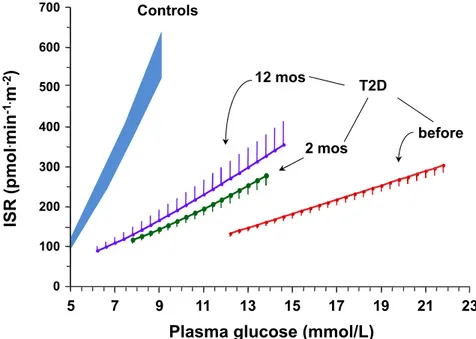
Results Glycemia improved in all patients, but remission (HbA1c<6.5% and normal OGTT) occurred in 6/15. Insulin resistance (19.8±0.8 µmol.min-1.kgffm-1, p<0.001 vs 40.9±5.3 of controls) resolved already at 2 months (34.2±2.8) and was sustained at one year (34.7±1.6), although insulin-mediated suppression of endogenous glucose production remained impaired. In contrast, ß-cell glucose sensitivity (19[12] pmol.min-1.m-2.mM-1 vs 96[73] of controls,
p<0.0001) rose (p=0.02) only to 31[26] at one year, and was lower in non-remitters (16[18]) than remitters (46[33]).
Conclusions In nonobese patients with long-standing T2DM, BPD improves metabolic
control but induces remission in only ~30% of patients. Peripheral insulin sensitivity is restored early after surgery, and similarly in remitters and non-remitters, indicating a weight-independent effect of the operation. The initial extent of ß-cell incompetence is the main predictor of the metabolic outcome.
8
1. INTRODUCTION
1.1. Epidemiology of Type 2 Diabetes Mellitus
Type 2 diabetes mellitus (T2DM) is known a long time but still today is not completely understood. Affecting million of individuals T2DM is responsible, each year, for about 5% of all deaths worldwide. Diabetes results from the interaction of genetic predisposition and environmental factors (Stumvoll, 2005). Several genetic defects are involved in alteration of glucose metabolism. Environmental factors could be responsible by enhance or not these genetic predispositions leading to T2DM (Modan, 1986).
According to the International Diabetes Federation (IDF) the number of people with type 2 diabetes is rising rapidly worldwide. It is associated with the economic development, ageing populations, increasing urbanization, dietary changes, reduced physical activity and changes in other lifestyle patterns. Diabetes prevalence in the population is increasing around the world: 366 million of persons were diagnosed as diabetic in 2011 and by 2030 this number will rise to 552 million (IDF Atlas, 2011).
There are three main types of diabetes: insulin dependent diabetes mellitus (IDDM) or type 1 diabetes (T1DM), non insulin dependent diabetes mellitus (NIDDM) or T2DM and gestational diabetes (GDM). Others types are also recognized and are resulting of malnutrition and therefore named as related diabetes mellitus (MRDM) or as consequence of certain conditions or syndromes and known as secondary diabetes (Bennett, 1992).
Type 2 diabetes is the most common type of diabetes. Results from an impairment of normal glucose homeostasis that progresses and becomes a chronic disease exhibiting the hyperglycaemia and glucose intolerance as principal symptoms (DeFronzo, 1992). Impairment in glucose metabolism is lead to the incapacity of the body in produce enough insulin to maintain euglycaemia or to responding to its effects, generating an acute increasing and chronically higher concentration of glucose and insulin in the blood.
9
T2DM usually occurs in adults, but actually is also seen in children and adolescents, as result of children obesity and unhealthy dietary behaviour. People who develops T2DM (90%), are usually middle-aged (45-64 years), not elderly (>65 years), 80% live in low and middle-income countries. Type 2 diabetes mellitus usually occurs after that the subject have progressed from the normal glucose tolerance (NGT) state to impaired glucose tolerance (IGT) and finally, to T2DM. Because symptoms may take years to appear or be recognized, meanwhile body is progressively damaged by the excess of blood glucose (Stumvoll, 2005).
Diagnosis of T2DM is based on measurements of fasting plasma glycaemia (FPG) and glycosilated haemoglobin (HbA1c%) but oral glucose tolerance test (OGTT) is the standard method to diagnose incipient diabetes. When diabetes becomes chronic, derived hyperglycaemia can leads to serious damage to many of the body's systems. Bring to debilitating micro and macrovascular diseases as nephropathy, retinopathy and neuropathy.
Cardiovascular complications constitute the major cause of morbidity and mortality in patients with diabetes. Intensive glycaemic control can prevents the development and progression of microvascular complications in patients with type 1 or type 2 diabetes (Brown, 2010).
1.2. Natural History of Type 2 Diabetes Mellitus
In subjects with normal tolerance to glucose, plasma glucose concentrations are maintained within a narrow range as result of simultaneous release of glucose into circulation and uptake of glucose from plasma by the cells stimulated by insulin hormone (DeFronzo, 1992). Metabolism of glucose is an essential step to sustain life by generation of energy to the body and to avoid long glucose contact with systems that could be damaged. Glucose flux through from intestine and liver to bloodstream and finely into the cells is the initial condition to generate energy and store energy (Tripathy, 2010). Defects in one or more of these systems could cause impairment in sensitization of tissues by glucose, insulin secretion and insulin
10
stimulated glucose uptake originating hyperglycaemia and disequilibrium in the glucose homeostasis (Leahy, 2005). Because in T2DM the body exhibit impaired ability to respond to insulin (DeFronzo, 1992), the pancreas must to increase its secretion of insulin to offset the insulin resistance maintaining the normal glucose tolerance. The progression from NGT to impaired glucose tolerance (IGT) to T2DM is characterized by progressive hyperinsulinaemia. ß-cell dysfunction starts when pancreatic ß-cells fails to maintain hyperinsulinaemia necessary to cope insulin resistance leading to the development of IGT and eventually overt T2DM (Kan, 1993). Insulin resistance is observed in skeletal muscle, liver and adipocytes (Cusi, 2010). The relative contribution of defects in insulin action and ß-cell function for the pathogenesis of T2DM remains still unclear (Tripathy, 2010).
To avoid the progression from NGT to IGT and finally to T2DM, -cell must be able to regulate its secretion of insulin hormone in precise doses to cope insulin resistance presented by peripheral tissues. In fact, only insulin resistance is not sufficient to cause loss of homeostasis in glucose metabolism if -cell function is preserved enough to offset insulin resistance. This is commonly observed in obese subjects with NGT. In whom insulin output can be 10-fold higher than in lean individuals and returns to normal levels after weight-loss. However, -cell dysfunction is necessary and sufficient to produce hyperglycaemia.
Whether obese insulin resistant subjects, shown an increase in -cell mass. Decrease by 80-90% in -cell mass is required before sufficient insulinopenia develops to cause overt T2DM (Ferrannini, 2010). It seems that other factors in addition to -cell lost must be responsible for the impairment of insulin secretion. Many acquired factors also play a role in the pathogenesis of the disease and information from DNA transcript: protein and metabolite profiles may better capture the genetic influences on metabolism than studying single genes.
11
1.3. Obese Type 2 Diabetes Mellitus
Most subjects with T2DM are obese. The common occurrence of obesity in T2DM, and the observation that obesity precedes the deterioration of glucose homeostasis, lead to the hypothesis that, at least for obese subjects, obesity was the risk condition resulting in T2DM (DeFronzo, 1992).
Prospective studies among Pima Indians demonstrate that obesity precedes the development of T2DM (Tulloch-Reid, 2003). Obesity therefore must be viewed as a risk factor for the development of the disease rather than a consequence, or complication, of the diabetic condition. The increase in the prevalence of obesity appears to be associated with an increased prevalence of risk factors for cardiovascular disease and T2DM, including hypertension and reduced glucose tolerance (Meisinger, 2006). Duration of obesity is an additional risk factor for the development of T2DM. Although obesity is a major risk factor for T2DM in Pima Indians, the presence of diabetes in one or both parents has been shown to be a major dependent risk factor (Mallikarjun, 2009). Obese, adult Pima offspring of a diabetic parent are at much greater risk of developing T2DM than the obese, adult offspring of two non-diabetic parents. Obesity was formerly believed to be a risk factor for T2DM as a result of being associated with insulin resistance. Prando et al. have shown that, on average, obese subjects are more insulin resistant than lean subjects (Prando, 1998).
Diabetes risk is determined not only by the degree of obesity (Eckel, 2011). The adiposity in T2DM patients is predominantly located around the centre of the body, in the abdomen, subscapular and triceps regions. Increased upper body fat, including visceral adiposity, as reflected in increased abdominal girth or waist-to-hip ratio, is associated with insulin resistance (Kahn, 2001) metabolic syndrome and cardiovascular disease. Although obesity is commonly associated with T2DM and has been clearly established to precede its development, it is neither a sufficient nor a necessary metabolic abnormality to cause T2DM. One or more of the other metabolic abnormalities that occur in subjects with T2DM, together
12
with genetic susceptibility, must also be present in the obese subject before T2DM develops. Obesity is associated with higher fat free acids (NEFA), low-grade inflammation: tumour necrosis factor alpha, interleukin-6 and protein C-reactive (TNF, IL6, CRP), and lower adiponectin levels. Other potential mechanisms that have been put forward to explain the insulin resistance, include increased lipid oxidation and glucose toxicity (DeFronzo, 1992) impaired incretin effect observed in obesity and T2DM can contribute with β-cell dysfunction leading to the inability of insulin secretion to offset body's insulin resistance resulting in impairment of glucose homeostasis (Nauck, 1997).
At least three mechanisms have been proposed to link obesity to insulin resistance and predispose to T2DM: 1) increased production of adipokines/cytokines, including TNF, resistin and retinol binding protein-4 (RBP-4), that contribute to insulin resistance as well as reduced levels of adiponectin (Deng, 2010); 2) ectopic fat deposition, particularly in the liver and also in skeletal muscle, and the dysmetabolic sequelae (Larson-Meyer, 2011); and 3) mitochondrial dysfunction, evident by decreased mitochondrial mass or function. Mitochondrial dysfunction could be one of the most important underlying defects linking obesity to diabetes, both by decreasing insulin sensitivity and by compromising β-cell function (Bournat, 2010).
1.4. Nonobese Type 2 Diabetes Mellitus
It is not clear if nonobese and obese forms of T2DM have a similar natural history (Prando, 1998; Eckel, 2011). The obese form of T2DM is the most common, accounting for the majority of cases in caucasoides and other populations such as the Americans Indians, Mexican-Americans, Micronesians and Polynesians. On the other hand, in populations of Far East including Japan, China, Taiwan and Korea, the nonobese form is more common (Bennett, 1992 and IDF Atlas, 2011). Insulin resistance and impaired insulin secretion are usually present in patients with classic type 2 diabetes as well as in most patients with
13
impaired glucose tolerance. Both play important roles in determining if diabetes development and also in determining the magnitude of the accompanying hyperglycaemia and others metabolic abnormalities. Lean subjects, first-degree T2DM relatives showed impairment in insulin secretion whereas insulin sensitivity was normal (Pimenta, 1995). Lean subjects with normal glucose tolerance and first-degree T2DM relatives showed defective insulin secretion relative to insulin sensitivity, lower insulin sensitivity compared with controls and correlation between NEFA and insulin resistance (Perseghin, 1997). But not only obesity can be implicated in the development of insulin resistant state. Non obese individuals can present insulin resistance by numerous others mechanisms: high fat diets (Gupta, 2012), decreased physical fitness, increased visceral fat accumulation (Eckert, 2012), smoking, pregnancy and certain used medications (Gupta, 2012). It seems that in nonobese T2DM genetic susceptibility may contribute more to the onset of the disease than environmental component does (Rhodes, 2002). When matched for obesity, normal glucose tolerant, first-degree relatives of patients with T2DM had impaired insulin secretion but were not insulin resistant (Van Haeften, 1998; Pimenta, 1995). Normal glucose tolerant monozygotic twins of someone with T2DM had impaired β-cell function, but normal insulin sensitivity; moreover, monozygotic twins who had developed impaired glucose tolerance had the same degree of impaired insulin secretion as those who had maintained normal glucose tolerance, but they had greater body mass index and waist-to-hip ratio and were insulin resistant (Vaag, 1995). Prando and associates studied 147 nonobese and 215 obese subjects to assess the possible differences in insulin secretion and its link with treatment failure with oral hypoglycaemic agents. Obese group showed higher percentage of dietetic control, high insulin secretion with comparable levels of insulin sensitivity. As conclusion of this study obese have high insulin secretion than nonobese subjects, especially in the early years of disease and secondary failure in hypoglycaemic treatment is linked with progressive impairment in insulin secretion for both obese and nonobese T2DM individuals (Prando, 1998). Arner et al., studied elderly
14
patients divided in four groups nonobese and obese with and without diabetes. In nonobese hyperglycaemic subjects, however, there was no evidence of peripheral insulin resistance with marked secretory defect involving both the first and second phase response (Arner, 1991). Moreover obese diabetic patients were more insulin resistant than nonobese diabetic patients and showed only the first phase insulin response decreased. The second phase was slightly enhanced, in contrast with nonobese diabetic subjects that presented lower first-and second-phase insulin secretion (Felber, 2002).
1.5. Pathogenesis of Type 2 Diabetes Mellitus
The pathogenesis of T2DM is multi-factorial and includes both genetic factors and environmental elements that affect insulin secretion, insulin function and higher hepatic glucose production (DeFronzo, 2004). Genetically, the pancreas responsible to produce insulin at exactly doses, may cannot be able to produce enough insulin to offset the insulin resistance state, given rise to hyperglycaemia. The environment may impair the insulin ability to stimulate glucose uptake by the cells. It provokes hyperglycaemia that could or not be resolved by increase in β-cell function as reviewed by Ferrannini (Ferrannini, 2010). This dynamic equilibrium between β-cell function, represented by β-cell glucose sensitivity, i.e., the ability of β-cell in secret exactly amounts of insulin to offset increments in plasma glucose concentration and the ability of insulin-dependent tissues to recognize promptly insulin hormone and internalizes glucose molecules represent the two major defects observed during the progression of normal glucose tolerance to IGT and finally T2DM. They must be viewed simultaneously because any impairment in one will reflect in a defective response in the other.
In normal glucose tolerant subjects, the increase in insulin secretion that occurs simultaneously with insulin resistance is described by a hyperbolic relationship (Kahn, 1993). Not only insulin concentration in plasma is impaired but also qualitative changes in insulin
15
secretion are observed in insulin resistant state (O'Rahilly, 1988). Indeed, defects in insulin secretion pulses have been reported as inversely correlated with peripheral insulin sensitivity (Hunter, 1996). Proinsulin, molecule that can be used to measure the correct rate of insulin synthesis, is increased in states of impaired glucose tolerance (IGT and T2DM). Higher glucagon and proinsulin were associated with insulin resistant status (Ferrannini, 2007) reflecting the incapacity of β-cell to synthesises insulin correctly and the insulin to inhibit glucagon secretion by pancreatic α-cells.
Thus, we can conclude that type 2 diabetic subjects manifest multiple disturbances in glucose homeostasis, including: (1) impaired insulin secretion; (2) insulin resistance in muscle, liver, and adipocytes; and (3) abnormalities in splanchnic glucose uptake.
1.5.1. Insulin resistance
Insulin resistance is present when the biological effects of insulin are less than expected for glucose disposal in skeletal muscle, suppression of endogenous glucose production in liver and to mediate lipid metabolism on adipose tissue (DeFronzo, 1992). Insulin resistance is present in lean or obese patients with T2DM, in whom precedes and predicts the hyperglycaemia (Bogardus, 1991), contributing to metabolic syndrome (Reaven, 1988) or being responsible together with the hyperinsulinaemia by the insulin resistance syndrome (Ferrannini, 1992). Augmented ß-cell response represents a compensatory adaptation by the ß-cells to offset the defect in insulin action (Mari, 2005a). During the progression from NGT to IGT there is an increase in insulin resistance and secretion. In the long term, the increased demand for insulin led to ß-cell exhaustion, the development of fasting hyperglycaemia and overt diabetes (Abdul-Ghani, 2006).
Skeletal muscle is the primary site of insulin action in the postprandial state, accounting for about two thirds of glucose uptake. The liver is responsible by uptake the other one third of glucose, both via insulin dependent mechanisms (Abdul-Ghani, 2010). During
16
euglycaemic hyperinsulinaemic clamp, hyperinsulinaemia inhibits glucose production by the liver and insulin secretion (Ferrannini, 1999). So the glucose uptake stimulated by insulin during the clamp is represented almost only by the muscle metabolism. The skeletal muscle of lean T2DM and obese subjects with normal glucose tolerance (NGT) is resistant to insulin (Felber, 2002).
In nonobese healthy subjects with strong familiar history of T2DM (FH+ subjects) insulin resistance is present long before the development of impairment in glucose metabolism and as severe as in established T2DM (Mari, 2005b; Jensen, 2002).
Liver insulin resistance plays an important role in the T2DM pathogenesis. Mild-age subjects divided by glucose tolerance status were studied during OGTT and low-dose insulin infusion rate to assessing glucose rate of appearance (Ra) using [6-3H] glucose as glucose tracer. Hepatic insulin resistance appears as an early and important defect that characterizes subjects with IGT and mild diabetes (Båvenholm, 2001). In the postabsorptive state liver is responsible to produce glucose to exactly match the obligatory needs of the brain and other tissues that utilize glucose independently of insulin, this uptake of glucose is not impaired in T2DM and is basically equal at basal and postabsorptive state. After glucose ingestion, insulin is released into the portal vein and carried to the liver where binds to specific receptors on the hepatocytes and suppresses hepatic glucose output. Liver insulin resistance results in impaired suppression of HPG contributing to hyperglycaemia. In T2DM subjects with moderate hyperglycaemia and higher fasting insulin plasma concentrations, an increase in basal HPG has been demonstrated been closely correlated with the degree of fasting hyperglycaemia (Ferrannini, 1999). Hepatic insulin resistance may drive an increase in insulin secretion to prevent an increase in hepatic glucose production (HGP) and hyperglycaemia. This chronic ß-cell demand may accelerate the progression to T2DM. Excessive HPG is an important factor in the development of fasting hyperglycaemia. Examining HGP rates in 200 men of similar age, with a range of glucose tolerance degrees, Tripathy et al. have showed that although in
17
absolute terms the endogenous glucose production (EGP) was not high until late in the stages of glucose intolerance, hepatic insulin resistance was already evident in subjects with IGT (Tripathy, 2004). Because augmented HPG occurs even in the presence of hyperinsulinaemia, a powerful inhibitor of HGP, it is believed that hepatic resistance to insulin is present in postabsorptive state and contributes to the excessive output of glucose by the liver. Because hyperglycaemia also suppresses HGP there may also be glucose resistance with respect to the inhibitory effect of hyperglycaemia on hepatic glucose output (Faerch, 2009).
Insulin also control fat metabolism stimulating fat storage and/or fat free acids (NEFA) release (Groop, 1989). Circulating NEFA levels are markedly increased in obesity and T2DM and evidences suggests a fundamental role of NEFA to induce insulin resistance in peripheral tissues. Prolonged exposition of skeletal muscle and myocytes to high levels of NEFA leads to severe insulin resistance by affecting intracellular signalling pathways in cells (Roden, 2004). When white tissue ability for storage circulating lipids is exceed, NEFA storage starts in others tissues such as liver and skeletal muscle. However, an increased mass stored triglycerides especially in adipocytes and in visceral or deep subcutaneous adipose tissue depots, leads to large adipose cells, which become resistant to the ability of insulin to suppress lipolysis. It leads to increased release and circulating levels of NEFAs which aggravates insulin resistance (decreases glucose uptake and oxidation) in skeletal muscle and liver. When these NEFAs accumulates in other organs than the adipose tissue (ectopic fat storage), they further promote insulin resistance in liver and muscle cells and damage the β-cells in the pancreas. This is known as “lipotoxicity”. The link between intra-hepatic lipids in non-alcoholic fatty liver disease (NAFLD) and hepatic insulin resistance seems tight as well. The excess of NEFAs also promotes hepatic triglyceride production and therefore the dyslipidemia usually seen in T2DM. Ectopic fat is strongly associated with insulin resistance (Gastaldelli, 2011).
18
Adipocytes synthesize and secrete a host of proteins that collectively are designated as adipocytokines that have local, autocrine and paracrine effects, as well as systemic effects. Low-grade inflammation is associated not only with obesity but also with cardiovascular disease and T2DM (Pickup, 1998). Circulating concentrations of inflammatory markers, such as CRP and IL-6 are independent predictors of the future development of type 2 diabetes in a prospective case-cohort study within the population-based MONICA/KORA Augsburg cohort (Herder, 2011), but failed in another cohort study: the Framingham Heart Study (Dallmeier, 2012). Tumour necrosis factor alpha (TNF-α) have direct effect on insulin sensitivity in skeletal muscle and it has been demonstrated in vitro, in vivo in animals and in vivo in humans (Hotamisligil, 2003). A number of other adipocytokines have been identified, including IL-6, plasminogen activator inhibitor-1 (PAI-1), resistin, IL-1, leptin, adiponectin, and visfatin, all of them exhibiting positive, such adiponectin (Pajvani, 2003) or negative (TNF-α, IL6, resistin) effects on insulin sensitivity. Activation of inflammatory pathways by adipocytokines has been shown to inhibit insulin signal transduction by causing serine/threonine phosphorilation of IRS-1 in multiple insulin-sensitive tissues, including muscle, liver and adipocytes (Hotamisligil, 1996). Thus, expression and secretion into plasma of these and other cytokines could provide a link between insulin resistance and low-grade inflammation in T2DM (Shoelson, 2006). There are several possible explanation for how inflammation in adipose tissue lead to systemic (muscle and liver) insulin resistance in humans: 1) decrease insulin responsiveness in adipose tissue leads to increased lipolysis and elevated NEFA concentrations, which are known to cause insulin resistance in muscle and liver; 2) adipokines released by adipocytes and resident macrophages are released into the circulation and act at distal sites (skeletal muscle and liver), and activate inflammatory (c-Jun N-terminal kinase (JNK), nuclear factor kappa-light-chain-enhancer of activated β-cells (NFK-β) pathways, to impair insulin signalling (Shoelson, 2006; Pajvani, 2003; Pickup, 1998).
19
1.5.2. Insulin Secretion
Abnormalities in insulin secretion are present in subjects with IGT and in patients with type 2 diabetes (Beck-Nielsen, 1994). Indeed, subjects with IGT can remain in these conditions for several years, or revert to NGT or progress to T2DM (Ferrannini, 2011). Diabetic subjects showed the same abnormalities observed in IGT people but without normal glycaemic control .
Usually during the progression from IGT to T2DM, basal insulin concentrations may be raised several fold than the normal value (Tripathy, 2004), especially in obese hyperglycaemic patients. However, basal -cell secretory function must is not normal, because the prevailing plasma glucose level also must be taken into account. Hyperglycaemia is the major stimulus for insulin secretion, and when normal individuals are made hyperglycaemic by glucose infusion, circulating levels are much higher than those found in T2DM. Ehrmann et al. has shown that subjects with IGT secrete less insulin at any given glucose level than NGT subjects matched for a similar degree of insulin resistance and obesity (Ehrmann, 2002).
Normal insulin secretion is biphasic and is composed by an early burst of insulin release for about 10 minutes, followed by a graded and progressive release of insulin that persists parallel with hyperglycaemic stimulus. Henquin, studying this phenomenon showed that the first phase insulin secretion is represented by the release of insulin secretory granules. There are a reserve of insulin localized near to the plasmatic membrane of the β-cell and immediately releasable (Henquin, 2000). Glucose is a powerful generator of insulin secretion by stimulation of both pathways involved in insulin secretion: the triggering pathway that occurs early and starts when glucose enters inside β-cells by facilitated diffusion. Glucose is then metabolized, generating by glycolysis a rise in to-ADP ratio, closure of ATP-sensitive K+ (KATP) channels, membrane depolarization, opening of voltage-operated Ca2+ channels, Ca2+ influx, rise in cytoplasmic free Ca2+ concentration ([Ca2+]i), and activation
20
of the insulin exocytosis. The mechanism of the amplifying pathway is less known. Increase in β-cell metabolism also generates amplifying signals that augment the efficacy for the Ca2+ on the exocytose machinery. Stimulatory hormones and neurotransmitters modestly increase the triggering signal and strongly activate amplifying pathways biochemically distinct from that set into operation by nutrients. Many drugs can increase insulin secretion in vitro, but only few have a therapeutic potential (Henquin, 2004).
This biphasic response is identifiable after intravenous glucose load (IVGTT) (Seltzer, 1967). T2DM subjects have reduced first phase response to oral or intravenous glucose load already at an early stage of their disease (Swinburn, 1995). However, loss of first phase insulin secretion does not appear to be the primary defect responsible for T2DM even if the loss of first phase of insulin secretion have been linked with the increased in EGP observed in T2DM (Luzi, 1989).
Although insulin resistance is considered the initiating event in the pathogenesis of T2DM, β-cell dysfunction must be present for the hyperglycaemia initiation (Ferrannini, 2010). Initially in the T2DM progression increments in FPG can be observed and correlated with insulin resistance. At this point, a compensatory mechanism is already present. In fact, when β-cell function is expressed in relation to insulin resistance observed that β-cell dysfunction is present longer before T2DM (Gastaldelli, 2004 a). As long as the β-cell is able to secrete sufficient amounts of insulin to offset the severity of insulin resistance, glucose tolerance remains normal (Gastaldelli, 2011).
2. Bariatric Surgery
Diet, exercise and prescription medication remain the cornerstones of type 2 diabetes mellitus therapies, but the long-term success rates of lifestyle and drug modifications are disappointing. Despite a vast variety of pharmacological therapies, long-term glycaemic control is difficult, and use of large number of drugs introduces a proportionate risk of
21
hypoglycaemia. Moreover, most diabetes medications promote weight gain and weight gain in turn, exacerbate the severity of T2DM.
In cases where classic strategies prove insufficient, several types of gastrointestinal (GI) surgery offer alternatives to treat obesity and T2DM. Among severely obese patients, bariatric operations cause significant sustained weight loss, improve obesity-related comorbidities, and reduce mortality in the long term. Currently, bariatric surgery is considered appropriate for individuals with a body mass index (BMI) >35 kg/m2 and serious obesity-related comorbidities, including T2DM. Operations involving intestinal bypasses exert particularly dramatic effects on diabetes. Mounting evidence indicates that these remarkable effects result not only from weight loss but also from weight-independent antidiabetic mechanisms. Consequently, conventional bariatric procedures and new experimental GI operations are being used to treat T2DM associated with obesity and, increasingly, among less obese or merely overweight patients.
Bariatric procedures were initially classified as restrictive, malabsortive, or combined, reflecting the purported mechanism of weight loss. Restrictive procedures reduce the volume of the stomach to decrease food intake and induce early satiety. Malabsortive procedures, such as biliopancreatic diversion (BPD), shorten the small intestine to decrease nutrient absorption. Combined procedures, such as the Roux-en-Y gastric bypass (RYGB), incorporate both restrictive and malabsortive elements.
2.1. Diabetes Resolution and Improvement after bariatric surgery
Observational evidences suggest that bariatric surgery is associated with 60% to 80% rate of diabetes resolution, defined as discontinuation of all diabetes-related medications and blood glucose levels within the normal range (Vetter, 2009). Recovery from type 2 diabetes was established in 76,8% of the patients who underwent bariatric surgery (Buchwald, 2009). In the surgically treated group of SOS study, T2DM had disappeared in 72% after 2 years. In
22
the conventionally treated group it was 21%. These percentages seem related to the operative procedures that are used.
The remarkable control of diabetes in severely obese patients together with results from experimental studies showing that GI operations can improve diabetes in both obese and nonobese animals have lead to the concept that surgery may be beneficial for moderately obese patients with T2DM.
2.2 Mechanisms of diabetes remission after gastrointestinal surgery
2.2.1 Weight loss effects
Weight reduction leads to a decline in insulin resistance, better metabolic regulation of patients with T2DM, lower blood pressure and less atherogenic lipid profile (Sjöström, 2004). The Diabetes Prevention Program reported a 58% reduction of the diabetes incidence after modest weight loss of 5.6 kg on average (Knowler, 2002). The 'Swedish obese subjects' (SOS) study has shown that long-term weight reduction, achieved by bariatric surgery improves the cardiovascular risk profile and decreases the overall mortality (Knowler, 2002). In the Pima Indians with normal tolerance to glucose long-term weight changes have been associated with reciprocal change in insulin action (Weyer, 2000). However, weight loss did not explain all amelioration observed in morbidly obese subjects after bariatric surgery.
Observations that glycaemic control improves early after surgery, before important weight loss, has led to the recognition that bariatric surgery induces modifications that are independent of weight loss. Comparisons between BPD and RYGB effects on glucose metabolism realized by Muscelli et al. demonstrated differentiated changes in insulin sensitivity in face of paired weight loss (Muscelli, 2005). Camastra et al. reported that RYGB surgery promotes early (one month) improvement in glucose metabolism by increasing hepatic insulin sensitivity more than in peripheral tissues. Moreover, studying the same subjects after two years, improvement in peripheral IS was correlated with weight loss
23
(Camastra, 2011). Others investigated the effect of BPD surgery and found that diversely of RYGB, IS and first phase insulin secretion improved in a few days after surgery (Salinari, 2009).
Weight loss has been also linked to amelioration of β-cell function and insulin secretion. Homeostasis model (HOMA-), Acute insulin response (AIR) and mathematical modelling were used to assess this parameter (Briatore, 2008; Ferrannini, 2009; Camastra, 2011). Morbidly obese T2DM patients restored first phase insulin secretion earlier after BPD (Briatore, 2008). Using mathematical modelling to assess the β-cell function after BPD and RYGB surgery, Mari et al. showed that all of 3 mathematical model parameters improved after weight loss induced by surgery (Mari, 2006). Among these parameters, β-cell glucose sensitivity is the main determinant of IGT and T2DM, rate sensitivity and potentiation being relatively minor factors.
Finally, several peptides expressed and releases by adipose tissue are metabolically active and are also changed by bariatric surgery.
2.2.2. Effects of BPD on Insulin Sensitivity
Insulin resistance is present when the biological effects of insulin are less than expected for one or more of the insulin action: glucose disposal in skeletal muscle, suppression of endogenous glucose production primarily in liver (Rizza, 2010) and to mediate lipid metabolism on adipose tissue (Ferrannini, 1999). Most of available evidence suggests that insulin resistance is the primary metabolic disturbance in T2DM and that the augmented ß-cell response represents a compensatory adaptation by the ß-cells to offset the defect in insulin action (Ferrannini, 1992; Arner, 1991). Most T2DM are obese and obese normoglycaemic subjects are also insulin resistant. Overweight and the adiposity are determinants of insulin sensitivity (Ferrannini, 1997) and loss of weight by diet or surgery is able to enhance IS (Sjöström, 2013). It is known that weight loss promoted by bariatric
24
surgery improve IS in subjects with NGT, IGT and T2DM. However some investigators have found greater defect on insulin secretion (AIR) than in IS in non obese T2DM patients (Arner, 1991). Subjects with non-morbidly obesity (BMI < 35 kg/m2) showed an improved IS after loss of 5kg in average and only 1.5 kg of fat mass (Chiellini, 2009). Suggesting that more than the quantity, site of fat accumulation instead of amount of fat gained or lost is very important. Moreover when fat is removed selectively by surgeries as liposuction, does not promote improvements in IS as could be expected (Ferrannini, 2009). Ectopic fat has been linked with IR independently of total body fat mass (Gastaldelli, 2011). On the other hand, omental adipose tissue is lipolytically active and releases a large quantity of fatty acids. These fatty acids are converted into triglycerides. The liver in turn produces increased free fatty acids and releases the same into the systemic circulation which contributes to peripheral insulin resistance directly as well as by increasing muscle triglyceride. Removal of visceral fat from diabetic mice have restored IS (Gabriely, 2002) but RYGB plus omentectomy showed no additional improvement in IS that observed in control group (Lima, 2010).
Two groups of obese patients (with or without T2DM) underwent BPD demonstrated that the obese T2DM group had before surgery high FPG, IR (measured by HOMA-IR) and lesser AIR (IVGTT). One month after surgery FPG and HOMA-IR were reduced at levels similar to those observed in the obese non-diabetic control group while AIR increases only in T2DM subjects, but without achieves normal values (Briatore, 2008). Two years after BPD surgery obese non diabetic have showed levels of IS greater than lean control subjects and greater than obese non diabetic subjects underwent RYGB (Muscelli, 2005). NGT, IGT and T2DM subjects were submitted to BPD and compared to two control groups, lean and obese subjects that underwent abdominal surgery for other reasons (mainly cholecystectomy and abdominal hernia). IS did not change in the control groups while increased only 10 days after BPD surgery in all patients before any significant weight loss. The improvement in IS could not be explain by changes in NEFA, adiponectin or leptin concentrations (Mari, 2006).
25
Obesity is a state of heightened inflammation as noted by increased serum levels of inflammatory markers like TNF-α and IL-1. These molecules induce insulin resistance by inhibition of insulin signal transduction. Interleukin-6 (IL-6) and TNF-α have been shown to contribute to hepatic insulin resistance in animal models (Barbuio, 2007). Bariatric surgery has been shown to decrease the levels of IL-1, whereas there is no consensus about the change in TNF-α and IL-6 after bariatric surgery (Bruun, 2007; Vazquez, 2005).
Results as presented above leads to the hypothesis that some unknown regulator factors of insulin sensitivity are directly affected by BPD as well as by RYGB surgery. In fact, Rubino et al. showed that exclusion of duodenum from the alimentary transit in non-obese rats Goto-Kakyzaky (T2DM model) improved glucose metabolism as observed in BPD surgery (Rubino, 2004 b).
2.2.3. Effects of BPD on β-cell function
Maintenance of normal glucose tolerance is dependent on the finely tuned balance between insulin secretion and insulin action (Reaven, 1989 e Wogensen 1991 e Ferrannini, 1997). NGT subjects show insulin sensibility that varies greatly but nevertheless glucose tolerance remains normal in function of β-cell compensation that offset tissue resistance to insulin. Biliopancreatic diversion is able to enhance both IS and β-cell function earlier after surgery and these effects of BPD have been observed after long term (Pontiroli, 2010; Muscelli, 2005). The progression from normal glucose tolerance to IGT and finally to T2DM is characterized by progressive hyperinsulinaemia, loss of β-cell mass that leads to the incapacity of β-cell to offset tissue insensitivity. A basic genetic defect in the insulin gene has been proposed to explain the disturbance in insulin secretion but anyone was able to prove or find any significant abnormalities (Das, 2006). The most likely explanation for the acquired defect in insulin secretion relates to the concept of glucose toxicity (Del Prato, 2009). The pathological sequence that leads to T2DM would be the superposition of obese-related insulin
26
resistance upon a β-cell with a geneticatilly limited capacity to compensate (Gerich, 2000). Studying obese and non obese T2DM subjects Prando el al. found that mainly in the earlier years of disease obese T2DM showed higher levels of insulin secretion than non obese T2DM subjects; that BMI was more related with insulin resistance and that after several years (10 years) the differences in insulin secretion between obese and non obese were negligible (Prando, 1998; Arner, 1991). The impact of bariatric surgery in obese subjects with or without T2DM has been done using the acute insulin response (AIR), homeostasis model (HOMA-B), insulinogenic index and mathematical modelling. All authors described improvements in β-cell function after BPD and after RYGB when the comparison has been made. Obese NGT and T2DM subjects have been studied for AIR using glucose and arginina stimulus (Briatore, 2010). One month after BPD fasting insulin, Homa-IR, AIR for glucose and arginine improved but AIR in T2DM did not were similar for NGT and T2DM.
Effects of BPD on β-cell function has been explored using mathematical modelling to assess insulin secretion by deconvolution of C-peptide proposed by Van Cauter (Van Cauter, 1992) and revised by Mari A. (Mari, 2008) and to assess the relationship between insulin secretion and glucose concentration (β-cell glucose sensitivity - BCGS). After BPD obese subjects showed improvements in all parameters of mathematical model. BPD induces a reduction of insulin secretion rate at fasting and during meal or OGTT stimulation. Guidone et al, found a correlation between decrease in insulin sensitivity and β-cell glucose sensitivity (Guidone, 2006). Camastra et al, studying morbidly obese T2DM subjects before and after Roux-en-Y showed that patients were more insulin resistant (IR) with decreased -cell function when compared with control group. Patients revert completely the IR and -cell function proportionally with weight loss (Camastra, 2007).
27
2.3. The entero-insular axis
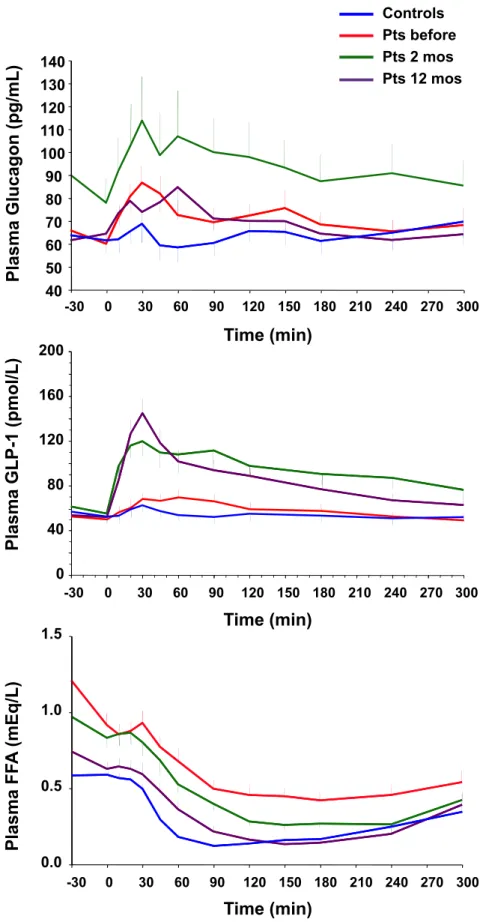
Food intake, transit and absorption are regulated by a complex network including the gastrointestinal system, the liver and the brain (Cummings, 2007 b). Surgical rearrangements of gastrointestinal tract may can change hormones concentrations and per consequence, alteration in glucose metabolism. Changes in gastro-intestinal hormones (GI) have been analysed for those bariatric surgeries that alter food transit. Glucagon-like peptide 1 (GLP-1) is a potent insulin agonist that is secreted by L-cells of the distal ileum in response to ingested nutrients and is inactivated by the enzyme dipeptidyl peptidase IV (DPP-IV). GLP-1 potentiates insulin release in a glucose dependent manner. Insulin increases affect α-cells inhibiting glucagon secretion (Holst, 2007). GLP-1 response to a mixed meal or OGTT is impaired in obesity and T2DM and increases after RYGB and BPD (Rubino, 2004a; Laferrère, 2008; Mingrone, 2009). Muscelli et al. have quantified the incretin effect on insulin secretion during a mixed meal test followed by an intravenous glucose test that duplicate previous MTT glycaemic values but without meal stimulation. GLP-1 and GIP account for 50% to 60% of nutrients stimulated insulin release (Muscelli, 2006) increases -cell mass trough regulation of proliferation, neogenesis, and apoptosis (Hansotia, 2005). It is not clear what the precise mechanisms is by which GLP-1 release is raced up by anatomical rearrangements that either by-pass the duodenum and upper jejunum (RYGB) or exclude the larger part of the entire gastrointestinal tract from food transit (BPD). Moreover GLP-1 also delays digestion and blunts postprandial glycaemia and acts on the central nervous systems to induce satiety and decrease food intake (Gutzwiller, 1999).
Glucose dependent insulinotropic peptide is secreted by K-cells of the proximal gut in response to carbohydrate and lipid rich meals. It acts on pancreatic β-cells to increase insulin secretion through the same mechanism as GLP-1, although it is less potent, and also stimulates lipoprotein lipase activity (Meier, 2002). But does not affect gastric emptying or satiety.
28
Others non-incretins gut peptides that also modulate glucose metabolism have changed your plasma profile after bariatric surgery. Neuropeptide YY (PYY), like GLP-1 is secreted by the L-cells of the distal intestine. Peptide YY is present in 2 molecular forms: PYY 1-36 and PYY 3-36 a cleavage product. PYY increases satiety and delays gastric emptying through neuropeptide Y-receptors subtypes in the central and peripheral nervous systems. Intravenous PYY 3-36 increases satiety and decreases food intake in humans (Vetter, 2009). Ghrelin is another hormone secreted in response to meal stimulation by cells from gastric fundus and proximal intestine and acts on the hypothalamus to regulate appetite. Systemic ghrelin levels increases before a meal and decreases afterward, stimuling appetite, and food intake and suppressing energy expenditure and fat catabolism. There is a negative correlation between body weight and serum ghrelin levels. Increases in ghrelin level after surgery or diet suggest its role in body weight regulation (Karra, 2010).
Rubino et al. found that excluding a short segment of proximal intestine from food passage improved glucose tolerance, whereas restoring duodenal transit re-established glucose intolerance. This observation has lead to the foregut hypothesis, which holds that contact of nutrients with duodenal mucosa generates signals (hormonal and/or neural) that interfere with glucose metabolism and insulin action; by-passing duodenal passage (as RYGB and BDP) would remove this inhibition (Rubino, 2004 b).
3. Protocol End-points
We hypothesizing that changes promoting by BPD on intestinal limb and as consequence on entero-insular axis will be able to decrease plasma glucose concentration, promoting improvements in HbA1c%, in insulin secretion (ISecr) and action (M value). Similar as observed in morbidly obese subjects (BMI≥40kg/m2
) after bariatric surgery, we expect that changes are to be stable in the long time. Based in observations in morbidly obese and T2DM very obese subjects (BMI≥35kg/m2
29
of insulin resistance (IR) and improvement of β-cell function, represented here by parameters obtained from mathematical model applied on MMT data (Fasting insulin secretion, Total insulin secretion, beta-cell glucose sensitivity, rate sensitivity and potentiation factor) with consecutive improvement of clinical T2DM symptoms and others components of metabolic syndrome. Bariatric surgery is actually used as weight loss treatment in patients with BMI ≥40 kg/m2
or BMI ≥35 kg/m2 with comorbidities. To our patients excessive weight loss is not desirable. Surgery was re-designed to avoid it. We have targeted a BMI not lesser than 22 kg/m2 as acceptable final body mass index.
To assess metabolic effects of BPD in non morbidly obese subjects we have used 3 different stimulus.
1. Oral glucose tolerance test (OGTT), 2. Mixed meal tolerance test (MTT),
3. Euglycaemic hyperinsulinaemic clamp (CLAMP). During the tests we measured:
plasma glucose response to standard OGTT in order to determine glucose tolerance status before and post surgery,
plasma glucose, Fat free acids, insulin, C-peptide, glucagon and GLP-1 response to a mixed meal stimulation,
insulin secretion during MTT using C-peptide deconvolution and β-cell function by mathematical modelling,
whole body glucose uptake by euglycaemic hyperinsulinaemic clamp and inhibition of hepatic glucose production (EGP) by tracer methods,
Lipid profile : total cholesterol, HDL and LDL-cholesterol and triglycerides,
Liver profile: ALT, AST an GGT
30
Results obtained by this protocol can be used to better understanding the
pathophysiological mechanisms of T2DM; BPD effects on T2DM and mechanisms of T2DM remission after bariatric surgery.
4. MATERIAL AND METHODS
4.1. Study Population
Fifteen patients (6 men, 9 women, 551 years, BMI=28.3±0.6 kg/m2, range 24.5-33.1 kg/m2) with T2DM (duration 16±2 years, range 6-27 years, HbA1c=8.5±0.4%, range 6.8-11.5%) on treatment with metformin+sulfonylureas (Oral Hypoglicemiants Agents - OHA, n=6) or OHA plus insulin (n=9, mean dose=30 IU/day, range 10-90 IU/day) participated in the study. All of them had shown history of poor metabolic control under OHA treatment and comorbidities linked to T2DM. Patients were studied at baseline (Pre), ~2 months after surgery (Post1), and one year after surgery (Post2). Each patient underwent a 3-hour oral glucose tolerance test (OGTT), a 5-hour mixed meal test (MTT), and a euglycaemic hyperinsulinaemic clamp (CLAMP) on separate days over two weeks (Fig. 1). The tests were performed after an overnight fast; antidiabetic medications were withdrawn 3 days before testing. When required to avoid hyperglycaemia, regular insulin was used until 8 hours before the metabolic tests.
Fifteen nondiabetic volunteers, matched to the patient group by gender, age (51±3 years), and BMI (30.2±0.9 kg/m2), served as a control group; they all received the MTT, and eight of them also received the euglycaemic clamp.
Patients were submitted to the metabolic tests and surgery at the San Martino Hospital - Genova, Italy from 2008 to 2012 instead control group subjects were studied at Santa Chiara Hospital - Pisa in the same period.
31
4.2. Subjects Enrolment
Inclusion criteria:
Both genders, age between 35 and 65 years old;
Type 2 diabetes diagnoses longer than 5 years, poor glycaemic control (HbA1c ≥ 8%) on standard of care diabetes therapy;
Presence of some comorbidities (dyslipidemia, hypertension, neuropathy, retinopathy, cardiovascular disease or stroke),
Possibility to participate to the follow-up protocol.
Exclusion criteria:
Anti-glutamic acid decarboxylase (GAD) antibodies or plasma C-peptide lesser than 0.5 ng/ml,
Liver cirrhosis, renal failure, history of malignancy or malignant neoplasm in place, severe inflammatory, neurological or cardiovascular complications in act,
Pregnancy or any condition that at the discretion of the head of the study could represent risk to the patient or could affect the protocol results.
Diabetes remission was defined as an HbA1c ≤6.5%, fasting plasma glucose (FPG) ≤7 mmol/l, and a 2-hour plasma glucose ≤11.1 mmol/l during the OGTT without any anti-diabetic medication.
32
4.3. Oral Glucose Tolerance Test (OGTT)
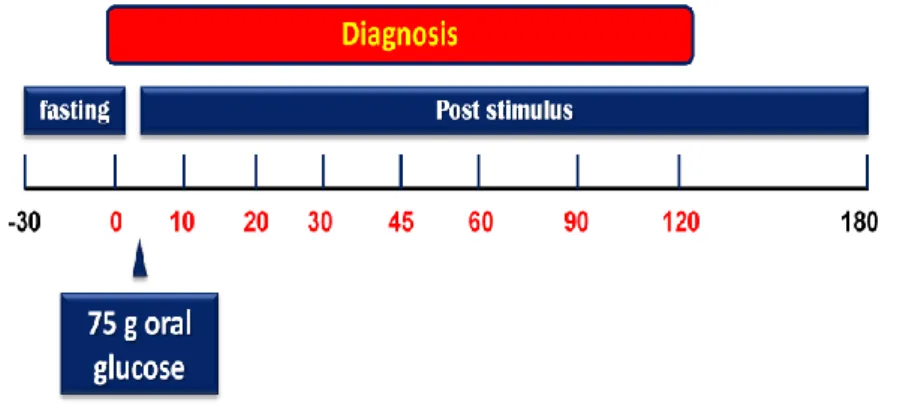
A standard 75-g oral glucose tolerance test (OGTT) was performed in each patient (Fig. 2). Venous blood samples were collected at -30, 0, 30, 60, 90, 120, and 180 min after glucose load from catheter localized in antecubital vein for determination of plasma glucose concentrations. Patients were studied after a rest period and keep lying for all study. Results obtained from OGTT were used to evaluate a) glucose tolerance status before and after surgery and b) T2DM remission after surgery.
Fig. 2: Schematic representation of oral glucose tolerance test - OGTT
4.4. Mixed Meal Tolerance Test (MMT)
Meal stimulation was performed, in a separate day, at fasting state, following a 30 minutes stabilization period. Patients were invited to eat one boiled egg, 50-g of parmesan cheese, and 75-g of an aqueous glucose solution. The MMT composition was: 54% carbohydrate, 30% lipid, 16% protein, totalizing 561 kcal (Fig. 3). Venous blood samples were collected at -30, 0, 10, 20, 30, 45, 60, 90, 120, 150, 180, 240, and 300 min from a catheter placed at antecubital vein. Plasma samples were drawn and stored for future measurements. Plasma glucose insulin and C-peptide concentrations were assayed to assess ß-cell function using C-peptide deconvolution associated to mathematical modelling to reconstruct insulin secretion rates. Time course of plasma glucagon, GLP-1 (glucagon-like peptide 1) and Fat free acids (NEFA) were also assessed.
33
Fig. 3: Schematic representation of mixed meal tolerance test - MMT
4.5. Euglycaemic Hyperinsulinaemic clamp
Euglycaemic Hyperinsulinaemic clamp was performed after 3 hours basal period (Fig.
4). Primed-continuous infusion of 6,6-2[H5] glucose (0.22 mol.min-1.kg-1; prime: 22.0 mol/kg*[FPG/5]) were started at -180 minutes in an antecubital vein and continued throughout the study. At time -120, -40, -20, -10 and 0 min blood samples were obtained from an arterialised vein for measurement of glucose, NEFA, insulin, C-peptide and for tracer determinations. At time zero, a primed-continuous insulin (Humulin R; Eli Lilly, Indianapolis, IN, USA) insulin infusion (240 pmol.min-1.m-2) was started and continued for 180 minutes. At time zero, 6,6-2[H5] glucose was decreased (from 0.22 to 0.11 mol.min-1.kg-1) and continued until the end of the clamp. During the clamp, a variable rate of 20% of dextrose solution, enriched with 6,6-2[H5] glucose, was infused to maintain euglycaemia. Plasma glucose levels were measured every 5 minutes throughout the clamp. Patients that had FPG ≥5.5 pmol/l received the same glucose clamp technique described above with a minimum (0.5 mg.min-1.m -2
) of 20% glucose solution infusion until reach the euglycaemia or until the time 80 min, when plasma glucose concentration were clamped at the plasma glucose level observed at this time. Blood samples were drawn at each 20 min for measurement of glucose, NEFA, insulin, C-peptide and for tracer determinations. Additional plasma samples were stored to future determinations.
34
Fig. 4: Schematic representation of euglycaemic hyperinsulinaemic clamp - CLAMP
4.6. Surgery
Patients were submitted to a modified biliopancreatic diversion (BPD) procedure. During BPD a 60% gastric resection with stapled closure of the duodenal stump was made resulting in a residual stomach volume of 400-500 ml; the small bowel was then transected ~2.5 meters from the ileocecal valve, and the distal end was anastomosed to remaining stomach forming the alimentary limb. The proximal end of the ileum, comprising the remaining small bowel carrying the biliopancreatic juice and excluded from food transit, was anastomosed to the alimentary limb at ~75 cm from the ileocecal valve forming the common limb where nutrients and biliopancreatic juice mix (Fig. 5).
Fig. 5: Schematic representation of modified BPD for non-morbidly obese T2DM
35
4.7. Analytical procedures
Plasma glucose was measured by the glucose oxidase technique (Analox GM-9, Analox Instruments USA Inc, Lunenburg, MA, USA). Serum insulin and C-peptide were measured by a specific time-resolved immunofluorometric assay (TR-IFMA) (AutoDELFIA, Insulin and C-peptide kit, Wallac Oy, Turku, Finland). Plasma glucagon was assayed by radioimmunoassay (Millipore Corporation, Billerica, MA, USA), total plasma glucagon-like peptide-1 (GLP-1) was assayed by ELISA technique (Millipore Corporation, Billerica, MA, USA). Blood samples for C-peptide, insulin and glucagon were drawn using a protease inhibitor (5 l/ml of 10 mg/ml gabexate mesilate); for GLP-1 measurements blood was drawn into tubes containing a DPP-IV inhibitor (Diprotin A, 10 mM, Sigma Aldrich, Saint Louis, MO, USA). No significant cross-reactivity was declared by kits manufacturers. The sensitivity ranges are: 0.003 nmol/l and 1.39 pmol/l for the C-peptide and insulin assay, respectively, 18.5 pg/ml for glucagon, and 1.5 pM for GLP-1.
Gas chromatography/mass spectrometry - GCMS (GC, Hewlett Packard 5890 series II plus and MS, Hewlett Packard 5972) was used to determine 6,6-[2H2]glucose enrichment in the plasma. The method employs deproteinization of plasma samples with methanol (for liquid chromatography - Merck KGaA, Germania) followed by a derivatization of the labelled and non-labelled glucose with a solution of acetic anhydride (for liquid chromatography - Sigma Aldrich, Saint Louis, MO, USA) and pyridine (for liquid chromatography - Merck KGaA, Germania) in order to produce the corresponding glucose penta-acetate derivative. Samples were injected in GCMS in a solution of ethyl-acetate (for liquid chromatography - Sigma Aldrich, Saint Louis, MO, USA). The ratio between labelled and non-labelled glucose was used to calculate the endogenous glucose production.
Fat free acids (NEFA) were measured by standard spectrophotometric methods (NEFA kit, Wako Chemicals GmbH, Neuss, Germany) on a Synchron Clinical System CX4

![TABLE 2. Main anthropometric and metabolic variables at baseline and 1 month after RYGBP based on glucose tolerance category Variables Normal tolerance(nⴝ 6) [mean (SD )] Impaired tolerance(nⴝ 7) [mean (SD)] Type 2 diabetes(nⴝ 6) [mean (SD )]](https://thumb-eu.123doks.com/thumbv2/123dokorg/7629392.117095/67.877.64.807.145.396/anthropometric-metabolic-variables-tolerance-variables-tolerance-impaired-tolerance.webp)