http://revel.unice.fr
AVERTISSEMENT
Les publications du site REVEL sont protégées par les dispositions générales du Code de la propriété intellectuelle.
Conditions d'utilisation - respect du droit d'auteur et de la propriété intellectuelle
L'accès aux références bibliographiques et au texte intégral, aux outils de recherche ou au feuilletage de l'ensemble des revues est libre, cependant article, recension et autre contribution sont couvertes par le droit d'auteur et sont la propriété de leurs auteurs.
Les utilisateurs doivent toujours associer à toute unité documentaire les éléments bibliographiques permettant de l'identifier correctement et notamment toujours faire mention du nom de l'auteur, du titre de l'article, de la revue et du site Revel. Ces mentions apparaissent sur la page de garde des documents sauvegardés sur les postes des utilisateurs ou imprimés par leur soin.
L'université de Nice-Sophia Antipolis est l'éditeur du portail REVEL@Nice et à ce titre détient la propriété intellectuelle et les droits d'exploitation du site.
L'exploitation du site à des fins commerciales ou publicitaires est interdite ainsi que toute diffusion massive du contenu ou modification des données sans l'accord des auteurs et de l'équipe Revel.
Pour citer cet article :
Mariasole BANNò, Lucia PISCITELLO,
« The evaluation of public incentive programmes for outward internationalisation », ERIEP, Number 2, , ,
mis en ligne le 14 avril 2011
URL : http://revel.unice.fr/eriep/index.html?id=3216
The evaluation of public incentive programmes for outward internationalisation
Mariasole Bannò
Department of Mechanical and Industrial Engineering, University of Brescia [email protected]
Lucia Piscitello
Department of Management, Economics and Industrial Engineering, Politecnico di Milano
Public incentives have often been criticized for being ineffective, but there is still a lack of specific, rigorous analyses to either support or debunk that claim. In fact, no evidence has been provided so far on the role and effectiveness of financial incentives for outward internationalization. The paper aims to close that gap by evaluating the effects of such incentives on firm performance. We develop an empirical analysis using information on the population of Italian firms that received at least an incentive for international growth in the 19962008 period. The results of our analysis, after checking for selection bias and causality, show that financial incentives do help younger and smaller companies to increase their productivity, but are less effective in influencing their dimensional growth. Public Incentives, Evaluation, Foreign Direct Investments (FDIs)
Introduction
The outward internationalisation of firms is an increasingly important object of public intervention in most OECD countries (UNCTAD, 1997) since internationalisation is acknowledged as a determinant of national economic growth. Contextually, there is a general push for collecting evidence about the effectiveness of different policy tools (De Blasio and Lotti, 2008; Wollman, 2007).Italy is not characterized by a traditional attention to policy evaluation and its effort in evaluation practices is lower than AngloSaxon countries. However, recently, stimuli in impact analysis are growing. First, recent crisis lowers the financial resources that governments can exploit to subsidy the industry, consequently, policy makers have to define priorities and allocate funds to most promising target projects (Brancati, 2008). Second, the principle of subsidiarity1 and
the federalism give stimulus to policy evaluation at a delocalized level. These aspects make the planning of evaluation tools necessary (Pellegrini, 2003). Last but not least, the modernization of the Italian public administration and the EU directives also contribute to the development of systematic investigation of the
1 The Treaty on European Union has established the principle of subsidiarity as a general rule
(Art.5), which was initially applied to environmental policy in the Single European Act. This principle specifies that in areas that are not within its exclusive powers the Community shall only take action where objectives can best be attained by action at Community rather than at national level.
effectiveness of economic intervention2. This is partly due to the legislation at the
EU and national level which clearly obliges the agents involved in the distribution of subsidies to evaluate these operations.
Although these stimuli and several times in Italy has been highlighted the need of a proper evaluation of national public incentives to the firms, systematic analyses are scant as far as industrial policies are concerned, and almost absent those specifically concerning internationalisation policies. Most research on policies towards internationalization does not focus on FDI but on other types of international activities, such as exports or inward internationalisation and, in any case, results are not univocal (Bellak, Leibrecht and Stehrer, 2010; Gabriel, 2009; Guisinger, 1992; Oxelheim and Ghauri, 2004).
In this context we provide an empirical contribution on the effects of a specific programme implemented by the Italian Government to promote firms’ direct investments abroad. In particular the paper focuses on Law 100/24.4.1990, executed by SIMEST, which promote the provision of capital loans at interest rates below the market rate. The financial measure is launched by the Italian Government to stimulate small and medium enterprises’ (SME) outward investment as the main objective of the program is to promote parent firms’ growth and competitiveness. As such, we test the direct impact of public tools to outward FDI upon the firms’ domestic performance after internationalization. In particular, we think that public financial incentives may affect the cost of the investment, the firm’s capacity to augment the benefits from internationalization and the conditions for the firm to make better decisions. Thereby public intervention enhance firms’ competitiveness in terms of domestic turnover and productivity growth (Duran and Ubeda, 2001). The contribution of this paper is twofold. The economic literature has focused on the analysis of the postintervention effects on the economic performance of firms that received a grant; however this paper is the first systematic evaluation of public incentives addressing firms’ outward internationalisation (Ankarhem et al., 2009; Craig, Jackson and Thomson, 2008; Skuras and Tzelepis, 2004). Moreover the evaluation concerns the impact of public measures in respect of results clearly declared by policy makers. For this reason we analyze contextually two different outcome and the variables, on which the impact of policy measures will be evaluate, are growth and productivity. The issue is also challenging from a methodological perspective as we use a counterfactual approach to evaluate the impact of the public intervention (Trivellato, 2008). We cannot use an experimental design technique because firms are not assigned to the control group randomly, in fact a selection bias may occur as a result of two different causes: firm self selection and agency selection. Then we use the treatment effect model, which is a twostage selection model, where the first step aims to account for the selection bias, while the second step evaluates the impact of the incentive on the outcome while controlling for other causes. Our empirical analysis is based on information on a sample of 366 Italian firms that received at least one financial incentive for international growth outside the 2 See for example D.lgs. 29/1993.
European Union between 1996 and 2008 and on a sample of 498 potential applicants that internationalized without the support of the same public programme in the same period. Available sources of data provide information about the parent company’s structural and financial data, the outward FDI and the public incentive. Our data show that firms self select when ask for a public intervention and reveal that incentive are effective in stimulating firms’ productivity while data do not reveal any effects in terms of firms’ turnover growth.
The paper is structured as follows. The next section surveys the existing literature on the evaluation of public incentive. Section two carries out recognition of the programmes for outward internationalisation granted at the Italian level and describes the incentive under investigation (Law 100/24.4.1990). The third section presents the methodology, while the fourth one illustrates the data, the models, the econometric findings and the robustness analysis. Final comments and policy implications are reported in the last section.
1. The evaluation of public financial incentive
Industrial policy is framed by a complex set of measures played by governments in order to affect the allocation of resources that comes out from market relationships. Public subsidies aim at stimulating desirable firms’ attitude and moulding industry structure. Some policies provide firms with incentives to undertake industrial investments that strengthen their productivity and other performance measures, others target new firms establishment, R&D activities and local economic development. Hence, these government interventions would like to contribute to the economic and social wellbeing by affecting the resources allocation generated by market forces and by correcting market failures3.
Policy evaluation4 has proven to be rather complex and suffers from serious
methodological difficulties; indeed, it requires ad hoc monitoring systems, it needs to access to both administrative data (concerning incentives granted to firms) and economic and technological data (concerning strategies and performances of firms that received the incentives). Moreover, results are not univocal and heavily depend on the availability and quality of data, as well as on the aggregation level employed for the analysis.
Empirical studies insofar realized to evaluate the effects of public policies concern the additionality of both direct and indirect effects. In particular additionality is defined as whether a public intervention induces effects that would otherwise not have been occurred (Bondonio, 1998; Martini, Mo Costabella and Sisti, 2006). The scope of the definition varies across two different level of analysis: additionality can be limited to the analysis of an enterprise’s capacity to make new investments otherwise can be extend to the analysis of additional welfare at a more 3 For a review see Lerner (2002) and Pack and Saggi (2006). 4 Policy evaluation can be divide in two categories: process or formative evaluation and outcome or impact evaluation. The first one focuses on how programme is delivered while the second one (our case) focuses on program’s results. In the first case evaluation research aims to improve efficiency of public intervention, rather than effectiveness.
aggregate level. In both cases, effectiveness includes not only the extent to which a policy objective has been reached, but also the negative side effects: deadweight and displacement (Martini, Mo Costabella and Sisti, 2006; Mc Eldowney, 1997; Sisti, 2000). Together, they allow some assessment of the additional impact of public intervention. In particular deadweight is defined as the degree to which projects would have gone ahead without public intervention (Lenihan, 2004). While the focus in the second case is on a more aggregate level and displacement occurs among companies when public support crowds out private investments or generates negative effects on not benefiting firms. Public intervention that promotes private investment in a certain area may in fact draw resources from other areas, thus reducing the net impact of the subsidy (Lenihan, 1999; Tervo, 1990).
Most previous studies have shown that the degree of deadweight, at firm level, exists and varies significantly between investment projects with different characteristics (Lenihan, 2004). Public subsidies can only partially induce additional private investments (Luukonen, 2000; Pellegrini and Centra, 2006; Tokila, Haapanen and Ritsila, 2008) and then an expensive substitution may exists between public and private funds. In particular, international literature found that estimates of deadweight range from 8% to 80% (Lenihan, Hart and Roper, 2005). Also Italian firmlevel evidence suggests that subsidies have limited effectiveness (Faini and Schiantarelli, 1987; Pellegrini and Centra, 2006) and cause extra investment equal on average to 20% (Bronzini and De Blasio, 2006).
Beside additional investments, policy makers want to increase firms’ performance. In that sense the results are fairly mixed. Whilst researches do not provide definitive evidence about the impact on productivity, the most of empirical studies agree that incentives positively affect the firm size measured both in terms of employees and turnover (Bergstrom, 2000; Craig, Jackson and Thomson, 2008; Gabriele, Zamarian and Zaninotto, 2007, Martini, Mo Costabella and Sisti, 2006, Pellegrini and Centra, 2006; Skuras and Tzelepis, 2004). Opposite evidence is scarce (Ankarehem et al., 2009). In particular, when exists, firm’s growth is proportional to the subsidy (Hart et al., 2000). In particular, Lenihan (2004), by using different program evaluation methodology, finds mixed evidence. Also in the Italian context the results are controversial as regards the entity of the phenomenon. De Castris and Pellegrini (2005) estimate the net additionality in terms of employee as around 50% while many other studies reveal greater inefficiencies (Bronzini and De Blasio, 2006).
Instead, the same studies highlight that policies do not affect or have only marginal impact on firms’ productivity (Gabriele, Zamarian and Zaninotto, 2007; Pellegrini and Centra, 2006; Skuras and Tzelepis, 2004). At sectorial and regional level, Beason and Weinstein (1996), Harris and Trainor (2005) and Lee (1996) investigate the use of various industrial policy tools and find that the effects of subsidies on efficiency and productivity are negligible or negative. They argue that benefiting firms may perform worse because they run the risk of diverting into non productive activities. Subsidies can increase allocative inefficiencies if lower relative capital costs, lead firms to overinvest and encourage rentseeking behavior
by firms (Harris and Trainor, 2005). Other authors (Colombo and Grilli, 2007) argue that inefficiencies are generated by the allocation processes at the firm level as the outcome of agency selection processes. Beason and Weinstein (2001) explore the usage of various industrial tools and they find no evidence that firm’s productivity is enhanced as a result of any public intervention. The same results are found by Lee (1996) who demonstrates that industrial policy, such as tax incentives and subsidized credit, are not correlated with total factor productivity growth. Only Gabriele, Zamarian and Zaninotto (2007) demonstrate that public intervention can enhance productivity growth. By studying regional public subsidies, Bergstrom (2000) even shows that the productivity of subsidized firms increases in the short time but decreases in the longterm so much as their productivity becomes lower than that of nosubsidized firms. Only Harris and Trainor (2005) report mixed effects of business aid, but that depend on the industry examined and on the indicator measured. Italian studies provide similar results. Gabriele, Zamarian and Zaninotto (2007), Pellegrini and Centra (2006) and Bronzini and De Blasio (2006) find marginal or no effect of subsidies on productivity.
Taking as a basic principle that internationalization is good for homecountry welfare by contributing to the longterm competitiveness of domestic firms, especially of SMEs, financial incentive are launched to mitigate information and coordination failures in the international investment process that deter investments and increase the costs of internationalization by firms. Therefore, as the other financial incentive for private investments, public intervention aims at stimulating firms’ dimensional and productivity growth in the home countries (Merito, Giannangeli and Bonaccorsi, 2007).
Bearing in mind that policy evaluation has proven to be rather complex and suffers from serious methodological difficulties (Lundvall and Borras, 2005), in the present paper we aim at testing the impact of incentive, according to which the public agency can invest directly in foreign ventures, upon the firms’ domestic performance. In particular we think that public intervention can reduce economic and political risks, overcome uncertainties, and alleviate any shortfalls in resources and capabilities in a company embarking on the internationalization process or seeking to invest in an environment that is distant in geographical, cultural and institutional terms (Duran and Ubeda, 2001; Zaheer, 1995).
2. Italian public instruments for outward
internationalisation
Italy has traditionally been active in promoting both outward and inward FDI, and started to invest earlier than other European Union countries (UNCTAD, 1998). Nevertheless, from 20022007, the Italian Government spent about 900 million euro to promote outward investment and export, with about only 3 percent a year of industrial policy funds to be used for internationalization policy.In particular, since the late 1990s, the Italian Government has supported the outward internationalization of its firms through the creation of a public agency, SIMEST, whose purpose is to promote foreign joint ventures outside the European
Union and by providing technical and financial support. SIMEST, established as a limited company in 1990 (Law 100/24.4.1990), is a public–private partnership controlled by the Ministry of Economic Development (76%), while private shareholders include banks and industrial business organizations. SIMEST was found to promote or otherwise influence outward FDI through both financial and non financial incentives. Internationalization is a process demanding substantial capabilities and resources, with the access to capital being a critical aspect. Financial support for internationalization corrects for financial market imperfections, increases the profitability of investments and reduces the economic risk related to the foreign context. Nonfinancial incentives (e.g. provision of information, as well as technical, legal, fiscal and administrative assistance) seek to relax the limits due to bounded resources and capabilities in a company embarking on the internationalization process; focused information and assistance are expected to reduce contextualization costs and consequently to increase the odds in favor of success.
In particular SIMEST has supported the outward internationalisation through the direct acquisition of equity in Italian firms’ direct investments abroad and interest rate support on bank financing of the Italian share of investments in foreign companies in which public agencies have a stake (Law 100/24.4.1990). Another financial measure is the provision of venture capital funds for investments outside the European Union (Law 296/2006). There are also incentives financing the creation of commercial structures abroad, feasibility studies and technical assistance (Law Decree 143/1998; Ministerial Decree 136/2000). Nonfinancial measures include the provision of information as well as the provision of technical, legal, fiscal and administrative assistance for internationalization projects. This paper focuses on Law 100/24.4.1990, executed by SIMEST, which promote the provision of capital loans at interest rates below the market rate that are not paid back in case of failure of the foreign project (Law 394/1981). Public agency can directly acquire up to 25% of the equity of a foreign venture5, and benefiting firms agree to buy back the agency equity share within eight years6. Although the agency can accept all types of investment proposals, priority is given to initiatives by SMEs7 investing in Eastern Europe. Projects in the same sector as the parent company are encouraged, while the support programmes exclude FDIs in the European Union and FDIs that entail the divestment of R&D, sales or production activities in Italy (Law 80/2005). Italian Government have designed programmes to help firms, SMEs in particular, to overcome obstacles and then to encourage the internationalization process. Specifically, as previously asserted, the promotion of outward FDI seeks to reduce economic and political risks, to overcome uncertainties, and to alleviate any
5 Since 2005 SIMEST is permitted to acquire up to 49% of the equity of a foreign venture.
6 Analogous incentives are allocated by Finest. Finest was founded in1992 as an investment
company (Law 19/1991). It operates in NorthEastern Italy (Friuli Venezia Giulia, Veneto and Trentino Alto Adige) and its main shareholders are local public administration and SIMEST.
7 The category of SMEs is made up of enterprises which employ fewer than 250 persons and
which have an annual turnover not exceeding 50 million euro and/or an annual balance sheet total not exceeding 43 million euro (Law 124/2003, 2003/361/CE).
shortfalls in resources and capabilities in a company embarking on the internationalization process in order to ensure domestic growth and competitiveness (Ministry of Economic Development, 2005). Based on the argument exposed above, we identify turnover growth and productivity performance as two good proxies for evaluate the effects of public intervention.
From the start of operations up to the end of 2008 SIMEST acquired shareholdings in 545 foreign companies and subscribed 183 capital increases and revisions for a total of € 490.6 million in more than 50 countries. In 2008, SIMEST’s portfolio of equity investments earned a return of € 10 million. In recent years SIMEST field between 100 and 200 applications per years and approve about 60 project a year (Table 1).
The geographical distribution of the 545 companies in which SIMEST had invested by the end of 2008 is as follows: 43% in Central and Eastern Europe; 20% in Asia and Oceania; 13% in Central and South America; 10% in the Mediterranean and the Middle East; 6% in North America; 6% in the C.I.S. countries and the Baltic Republics; 2% in SubSaharan Africa. The recent investments mainly regard countries in the South East of Asia (45%) and in particular in 2008 the country with the large number of acquisitions is China (11), followed by Tunisia (3). The largest share of acquisitions comes in the engineering sector (35%), followed by textiles and clothing (23%) and rubber and plastics (19%). The incentives are mainly granted in the North of Italy, in particular in 2008 the region with the large number of incentive is Lombardia (13), followed by Piemonte (5) and Emilia Romagna (4). As regards the size of the Italian companies promoting investment abroad, SMEs are preponderant in terms of number of financed project (60% from 2006), however in terms of euro the 60% of funds in 2008 were assigned to bigger firms.
3. The methodology
In order to evaluate public policies there is no universal evaluation technique but several methods coming from different disciplines from which the evaluator can choose the most appropriate according to the contingency. Evaluation studies exploit different theories based on several epistemological assumptions. Nevertheless, there is a common base that is the willingness to analyze the actual change caused by a public programme highlighting its causeeffect relation with its outcome. (Blundell and Costa Dias, 2000; Heckman, 2001; Marschak, 1953). Therefore the most appropriate methodological approach to provide a solid scientific evaluation seems to be the counterfactual one (Martini, Mo Costabella and Sisti, 2006; Moffit, 1991). Whilst in the past evaluators based their analyses on the basis of personal intuition, nowadays they want to empirically test whether a policy measure induce effects that would otherwise not have been take place. Then the fundamental need for all public policy evaluations is to observe the counterfactual conditions to answer the causal question as to whether the observed outcomes are effectively caused by the public policy and not by other determinants. For these reasons many tools for data analysis work with control groups (Bartik and Bingham, 1997).Several surveys (e.g. Heckman, 2001; Imbens, 2004) highlight difficulties in scientific assessment of public policies. In particular two are the threats of validity: omitted variables and selection bias (Bartik and Bingham, 1997). Because it is impossible to determine exactly what would happen in the absence of the incentive, we need a methodology that allows us to compute an average effect of incentive comparing data on participants and nonparticipant firms and to identify the causal relationship between the incentive and the outcome, controlling for other possible determinants of the outcome itself (Trivellato, 2008). Additionally, one has to account for the possible selection bias (Heckman, 1979). Besides the effect of the incentive, there may be systematic differences between benefiting firms and not benefiting firms that may affect the impact of the incentive (Heckman, 2001; Rossi, Lipsey and Freeman, 2004). In particular a selection bias may occur as a result of two different causes: firms’ selfselection and agency selection (Blanes and Busom, 2004). In the first case, firms that apply for the incentive may not be representative of the total population of eligible firms, while in the second one the agency accepts only the applications that meet selection criteria. Both phenomena make the incentive allocation not a random process and systematic differences between benefiting and not benefiting firms may exist (Martini, Mo Costabella and Sisti, 2006). Therefore, to overcome threats of validity, omitted variables and selection bias, it is necessary to impute an appropriate counterfactual outcome for the sample of benefiting firms. In the present study, we can’t use matching methods (Rubin, 1973) because the control group is too small. Then we use the treatment effect model, which is a two stage selection model, where the first step aims to account for the selection and self selection bias, while the second step evaluates the impact of the incentive on the outcome while controlling for other causes (Lee, 2005; Maddala, 1983). Namely, two regressions are estimated simultaneously: the first one is a probit regression predicting the probability of receiving the incentive, and the second one is a linear regression for the outcome (i.e. domestic firm’s growth) as a function of the treatment variable (i.e. the incentive), controlling for other observable explanatory variables that affect a firm’s domestic performance. Theoretically, the solution is to propose and then estimate a model of the selection and selfselection decision, that is, to define an incentive assignment equation. In particular xi is the set of exogenous
covariates that affect the incentive assignment and that could explain different attitudes between benefiting and not benefiting firms.
The model assumes that D*i, the probability of receiving the incentive, is a linear
function of the observed covariates xi and the random component i. Specifically, we
assume that the incentive assignment is determined by:
[1] D*i = xi + i (Selection equation)
The endogenous binary variable Di is modeled as the outcome of the
unobservable latent variable D*i, and the observed decision is:
[2] Di = 1, if D*i > 0
The second step is a linear regression for the outcome yi (i.e. domestic firm’s
productivity and turnover growth) as a function of the treatment variable as estimated in the first step (Di), controlling for other observable explanatory variables
(wi):
[4] yi = wi + Di + ui (Valuation equation)
The estimated sign of will be used to assess the effectiveness of the public aid (Di). Specifically, when > 0 the public incentive stimulate the benefiting firm’s
performance.
4. The empirical analysis
4.1. Data
The dataset used in the empirical analysis combines three sources of data: Reprint8, that provide information on outward FDIs (Mariotti and Mutinelli, 2008);
the balance sheets of SIMEST9, which provide information about the incentives
granted to outward Italian projects; and AIDA (Bureau van Djick), that provides structural and financial data for Italian public limited companies. The dataset obtained by merging the above sources includes information on 366 FDIs backed by public incentives between 1996 and 2008 and 498 FDIs that received no support from SIMEST in the same period and in the same destination countries.
Table 2 provides preliminary tests of the differences between firmspecific and projectspecific features of FDIs launched with and without public financial support. The highly significant differences between the two groups provide preliminary evidence of the opportunity to investigate the likelihood of obtaining an incentive based on firm behaviour. The incentives are mainly granted to firms located in the North of Italy and SMEs are preponderant in terms of number of financed project (70%), nevertheless, on average, treated firms are quite big (59 million euro). The acquisition of a majority share in the foreign venture as well as the willingness to invest in smaller projects characterize the benefiting firms.
4.2. The model and the variables
Selecting the appropriate outcome variables for the impact analysis stems for clearly highlighting the causal links from public incentives to desirable outcomes10.According with the policy maker objective we analyze the influence of public financing on SMEs’ competitiveness (Ministry of Economic Development, 2005) and in line with traditional empirical literature, we recognize the growth of turnover and productivity at the firm level as two good proxies for the effects of industrial policy measures (Bergström, 2000; Craig, Jackson and Thomson, 2008; Fisher and Reuber, 2003). In particular our evaluation model refers to a classical ex post
8 Reprint is a database that provides a census of both outward and inward FDIs in Italy beginning
in 1986
9 http://www.simest.it/frameset.asp
10 It often happens that policy maker define multiple and conflicting objectives for which it is
evaluation (Wollmann, 2007) where two dependent variables are identified and then two models are tested. As far as the model, we adopted a traditional two steps treatment effect model. In particular, as previously illustrated, in order to evaluate the impact of incentive, it is necessary to take into account selection and self selection biases and then causality.
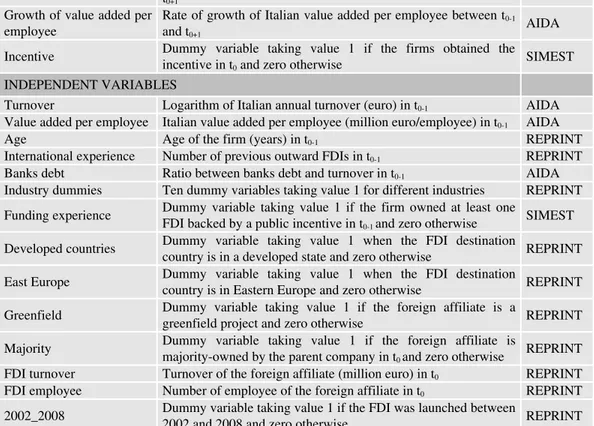
Therefore, our dependent variables for the two steps are:
1. Incentive is a dummy variable of the first step in both models (i.e. probit model) taking value 1 if the firm obtained the incentive in t0 and 0 otherwise, where t0 is the year of the
allocation of the subsidy for benefiting firms and the year of the foreign project for the not benefiting firms in control group; 2. Growth of turnover is the dependent variable of the second step (i.e. first model) measured by the rate of growth of the turnover of the Italian parent company between (t0 – 1) and (t0 + 1); 3. Growth of value added per employee is the dependent variable of the second step (i.e. second model) measured by the rate of growth of the value added per employee of the Italian parent
company between (t0 – 1) and (t0 + 1).
As far as the first stage (i.e. selection and selfselection), explanatory variables include the firm’s financial and structural characteristics and the project’s features, which may affect the access to incentive. Policy guideline for the selection of benefiting project are not too restrictive, notwithstanding this information gathering, reporting activities and form completion represent potential obstacles to actual participation and then can induce firms self selection (Merito, Giannangeli and Bonaccorsi, 2007; Sarmah, 2003). As managerial capabilities reduce the costs of applying and increase the likelihood of selfselection in submitting a request, we expect that larger firms will be more likely to apply for an incentive, due to their greater managerial resources and competences (Blanes and Busom, 2004). Additionally, firms that have previously participated in the same programme might benefit from learning effects and use their experience for submitting projects that are more suitable for funding (Duguet, 2004). Moreover subsidies help internationalising firms to overcome their financial constraints and reduce the cost of the internationalisation process. Consequently, we expect a positive relationship between the financial constraints perceived by a firm and the probability of self selection in applying for public funds (De Maeseneire and Clays, 2007). We proxy the firms’ financial constraints by the ratio between their bank debt and turnover. Modes of entry involving higher levels of commitment, higher transaction costs and higher investment costs (i.e. greenfield projects, foreign majority stakes and project size), are expected to positively influence a firm’s decision to apply for public intervention. In addition, a dummy variable controls for temporal heterogeneity caused by the greater availability of public funding from 2002 onwards.
As previously mentioned, SIMEST allocates incentives according to selective funding practices. Policy guidelines (Law 100/24.4.1990) state that agency should favor SMEs and investments in Eastern Europe. Two dummy variables are consequently added to our estimates to determine whether the projects with these
characteristics have a higher probability to receive a subsidy. Therefore, our selection equation is: [5] Prob (Incentive=1) = + X + Z + where X is vector for firm characteristics (size, funding experience and banks debt), while Z is the vector for the project features (size, destination country, mode of entry and year). The second stage of the analysis estimates the effect of the incentive on Italian firms’ performance, conditional on other causes. The effect of the incentive to promote outward FDI on domestic firm’s growth may be moderated by several factors that directly affect growth themselves. Variables considered refer again to firm’s structural characteristics, financial constraints and other specific features of the internationalization project. Compared with the first step we include also firm age, the number of previous outward FDIs and the industry11. Therefore, the linear regression function for the second step of the first model is: [6] Growth of turnover = + Incentive + X + Z + u While the linear regression function for the second step of the second model is: [7] Growth of value added per employee = + Incentive + X + Z + u where X is vector for firm characteristics (size, age, international experience, banks debt, industry and value added per employee; the last variable is included only in the second model), while Z is the vector for the project features (size and destination country). The dependent and the explanatory variables are described in Table 3.
4.3. Econometric findings
The results of the empirical estimates for the treatment model are reported in Table 4 and 5. As far as the selection model is concerned, our results confirm that both the characteristics of Italian firm and the FDI features affect the likelihood of receiving the incentive (i.e. rho different from zero). The understanding of the first step helps to draw the counterfactual scenario and provides important clues about what pieces of information are crucial for the effectiveness of the evaluation process. As the selection guidelines favour initiatives by small firms, the coefficient of the variable Turnover is negative and significantly different from zero at p < 0.01. Also firms that have made previous successful applications to the same programme are more likely to participate in the public financial incentive (Funding experience is positive and significant at p < 0.01). Firms with high financial constraints are also more likely to participate, the higher the total amount of banks debt, the higher the likelihood to apply for and obtain a public incentive (Banks debt is positive and significant at p < 0.01). Consistent with the guidelines stated by the laws the regression shows a significant coefficient for initiatives in Eastern Europe (East_Europe is positive and significant at p < 0.01). On the contrary, the size of the11 Ten industry dummies were considered: services; wood products; raw materials; chemical and
pharmaceutical; building and construction; electronics; industrial machinery; automotive; food, tobacco and beverages; textile; with plastic and rubber as the baseline.
affiliate contribute negatively to the incentive assignment (FDI turnover is negative and significant at p < 0.01). The mode of entry also positively influences the probability of obtaining a public incentive (Greenfield and Majority are both positive and significant at p < 0.01).
As far as the valuation equation, that is our second stage, is concerned, the results confirm the positive and significant effect of public financial incentives on firms’ domestic productivity growth (Growth of Italian value added per employee is positive and significant at p < 0.05), while they don’t reveal any causality between the public intervention and the Italian turnover growth12. Concerning the remaining
variables, smaller and younger companies grow more rapidly in terms of productivity (Turnover and Age are negative and significant at p < 0.01). On the contrary age of firm does not have any impact on the turnover growth of the Italian company. Also the international experience and banks debt do not have any impact. The only negative impact comes from Turnover.
Moreover the parent’s growth, both in terms of turnover and productivity, do not seem to crucially depend on the characteristics of the foreign initiative (FDI Employee and Developed countries are both not significant factors).
4.4. Robustness analysis
Pursuing international growth through public incentives, firms probably do not carry out delocalization investments. The public agency in fact would not grant them since these investments involve the closure of Italian establishments13. For these reasons in the group of benefiting firms are not included investments that imply the delocalization of Italian activities. Robustness analysis can help us discover the side effects of delocalisation on Italian firms’ growth. Unfortunately the present empirical analysis had to cope with missing information, in the control group, on foreign project which imply the delocalisation of Italian activity. We try to relax this limitation in three different way: first we test the impact of the incentive upon the firms’ domestic consolidated turnover, second we include a proxy for delocalisation in the second stage (a dummy variable taking value 1 when the Italian employee decrease between (t0 – 1) and (t0 + 1)) and third we exclude the firms characterizedby dummy variable equal to one from the control group.
The results of the empirical estimates for the treatment models upon the firms’ consolidated turnover (Table 6) confirm that any causality exists between the public intervention and the Italian consolidated turnover growth. The estimates also confirm the positive and significant effect (at p < 0.05) on firms’ domestic productivity growth and the not significative impact on turnover (Table 7) when disinvesting firms are excluded from the second stage.
12 We developed the empirical analysis also using a measure of profitability as dependent variable
(i.e. ROI, Return on Investment), however the analysis is based on information on a small sample of 247 Italian firms. For this reason we do not include the estimates in the paper.
13 We thank the anonymous Referee for comments and suggestions for improvement of our
Finally, in the model were a proxy for delocalisation is included in the second stage, the results are the same previously found (Table 8) and the dummy comes out not significantly different from zero. In conclusion, the estimates confirm the robustness of the results and the positive effects of the financial incentive on firms’ domestic productivity growth while no evidence comes out in terms of domestic turnover growth.
Conclusions
This is (one of) the first attempts to develop a rigorous evaluation of a policy for the firms’ outward internationalization. We thus hope to contribute to the discussion of the effects of these policies in what respects their impact on parent firm performance.The empirical evidence, after accounting for selection and selfselection bias, shows that Italy’s scheme (Law 100/24.4.1990) has reached some degree of effectiveness in the sense of promoting parent companies’ performance. However, contrary to the literature, we found positive effects of the financial incentive on the benefiting firm’s productivity growth as compared to the counterfactual sample but no effects are highlighted in terms of turnover growth. Specifically, our results show that financial incentive does help smaller and younger companies to enhance their performance. The Government involvement in FDI may have contributed to reduce the cost of capital, uncertainty and risk associated with investing in an unfamiliar host country (Henisz and Zelner, 2003) which is more critical for smaller firms (Wright, Weasthead and Ucbasaran, 2007; Zaheer, 1995). Although several times has been highlighted the need of a proper evaluation of public incentives to the firms, systematic analyses are very scant and empirical techniques insofar employed to evaluate the effects of public policies and incentives concern mainly direct effects, defined in terms of the achievement of the objective declared by the policy maker (Evangelista, 2007). Therefore, it does emerge the need of widening the evaluation of policies in order to capture not only temporal lags that are wider than the ones foreseen, but also effects that were not originally declared by the policy maker, and that might interest other actors, sectors and local contexts. Then the effects of public incentives may be also evaluated as far as their indirect impact (associated to externalities and spillovers) is concerned. Of course, the specification of the model presented above should be improved by introducing more adequate measures of certain phenomena and by including in the control group the firms that applied for but do not received the incentive. Unfortunately data are not yet available. Moreover, our results concern a single type of incentive addressing firms’ internationalization, while a comparative analysis of alternative mechanisms would certainly provide useful suggestions to policy makers for the design of appropriate tools and the improvement of existing ones. Table 1 – SIMEST report on operation 19912008 2008 2007 No. Million Euro No. Million Euro No. Million Euro
HIGHLIGHTS Profit for the year 121.0 10.0 9.0 Dividends and bonus shares 66.5 6.3 6.3 INVESTMENT ABROAD Projects approved New projects 988 855.2 49 84.3 76 80.0 Project supplements and revision 171 99.4 16 5.7 13 1.6 Equity investments acquired New equity investments 545 413.8 31 32.9 45 37.7 Capital increases and revisions 183 76.8 14 4.2 19 4.3 Fully operational projects Capital spending 21.343 1.306 710 Equity capital 8.690 624 523 Sources: SIMEST’s balance sheets Table 2 – Comparison between benefiting firms and non benefiting firms (control group) BENEFITING FIRMS NON BENEFITING FIRMS (366) (498) SIGN. DEPENDENT VARIABLES Turnover growth (%) a 0.40 0.05 * Value added per employee growth (%) a 0.18 0.06 *** INDEPENDENT VARIABLES Structural and financial characteristics of Italian firm Turnover (million euro) b 9.03 5.59 ***
Value added per employee (million
euros/employee) b 73.61 97.49 ***
Age (years) b 26 27
International experience (number of
outward FDIs) b 11 60 *** Banks debt (%) a 34.12 28.07 *** Funding experience (%) c 20.53 6.69 *** Project specific features Developed countries (%) c 16.05 43.31 *** East Europe (%) c 60.26 16.93 *** Greenfield (%) c 59.39 41.54 *** Majority (%) c 90.00 84.47 ** FDI turnover (million euro) b 274.18 563.41 *** FDI employee (number of employee) b 118 113 * significant at the 10% level; ** significant at the 5% level; ***significant at the 1% level a = MannWhitney Test; (mean) (%) b = t Test; (mean) c = ProportionTest; (median) (%) Sources: SIMEST’s balance sheets, Database Reprint and Database Aida Bureau van Dijk Table 3 – Variables and data sources
VARIABLES DESCRIPTION SOURCE
DEPENDENT VARIABLES
t0+1
Growth of value added per
employee Rate of growth of Italian value added per employee between tand t0+1 01 AIDA
Incentive Dummy variable taking value 1 if the firms obtained the incentive in t
0 and zero otherwise SIMEST
INDEPENDENT VARIABLES
Turnover Logarithm of Italian annual turnover (euro) in t01 AIDA
Value added per employee Italian value added per employee (million euro/employee) in t01 AIDA
Age Age of the firm (years) in t01 REPRINT
International experience Number of previous outward FDIs in t01 REPRINT
Banks debt Ratio between banks debt and turnover in t01 AIDA
Industry dummies Ten dummy variables taking value 1 for different industries REPRINT Funding experience Dummy variable taking value 1 if the firm owned at least one FDI backed by a public incentive in t
01 and zero otherwise SIMEST
Developed countries Dummy variable taking value 1 when the FDI destination country is in a developed state and zero otherwise REPRINT East Europe Dummy variable taking value 1 when the FDI destination country is in Eastern Europe and zero otherwise REPRINT Greenfield Dummy variable taking value 1 if the foreign affiliate is a greenfield project and zero otherwise REPRINT Majority Dummy variable taking value 1 if the foreign affiliate is majorityowned by the parent company in t
0 and zero otherwise REPRINT
FDI turnover Turnover of the foreign affiliate (million euro) in t0 REPRINT
FDI employee Number of employee of the foreign affiliate in t0 REPRINT
2002_2008 Dummy variable taking value 1 if the FDI was launched between 2002 and 2008 and zero otherwise REPRINT
Sources: SIMEST’s balance sheets, Database Reprint and Database Aida Bureau van Dijk
Table 4 – Empirical results, growth of Italian turnover (two steps treatment effect model)
TREATMENT EFFECTS MODEL
TWO STEPS ESTIMATES (864 observations) COEFF. STD. ERR. DEPENDENT VARIABLE: Growth of Italian turnover Incentive 0.077 0.461 Structural and financial characteristics of Italian firm Turnover 0.345 ** 0.149 Age 0.005 0.005 International experience 0.002 0.002 Banks debt 0.004 0.004 Industry dummies Yes Project specific features Developed countries 0.134 0.251 FDI employee 0.000 0.000 Constant 3.037 ** 1.215 DEPENDENT VARIABLE: Incentive Turnover 0.280 *** 0.062 Funding experience 0.735 *** 0.151 Banks debt 0.006 *** 0.002 FDI turnover 0.000 *** 0.000 East Europe 1.138 *** 0.103 Greenfield 0.605 *** 0.130 Majority 0.401 *** 0.153 2002_2008 0.269 *** 0.103 Constant 0.598 0.516
Hazard Lambda 0.262 0.296 Rho 0.085 Sigma 3.063 * significant at the 10% level; ** significant at the 5% level; ***significant at the 1% level Sources: SIMEST’s balance sheets, Database Reprint and Database Aida Bureau van Dijk Table 5 – Empirical results, growth of Italian value added per employee (two steps treatment effect model) TREATMENT EFFECTS MODEL
TWO STEPS ESTIMATE (815 observations) COEFF. STD. ERR. DEPENDENT VARIABLE: Growth of Italian value added per employee Incentive 0.334 ** 0.184 Structural and financial characteristics of Italian firm Turnover 0.002 *** 0.061 Value added per employee 0.162 *** 0.001 Age 0.009 *** 0.002 International experience 0.001 0.001 Banks debt 0.002 0.002 Industry dummies Yes Project specific features Developed countries 0.025 0.099 FDI employee 0.000 0.000 Constant 0.609 * 0.484 DEPENDENT VARIABLE: Incentive Turnover 0.238 *** 0.066 Funding experience 0.688 *** 0.154 Banks debt 0.008 *** 0.002 FDI turnover 0.000 *** 0.000 East Europe 1.144 *** 0.107 Greenfield 0.608 *** 0.133 Majority 0.373 ** 0.155 2002_2008 0.229 ** 0.106 Constant 0.282 0.545 Hazard Lambda 0.181 0.117 Rho 0.154 Sigma 1.170 * significant at the 10% level; ** significant at the 5% level; ***significant at the 1% level
Sources: SIMEST’s balance sheets, Database Reprint e Database Aida Bureau van Dijk
Table 6 – Empirical results, growth of Italian consolidated turnover (two steps treatment effect model)
TREATMENT EFFECTS MODEL
TWO STEPS ESTIMATES (477 observations) COEFF. STD. ERR. DEPENDENT VARIABLE: Growth of Italian consolidated turnover
Incentive 0.367 0.344
Structural and financial characteristics of Italian firm
Age 0.002 0.003 International experience 0.008 *** 0.001 Banks debt of the group 0.001 0.004 Industry dummies Yes Project specific features Developed countries 0.410 ** 0.162 FDI employee 0.003 0.000 Constant 10.853 *** 1.318 DEPENDENT VARIABLE: Incentive Consolidated turnover 0.439 *** 0.111 Funding experience 0.896 *** 0.182 Banks debt of the group 0.006 * 0.003 FDI turnover 0.000 * 0.000 East Europe 0.956 *** 0.156 Greenfield 0.660 *** 0.180 Majority 0.341 0.216 2002_2008 0.334 ** 0.150 Constant 1.800 0.516 Hazard Lambda 0.051 0.221 Rho 0.034 Sigma 1.523 * significant at the 10% level; ** significant at the 5% level; ***significant at the 1% level
Sources: SIMEST’s balance sheets, Database Reprint e Database Aida Bureau van Dijk Table 7 – Empirical results, growth of Italian turnover including in the sample only the firms that didn’t delocalized their activity (two steps treatment effect model) TREATMENT EFFECTS MODEL TWO STEPS ESTIMATES (494 observations)
COEFF. STD. ERR. COEFF STD. ERR. DEPENDENT
VARIABLE Growth of Italian turnover Growth of Italian value added per employee
Incentive 0.106 0.091 0.240 ** 0.114
Structural and financial characteristics of Italian firm
Turnover 0.085 *** 0.031 0.059 0.039
Value added per
employee 0.002 *** 0.000
Age 0.002 ** 0.001 0.003 ** 0.001
International
experience 0.000 0.000 0.001 ** 0.001
Banks debt 0.000 0.001 0.000 0.001
Industry dummies Yes Yes
Project specific features Developed countries 0.057 0.049 0.020 0.060 FDI employee 0.000 0.000 0.000 0.000 Constant 0.849 *** 0.252 0.202 * 0.311 DEPENDENT VARIABLE: Incentive Turnover 0.260 *** 0.110 0.238 *** 0.090 Funding experience 0.463 ** 0.186 0.459 ** 0.187
Banks debt 0.006 ** 0.003 0.006 ** 0.003 FDI turnover 0.000 0.000 0.000 *** 0.000 East Europe 1.081 *** 0.143 1.064 *** 0.145 Greenfield 0.492 *** 0.172 0.434 *** 0.173 Majority 0.276 0.199 0.280 0.199 2002_2008 0.514 0.137 0.484 0.137 Constant 0.577 0.730 0.450 0.738 Hazard Lambda 0.018 0.059 0.155 0.073 Rho 0.039 0.281 Sigma 0.449 0.551 * significant at the 10% level; ** significant at the 5% level; ***significant at the 1% level
Sources: SIMEST’s balance sheets, Database Reprint e Database Aida Bureau van Dijk
Table 8 – Empirical results, growth of Italian turnover including a dummy variable for delocalization (two steps treatment effect model)
TREATMENT EFFECTS MODEL
TWO STEPS ESTIMATES (447 observations) COEFF. STD. ERR. DEPENDENT VARIABLE: Growth of Italian turnover Incentive 0.488 0.915 Structural and financial characteristics of Italian firm Turnover 0.617 ** 0.282 Dummy delocalisation 1.208 0.513 Age 0.007 0.009 International experience 0.002 0.002 Banks debt 0.009 0.009 Industry dummies Yes Project specific features Developed countries 0.365 0.454 FDI employee 0.000 0.001 Constant 0.632 ** 0.274 DEPENDENT VARIABLE: Incentive Turnover 0.094 0.095 Funding experience 0.879 *** 0.185 Banks debt 0.006 * 0.003 FDI turnover 0.000 * 0.000 East Europe 1.041 *** 0.158 Greenfield 0.839 *** 0.181 Majority 0.197 0.217 2002_2008 0.273 * 0.151 Constant 1.052 0.807 Hazard Lambda 0.555 0.584 Rho 0.134 Sigma 4.142 * significant at the 10% level; ** significant at the 5% level; ***significant at the 1% level Sources: SIMEST’s balance sheets, Database Reprint and Database Aida Bureau van Dijk
*
Ankarhem M., Daunfeldt S., Quoreshi S., Rudholm N. 2009. Do regional investment grants improve firm performance? Evidence from Sweden. Ratio
Working Papers 137.
Bartik T.J., Bingham R.D. 1997. Can economic development programs be evaluated?, in Bingham R.D., Mier R. (eds.) Dilemmas of Urban Economic
Development. Issues in Theory and Practice. Sage Publications: Thousand Oaks.
Beason R., Weinstein D. 1996. Growth, economies of scale, and targeting in Japan (19551990). The Review of Economics and Statistics, 78 (2): 286295.
Bellak C., Leibrecht M., Stehrer R. 2010. The role of public policy in closing foreign direct investment gaps: an empirical analysis. Empirica, 37 (1): 1946
Bergstrom F. 2000. Capital subsidies and the performance of firms. Small
Business Economics, 14 (3): 183193. Blanes J.V., Busom I. 2004. Who participates in R&D subsidy programs? The case of Spanish manufacturing firms. Research Policy, 33 (10): 14591476. Blundell R., Costa Dias M. 2000. Evaluation methods for nonexperimental data. Fiscal Studies, 21 (4): 427468. Bondonio D. 1998. La valutazione d’impatto dei programmi di incentivo allo sviluppo economico. Economia Pubblica, 6: 2352. Brancati R. (a cura di) 2008. Rapporto MET 2008. Le politiche per le imprese nelle regioni italiane. Donzelli editore: Roma. Bronzini R, De Blasio G. 2006. Evaluating the impact of investment incentives: the case of Italy’s law 488/92. Journal of Urban Economics, 60 (2): 327349. Colombo G., Grilli L. 2007. Technology policy for the knowledge economy: public support to young ICT service firms. Telecommunications Policy, 31 (1011): 573591.
Craig B.R., Jackson W.E., Thomson J.B. 2008. Credit market failure intervention: do government sponsored small business credit programs enrich poorer areas?. Small Business Economics, 30 (4): 345360. De Blasio G., Lotti F. (a cura di) 2008. La valutazione degli aiuti alle imprese. il Mulino: Bologna. De Castris M., Pellegrini G. 2005. Complementarietà e sostituzione tra diverse politiche di sviluppo locale: i contratti di programma e la legge 488/92. Rassegna Italiana di Valutazione, 32: 7996.
De Maeseneire W., Claeys T. 2007. SMEs, FDI and financial constraints.
Working Paper Series 2007/25.
Duguet E. 2004. Are R&D subsidies a substitute or a complement to privately funded R&D? Evidence from France using propensity score methods for non experimental data. Review d’Economie Politique, 114 (2): 263292.
Duran J.J., Ubeda F. 2001. The efficiency of government promotion for outward FDI: the intention to invest abroad. Multinational Business Review, 9 (2): 2432.
Evangelista R. 2007. Rilevanza e impatto delle politiche dell’innovazione in Italia. Prime indicazioni fornite dalle indagini CIS. Economia e politica industriale, 34 (1):103124.
Faini R., Schiantarelli F. 1987. Incentives and investment decisions: the effectiveness of regional policy. Oxford Economics Papers, 39 (3): 516533. Fisher E., Reuber R. 2003. Support for rapid growth firms: a comparison of the views of founders, government policymakers, and private sector resource providers. Journal of Small Business Management, 41 (4): 346365. Gabriel M.T. 2009. Measuring the Efficiency of Investment Promotion Agencies. Sudwestdeutscher Verlag Fur Hochschulschrifte: Saarbrücken. Gabriele R., Zamarian M., Zaninotto E. 2007. Gli effetti degli incentivi pubblici agli investimenti industriali sui risultati di impresa. L’Industria, 2: 265280. Guisinger S. 1992. Rhetoric and reality in international business: a note on the effectiveness of incentives. Transnational Corporations, 1 (2): 111123. Harris R., Trainor M. 2005. Capital subsidies and their impact on total factor productivity: firmlevel evidence from Northern Ireland”. Journal of Regional
Science, 45 (1): 4974.
Hart M., McGuinness S., O’Reilly M., Gudgin G. 2000. Public policy and SME performance: the case of Northern Ireland in the 1990s. Journal of Small Business
and Enterprise Development, 7 (1): 2741.
Heckman J.J. 2001. Micro data heterogeneity, and the evaluation of public policy: Nobel lecture. The Journal of Political Economy, 109 (4): 673748. Henisz W.J., Zelner B.A. 2003. The strategic organisation of political risk and opportunities. Strategic Organization, 1 (4): 451460. Imbens G.W. 2004. Nonparametric estimation of average treatment effects under exogeneity: a review. The Review of Economics and Statistics, 86 (1): 429. Lee J.W. 1996. Government intervention and productivity growth. Journal of Economic Growth, 1 (3): 391414. Lee M.J. (ed.) 2005. MicroEconometrics for Policy, Program, and Treatment Effects. Oxford University Press: New York. Lenihan H. 1999. An evaluation of a regional development agency’s grants in terms of deadweight and displacement. Environment and Planning C: Government and Policy, 17 (3): 303318. Lenihan H. 2004. Evaluating Irish industrial policy in terms of deadweight and displacement: a quantitative methodological approach. Applied Economics, 36 (3): 229252. Lenihan H., Hart M., Roper S. 2005. Developing an evaluative framework for industrial policy in Ireland: fulfilling the audit trail or an aid to policy development. Quarterly Economic Commentary: Special Articles, 2: 117. Lerner J. 2002. When bureaucrats meet entrepreneurs: the design of effective public venture capital programmes. The Economic Journal, 112 (477): 7384.
Lundvall B., Borras S. 2005. Science, technology and innovation policy, in Fagerberg J., Mowery D., Nelson R. (eds.) The Oxford Handbook of Innovation. Oxford University Press: New York.
Luukkonen T. 2000. Additionality of EU framework programs. Research Policy, 29 (6): 711724.
Maddala G.S. (ed.) 1983. LimitedDependent and Qualitative Variables in
Econometrics. Cambridge University Press: Cambridge (UK).
Mariotti S., Mutinelli M. (a cura di) 2008. Italia multinazionale 2008. Le
partecipazioni italiane all’estero ed estere in Italia. Rubbettino Editore: Soveria Mannelli. Marschak J. 1953. Economic measurements for policy and prediction, in Hood W.C., Koopmans T.C. (eds.) Studies in Econometric Method. Wiley: New York. Martini A., Mo Costabella L., Sisti M. 2006. Valutare gli effetti delle politiche pubbliche: metodi e applicazioni al caso italiano. Formez: Roma.
McEldowney J. 1997. Policy evaluation and the concepts of deadweight and additionality: a commentary. Evaluation, 3 (2): 175188.
Merito M., Giannangeli S., Bonaccorsi A. 2007. Gli incentivi per la ricerca e sviluppo industriale stimolano la produttività della ricerca e la crescita delle imprese? Evidenza sul caso italiano. L’Industria, 28 (2): 221241.
Ministry of Economic Development. 2005. Linee di indirizzo per l’attività
promozionale 2005. Ministry of Economic Development: Roma.
Moffit R. 1991. Program evaluation with nonexperimental data. Evaluation
Review, 15 (3): 291314. Oxelheim L., Ghauri P. (eds.) 2004. European Union and the Race for Foreign Direct Investment in Europe. Elsevier: Oxford (UK). Pack H., Saggi K. 2006. Is there a case for industrial policy? A critical survey. The World Bank Research Observer, 21 (2): 267297. Pellegrini G. 2003. L’esperienza di valutazione delle politiche di incentivazione alle imprese. Paper presentato al congresso Il contributo della valutazione alle
politiche locali, Reggio Calabria, 1011 April.
Pellegrini G., Centra M. 2006 Growth and efficiency in subsidized firms. Workshop The Evaluation of Labour Market Welfare and Firms Incentives
Programmes, Venice, 1113 May.
Rossi P.H., Lipsey M.W., Freeman H.E. 2004. Evaluation: A Systematic
Approach. Sage Publications: Thousand Oaks.
Rubin D.B. 1973. Matching to remove bias in observational studies. Biometrics, 29 (1): 159183.
Sarmah P. 2003. Home Country Measures and FDI: Implications for Host
Country Development. CUTS Centre for Competition, Investment & Economic
Regulation: Jaipur.
Sisti M. 2000. Valutare il successo delle politiche di aiuto alle imprese: problemi di metodo e applicazioni empiriche. III Congresso dell’Associazione Italiana di
Valutazione, Turin 2325 March.
Skuras D., Tzelepis D. 2004. The effects of regional capital subsidies on firm performance: an empirical study. Journal of Small Business and Enterprise
Development, 11 (1): 121129.
Tervo H. 1990. Factors underlying displacement: an analysis of Finnish regional incentive policy using survey data on assisted firms. Applied Economics, 22 (5): 617628.
Tokila A., Haapanen M., Ritsila J. 2008. Evaluation of investment subsidies. When is deadweight zero?. International Review of Applied Economics, 22 (5): 585600.
Trivellato U. 2008. La valutazione degli effetti di politiche pubbliche: paradigma e pratiche. Lecture CSS, Rome, 26 November.
UNCTAD. 1997. Investment Promotion and Development: Issues and Questions. United Nations Publication: Geneva.
Wollmann H. 2007. Policy evaluation and evaluation research, in Fischer F., Miller G.J., Sidney M.S. (eds.) Handbook of Public Policy Analysis. Theory,
Politics, and Methods. CRC Press: Boca Raton.
Wright M., Westhead P., Ucbasaran D. 2007. Internationalization of small and
mediumsized enterprises (SMEs) and international entrepreneurship: a critique and policy implications. Regional Studies, 41 (7): 10131030.
Zaheer S. 1995. Overcoming the liability of foreignness. Academy of