Proceedings of 2013 IAHR Congress © 2013 Tsinghua University Press, Beijing
ABSTRACT: Dam-break hazard assessment is of great importance in the Italian Alps, where a large number of medium and large reservoirs are present in valleys that are characterized by widespread urbanized zones on alluvial fans and along valley floors. Accordingly, there is the need to identify specific operative approaches in order to quantify hydraulic hazard which in mountain regions inevitably differ from the ones typically used in flat flood-prone areas. These approaches take advantage of: 1) specific numerical algorithms to pre-process the massive topographic information generally needed to describe very irregular bathymetries; 2) an appropriate mathematical model coupled with a robust numerical method which can deal in an effective way with variable geometries like the ones typical of natural alpine rivers; 3) suitable criteria for the hydraulic hazard assessment; 4) representative test cases to verify the accuracy of the overall procedure.
This contribution presents some preliminary results obtained in the development of this complex toolkit, showing its application to the test case of the Cancano dam-break, for which the results from a physical model are available. This case was studied in 1943 by De Marchi, who investigated the consequences of the potential collapse of the Cancano dam in Northern Italy as a possible war target during the World War II. Although dated, the resulting report (De Marchi, 1945) is very interesting, since it mixes in a synergistic way theoretical, experimental and numerical considerations. In particular, the laboratory data set concerning the dam-break wave propagation along the valley between the Cancano dam and the village of Cepina provides an useful benchmark for testing the predictive effectiveness of mathematical and numerical models in mountain applications. Here we suggest an overall approach based on the 1D shallow water equations that proved particularly effective for studying dam-break wave propagation in alpine valleys, although this kind of problems is naturally subject to "substantial uncertainties and unavoidable arbitrarinesses" (translation from De Marchi, 1945). The equations are solved by means of a shock-capturing finite volume method involving the Pavia Flux Predictor (PFP) scheme proposed by Braschi and Gallati (1992). The comparison between numerical results and experimental data confirms that the mathematical model adopted is capable of capturing the main engineering aspects of the phenomenon modeled by De Marchi.
Hydraulic hazard mapping in alpine dam break prone areas: the
Cancano dam case study
Marco Pilotti
Associate Professor, DICATAM, University of Brescia, Via Branze 43, 25123 - Brescia, Italy. Email: [email protected]
Andrea Maranzoni
Researcher, DICATeA, University of Parma, Parco Area delle Scienze 181/A, 43124 - Parma, Italy. E-mail: [email protected]
Luca Milanesi
PhD Student, DICATAM, University of Brescia, Via Branze 43, 25123 - Brescia, Italy. Email: [email protected]
Massimo Tomirotti
Associate Professor, DICATAM, University of Brescia, Via Branze 43, 25123 - Brescia, Italy. Email: [email protected]
Giulia Valerio
Research Assistant, DICATAM, University of Brescia, Via Branze 43, 25123 - Brescia, Italy. Email: [email protected]
KEY WORDS: Hazard mapping, Dam-break modeling, Shallow water equations, Alpine valleys, Case study.
1 INTRODUCTION
Even nowadays, dam safety is a topic generating a great interest since dam-break events have no negligible probability of occurrence and may cause catastrophic consequences. Recent researches (e.g., Saxena and Sharma, 2004) highlight that in the past century about 200 dam accidents happened in the world. The problem could become even worse in the future because of both the intensification of extreme meteorological events and the raise of exposure level to hazardous phenomena. For this reason, it is understandable that technical guidelines on dam safety require hydraulic studies in order to estimate hazard levels in dam-break flood prone areas. At this aim, suitable numerical tools capable of modeling the dynamics of these processes are needed. Anyway, especially in alpine valleys where most of the Italian reservoir are concentrated, these hydrodynamic processes may be rather complex because of the strong irregularities of natural topographies. In this particular situation, the 1D schematization can be considered reasonable on the whole, even if it is not strictly appropriate especially in correspondence of localized singularities (e.g., confluences, abrupt valley contractions or expansions, etc.). Moreover, despite the hypothesis of spatially gradually varied flow is often violated in the practical applications, shallow water equations (SWE) are usually accepted in the literature to deal with this kind of problems (e.g., Soares Frazão et al., 2003, Capart et al., 2003).
The reliability of the results obtained using this approach is usually verified on the basis of theoretical test cases with analytical solution that, unfortunately, are characterized by very simple geometry. The need to evaluate the applicability of SWE and related numerical schemes to more realistic situations suggests to consider also laboratory tests and, if possible, historical data. However, on the one hand laboratory data usually concern localized situations and schematic geometries (Soares Frazão and Zech, 2007, Aureli et al., 2008), on the other hand well documented historical dam-break events are rather rare (Valiani et al., 2002, Alcrudo and Mulet, 2007, Begnudelli and Sanders, 2007, Pilotti et al., 2011).
The numerical modeling of flood wave propagation in mountain regions requests that the adopted numerical scheme face at the same time with multiple difficulties that the simplified test cases considered in the literature pose separately. For this reason, laboratory or, possibly, field data concerning real events are a valuable information. These data do not form a punctual benchmark as analytical solutions, but allow to verify the global reliability of the numerical solution for engineering purposes. Within this framework, the experimental data obtained by means of the physical model built by Electricité de France in 1964 to reproduce the case study of Malpasset dam-break are the most known and used in the literature (e.g., Hervouet and Petitjean, 1999, Valiani et al., 2002). In this case, water depth hydrograph in 14 sections was measured.
In order to gain further validation data, in this paper it is proposed to recover the case study examined by De Marchi (1945) concerning the propagation along the Adda River (Northern Italy) of the flood wave potentially consequent to the collapse of the first Cancano dam. The measured discharge hydrographs reported in the historical paper of De Marchi, combined with the geometrical data of the physical model, can be considered really valuable (as well as rare) information for assessing performances of mathematical models.
In this paper the case study proposed by De Marchi is modeled through a finite volume numerical scheme that solves the de Saint-Venant equations. Since the original topography is not available, the topographical data have been extracted by a recent and very detailed digital terrain elevation model. The main goal is to assess if numerical modeling of this dam-break wave propagation provides results useful from an engineering viewpoint, even if substantial uncertainties and subjectivities are inevitable for this kind of phenomena.
2 THE STUDY BY DE MARCHI
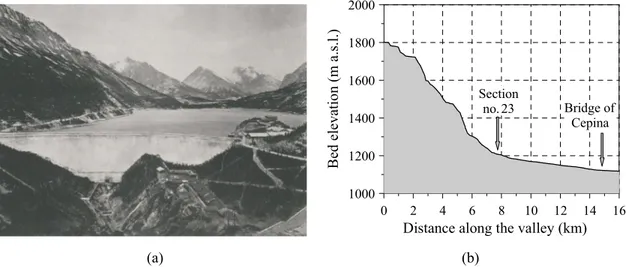
In 1943, after the bombing of several dams in the Ruhr region, the possibility that the Cancano barrage could become a war target was considered. This concrete gravity dam was built in the period between 1924 and 1929 in the Fraele valley (Northern Italy) for hydroelectric purposes (Figure 1). It was 60 m high and
50’s with a capacity of 124 ⋅ 106 m3.
Therefore, Professor De Marchi was commissioned to evaluate the expected hydraulic consequences of the possible collapse of the Cancano dam: the resulting study is a great coupling of numerical and experimental approaches. The original report, published at no. 40 of the Experiences of the "G. Fantoli" Laboratory of the Polytechnic of Milan, does not contain more information with respect to the well-known paper published in 1945. In-depth researches conducted by the writers in the archives of the Polytechnic of Milan in order to gather further information about the experiments were fruitless.
According to the fact that “it is practically impossible to apply the usual equations of Hydraulics to the mostly irregular, sometimes extremely irregular, bottom of mountain valleys” (translation from De Marchi, 1945), for the first rugged reach downstream of the reservoir an experimental approach was adopted: in fact, along the 8 km reach from the Cancano dam to the village of Premadio, the Adda River valley has a mean bed slope of 7.5% with long stretches characterized by bed slope greater than 20%. Downstream of the Bormio flood plain, where the valley is more regular and mean bed slope reduces to about 1%, a simplified numerical approach was applied. Six experimental discharge hydrographs provided at three different cross-sections contribute to set up an interesting test case for checking the reliability of de Saint-Venant equations in mountain regions.
A physical model reproducing the bathymetry of the 16 km long valley stretch from the Cancano dam to the bridge of Cepina was built at 1/500 scale on the basis of the Froude similitude. Both total and partial collapses of the dam were considered. In both cases, discharge hydrographs were measured in the three following locations: just downstream of the barrage, at Section no. 23 downstream of Premadio, and at the bridge of Cepina. These discharge hydrographs were obtained by graphic derivation of the filling time series recorded by using a floating device in a calibrated tank. For each collapse scenario, several tests were carried out in the same conditions and the final hydrographs were obtained by averaging the ones concerning the same scenario. A further experimental result was the delimitation of flooded area in the stretch between Premadio and the bridge of Cepina.
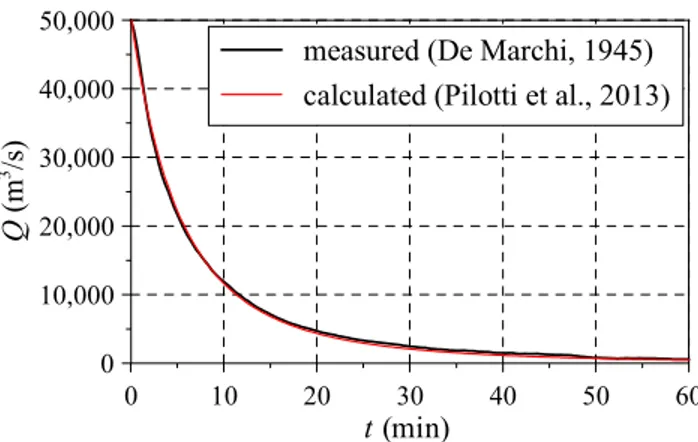
It is well-known that a floating device for measuring water level behaves as a low-pass filter in dynamic conditions. In order to evaluate the approximations coming from this effect and from the measuring procedure, the experimental hydrograph taken downstream of the dam has been compared with the theoretical one computed through the methodology suggested by Pilotti et al. (2013) and Pilotti et al. (2010). The excellent agreement between experimental and theoretical time series at the breach (Figure 2) confirms that the method adopted by De Marchi for discharge measurement is adequate for the investigated phenomenon.
0 2 4 6 8 10 12 14 16
Distance along the valley (km)
1000 1200 1400 1600 1800 2000 B ed el evatio n ( m a .s.l .) Section no.23 Bridge of Cepina (a) (b)
Figure 1 (a) The old Cancano dam viewed from downstream (from ANIDEL 1953). (b) Longitudinal profile of the
0 10 20 30 40 50 60 t (min) 0 10,000 20,000 30,000 40,000 50,000 Q (m 3 /s)
measured (De Marchi, 1945) calculated (Pilotti et al., 2013)
Figure 2 Comparison between measured and calculated discharge time series at the breach section
3 MATHEMATICAL MODELING
Considering a reach of an open channel between the sections x1 and x2, the 1D de Saint-Venant equations in integral form read (e.g., Cunge et al., 1980):
∫
∫
+ − = 2 1 2 1 1 2 x x x x dx x,t ,t x ,t x dx x,t dt d U( ) F(U( )) F(U( )) S(U( )) (1)where t is the time and
⎟⎟ ⎟ ⎠ ⎞ ⎜⎜ ⎜ ⎝ ⎛ + ⎟ ⎠ ⎞ ⎜ ⎝ ⎛ + ∂ ∂ − = ⎟⎟ ⎟ ⎠ ⎞ ⎜⎜ ⎜ ⎝ ⎛ + = ⎟⎟ ⎠ ⎞ ⎜⎜ ⎝ ⎛ = 2 0 1 2 0 gI S x z gA gI A Q Q Q A f S , F , U . (2)
In the definitions (2) the conserved variables A and Q represent wetted area and discharge respectively, while the geometric terms I1 and I2 denote the first moment of the wetted area with respect to the free surface and the term of nonprismaticity. Finally, z0 and Sf are thalweg elevation and friction slope,
respectively.
Numerical fluxes have been estimated by the PFP (Pavia Flux Predictor) upwind method suggested by Braschi and Gallati (1992). For a proper numerical treatment of wetting and drying fronts, a 1 mm water depth threshold has been imposed and a mass error of 1% (with respect to the total volume initially stored in the reservoir) has been accepted. Finally, in order to fulfill numerical stability conditions, the CFL number has been set equal to 0.8.
Obviously, to simulate the flood propagation, it has been necessary to reconstruct the valley bathymetry. Since the original cross-sections used by De Marchi are not available, a semi-automatic procedure has been employed (Pilotti et al., 2006) in order to extract cross-section profiles and related geometrical quantities from a DTM with a cell size of 20 m. This DTM includes the portion of the valley now submerged between the old and the present Cancano dam.
4 RESULTS
The discharge hydrographs measured by De Marchi actually form an interesting benchmark useful to assess the effectiveness of the mathematical model based on the de Saint-Venant equations and of the numerical scheme used for their integration in the presence of very irregular bathymetries. In the following, only the total dam-break case will be considered.
From an operational viewpoint, the numerical modeling requires that two basic choices are made concerning the values of cross-section spacing and roughness coefficient. To assess the resulting uncertainty of the numerical results, a sensitivity analysis on these two parameters has been performed.
De Marchi made the concrete surface of the physical model artificially rough in order to reproduce the natural irregularity of the upper part of the valley and the effect of vegetation. Within the numerical
coefficient of 20 m1/3/s. The different morphology of the valley upstream of Premadio (very steep and winding) suggests for this stretch a value between 10 and 15 m1/3/s, that is confirmed in the literature by some studies (e.g. Jarret, 1984), even concerning morphologically similar environments (Pilotti et al., 2011). Similarly, visual inspection of the downstream reach up to Cepina may justify the adoption of values between 20 and 30 m1/3/s.
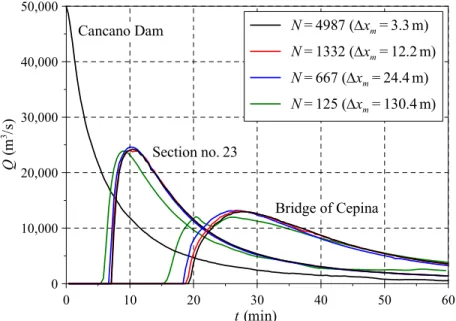
Figure 3 shows the discharge hydrographs calculated at Section no.23 and at the bridge of Cepina with different grid spacing. In the numerical simulations, the Strickler coefficient was set at 15 m1/3/s for the reach upstream of Premadio and at 25 m1/3/s for the downstream stretch of the valley. Initially, a number of cross-sections doubled in comparisons with the study of De Marchi was adopted (mean spacing ∆xm of
about 300 m). Then, the spatial resolution was gradually increased up to ∆xm ≈ 3.3 m. For ∆xm = 12.2 m a
substantial convergence of the numerical scheme was achieved.
0 10,000 20,000 30,000 40,000 50,000 Q (m 3 /s ) 0 10 20 30 40 50 60 t (min) N=4987 (∆xm=3.3m) N=1332 (∆xm=12.2m) N=667 (∆xm=24.4m) N=125 (∆xm=130.4m) Section no.23 Bridge of Cepina Cancano Dam
Figure 3 Sensitivity of the model to spatial resolution: computed discharge hydrographs at two reference
cross-sections (ks = 15 m1/3/s upstream of Premadio, ks = 25 m1/3/s downstream)
Figure 4 recaps the results of the sensitivity analysis with respect to roughness coefficient. The bands represent the envelope of the discharge hydrographs obtained for different values of the Strickler coefficient lying within the intervals mentioned above. It can be noticed that this parameter influences arrival time more than the peak discharge value. Figure 4 also highlights that the numerical model systematically overestimates the peak discharge and the steepness of the rising limb of the discharge hydrographs. The reason for this behavior can be possibly found in the difficulty of the 1D scheme in capturing the expansion of the flow and the related attenuation effect at lateral confluences.
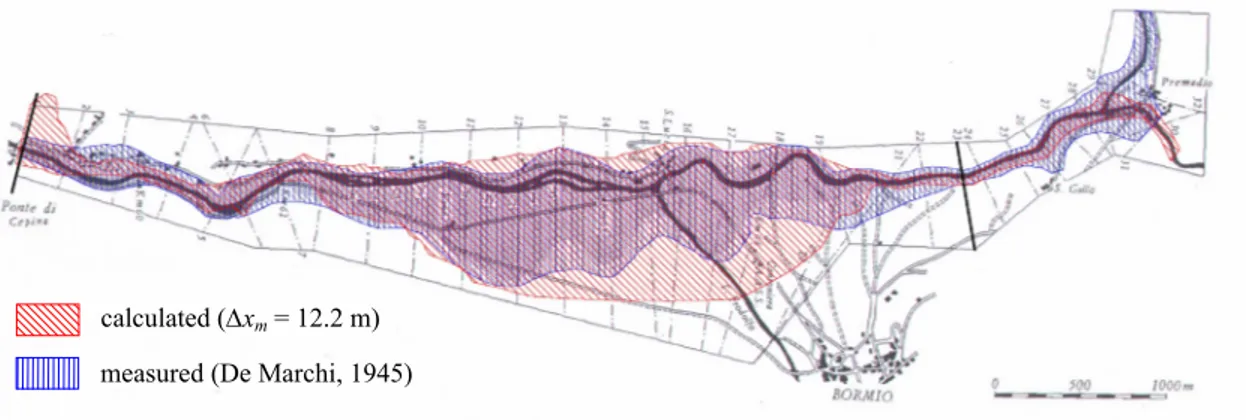
Figure 5, which compares the numerical estimation of the flooded area extent with the experimental survey, clearly shows this effect at the confluence area between the Adda and Viola Rivers near the village of Premadio. The inundated areas have been delimited on the basis of the envelope of maximum water depths calculated by the numerical model at each cross-section for different roughness values. Anyway, the extension of such areas seems to depend weakly on the Strickler coefficient.
5 CONCLUSIONS
The discrepancy between calculated and measured inundated areas in the Bormio floodplain could be explained by the morphological changes that have affected the bathymetry of the river and the topography of the floodplain during the last 60 years. Moreover, the experimental identification of the flooded areas could have been underestimated because of the surface tension effect that is surely significant in case of
millimetric water depths.
The results obtained confirm that the mathematical model here adopted is capable of capturing the main engineering aspects of the phenomenon modeled by De Marchi, even in an environment where the basic hypotheses of the de Saint-Venant equations are not rigorously valid.
0 10,000 20,000 30,000 40,000 50,000 Q (m 3 /s) 0 10 20 30 40 50 60 t (min) measured calculated Section no.23 Cancano Dam Bridge of Cepina
Figure 4 Sensitivity of the model to roughness coefficient: envelope of the computed discharge time series at two
reference cross-sections (∆xm = 12.2 m)
Figure 5 Comparison between calculated and measured flooded areas for the stretch from Premadio up to the bridge of
Cepina. The cross-sections used by De Marchi are also traced.
ACKNOWLEDGEMENT
The study has been developed within the European Project Kulturisk (Grant agreement 265280).
References
Alcrudo F. and Mulet J., 2007. Description of the Tous dam break case study (Spain). Journal of Hydraulic Research, 45 (Extra Issue), 45-57.
Associazione Nazionale Imprese Produttrici e Distributrici di Energia Elettrica (ANIDEL), 1953. Le dighe di ritenuta degli impianti idroelettrici italiani, Vol. 7, ANIDEL, Rome, Italy (in Italian).
Aureli F., Maranzoni A., Mignosa P. and Ziveri C., 2008. Dam-break flows: acquisition of experimental data through an imaging technique and 2D numerical modeling. Journal of Hydraulic Engineering, 134(8), 1089-1101.
calculated (∆xm = 12.2 m)
Begnudelli L. and Sanders B.F., 2007. Simulation of the St. Francis dam-break flood. Journal of Engineering Mechanics, 133(11), 1200-1212.
Braschi G. and Gallati M., 1992. Conservative flux prediction algorithm for the explicit computation of transcritical flow in natural streams. Proceedings of Hydrosoft ‘92, Southampton, England.
Capart H., Eldho T.I., Huang S.Y., Young D.L. and Zech Y., 2003. Treatment of natural geometry in finite volume river flow computations. Journal of Hydraulic Engineering, 129(5), 385-393.
Cunge J.A., Holly F.M. Jr. and Verwey A., 1980. Practical Aspects of Computational River Hydraulics, Pitman Publishing Ltd., London.
De Marchi G., 1945. Sull’onda di piena che seguirebbe al crollo della diga di Cancano. L’Energia Elettrica, 22, 319-340 (in Italian).
Hervouet J.M. and Petitjean A., 1999. Malpasset dam-break revisited with two-dimensional computations. Journal of Hydraulic Research, 37(6), 777-788.
Jarrett R.D., 1984. Hydraulics of high gradient streams. Journal of Hydraulic Engineering, 110(11), 1519-1539. Pilotti M., Maranzoni A. and Tomirotti M., 2006. An efficient tool for hydraulic hazard analysis in alpine valleys, 7th
International Conference on Hydroinformatics, Nice, France.
Pilotti M., Tomirotti M., Valerio G. and Bacchi B. 2010. Simplified method for the characterization of the hydrograph following a sudden partial dam break.” Journal of Hydraulic Engineering, 136(10), 693-704.
Pilotti M., Maranzoni A., Tomirotti M. and Valerio G., 2011. 1923 Gleno dam-break. case study and numerical modeling. Journal of Hydraulic Engineering, 137(4), 480-492.
Pilotti M., Tomirotti M., Valerio G. and Milanesi L., 2013. Discussion of "Experimental investigation of reservoir geometry effect on dam-break flow" by A. Feizi Khankandi, A. Tahershamsi and S. Soares-Frazão. Journal of Hydraulic Research, 51(2), 220-222.
Saxena K.R. and Sharma V.M., 2004. Dams: Incidents and Accidents, Taylor and Francis, London, England.
Soares Frazão S., Zech Y. and Morris M., 2003. IMPACT, Investigation of extreme flood processes and uncertainty. 3rd Project Workshop Proceedings, Louvain-la-Neuve, Belgium.
Soares Frazão S. and Zech Y., 2007. Experimental study of dam-break flow against an isolated obstacle. Journal of Hydraulic Research, 45(Special Issue), 27-36.
Valiani A., Caleffi V. and Zanni A., 2002. Case study: Malpasset dam-break simulation using a two-dimensional finite volume method. Journal of Hydraulic Engineering, 128(5), 385-393.