UNIVERSITÀ DEGLI STUDI DI SALERNO
Dipartimento di Farmacia
Dottorato di ricerca
in Biologia dei Sistemi
Ciclo XIV Anno di discussione 2015
Coordinatore: Chiar.mo Prof. Antonietta Leone
PhD thesis
in
“Identification of new genetic alterations and
potential biomarkers in papillary thyroid
carcinoma”
Subtitle
Computational and experimental analysis of thyroid
cancer transcriptome
Settore scientifico disciplinare di afferenza
: INF/01
Dottorando Tutore
Table of Contents
ABSTRACT (ENGLISH) 4
ABSTRACT (ITALIANO) 6
1 INTRODUCTION 9
1.1 CANCER GENETICS 10
1.1.1PROTO-ONCOGENES AND ONCOGENES 10
1.1.2TUMOR SUPPRESSOR GENES 11
1.1.3DNA REPAIR 12
1.1.4CELL CYCLE 13
1.1.5MUTATION TIMING AND DRIVER GENES 15 1.1.6SIGNALING PATHWAYS IN TUMORS 16
1.2 THYROID CARCINOMA 17
1.2.1 PAPILLARY THYROID CARCINOMA 20 1.2.2 MOLECULAR GENETICS ALTERATION IN PAPILLARY THYROID CARCINOMA 22
1.3 RNA-SEQUENCING 26
1.3.1 ILLUMINA SEQUENCING TECHNOLOGY 28 1.3.2 RNA-SEQUENCING DATA ANALYSIS 30 1.3.3 RNA-SEQ IN PAPILLARY THYROID CARCINOMA 32
1.4.LONG NON CODING RNAS 33
1.4.1FUNCTIONS AND MECHANISMS OF LNCRNAS 35 1.4.2METHODS TO DISCOVER LNCRNAS 40
1.4.3 LNCRNA AND CANCER 42
1.4.4ONCOGENIC LONG NON CODING RNAS 43 1.4.5TUMOR-SUPPRESSOR NCRNAS 46 1.4.6 LNCRNAS AND PAPILLARY THYROID CANCER 48 2 PRINCIPAL AIM OF THE PROJECT 50 3. IDENTIFICATION OF NEW SOMATIC MUTATIONS AND WNK1-‐B4GALNT3 GENE FUSION IN PAPILLARY THYROID CARCINOMA 53
3.1 METHODS 54
3.1.1PATIENTS AND RNA SAMPLES PREPARATION 54 3.1.2LIBRARY PREPARATION AND RNA-SEQUENCING DATA ANALYSIS 54 3.1.3ANALYSIS OF SINGLE NUCLEOTIDE VARIANTS 56 3.1.4ANALYSIS OF FUSION TRANSCRIPTS 58
3.1.5REVERSE TRANSCRIPTION 58
3.1.6RT-PCR ASSAY, CLONING AND SANGER SEQUENCING 59
3.2RESULTS 61
3.2.1.ANALYSIS OF KNOWN DRIVER PTC ALTERATIONS 61 3.2.2SINGLE NUCLEOTIDE VARIANTS IN CANCER DRIVER GENES 64 3.2.3IDENTIFICATION OF NEW MUTATIONS IN PTC 66 3.2.4IN SILICO ANALYSIS OF NEWLY IDENTIFIED MUTATIONS 68
3.2.5WNK1-B4GALNT3: IDENTIFICATION OF A NOVEL GENE FUSION 70
3.2.6WNK1-B4GALNT3 IN COLON CANCER SAMPLE 74
3.3 DISCUSSION 75
4 GENOME-‐WIDE ANALYSIS OF LNCRNAS INVOLVED IN PAPILLARY THYROID
4.1METHODS 79
4.1.1.AB INITIO ASSEMBLY 79
4.1.2IDENTIFICATION OF NOVEL LNCRNAS 80
4.1.3EXPRESSION ANALYSIS 80
4.1.4SELECTION OF NOVEL LNCRNAS 81
4.1.5SUBCELLULAR FRACTIONATION 82
4.1.6CHROMATIN STATES 82
4.1.7RT-PCR AND QUANTITATIVE REAL-TIME ASSAYS 83
4.1.8CELL CULTURE 84
4.1.9RNA INTERFERENCE 84
4.1.10CELL CYCLE ANALYSIS 84
4.1.10CELL VIABILITY ASSAY 85
4.1.11STATISTICAL ANALYSIS 85
4.2RESULTS 86
4.2.1.GLOBAL GENE EXPRESSION OF PAPILLARY THYROID CARCINOMA 86 4.2.2DIFFERENTIAL EXPRESSION ANALYSIS 88 4.2.3IDENTIFICATION OF NEW LONG NON-CODING RNAS ALTERED IN PTC 93 4.2.4CHARACTERIZATION OF A NEW LNCRNA ANTISENSE TO MET ONCOGENE 94 4.2.5BOTH MET AND MET-AS EXPRESSION HIGHLY CORRELATES WITH SOMATIC
ALTERATIONS IN PTC 97
4.2.6REGULATING ROLE OF MET-AS ON MET EXPRESSION LEVEL 99 4.2.7MET-AS REGULATES CELL CYCLE PROGRESSION AND CELL PROLIFERATION 100
4.3DISCUSSION 103
5 CONCLUSIONS 106
6 REFERENCES 109
Abstract (English)
Papillary thyroid carcinoma (PTC) is the most frequent thyroid malignant neoplasia. Oncogene activation occurs in more than 70% of the cases. BRAF mutations occur in about 40% of PTCs, whereas RET rearrangements (RET/PTC oncogenes) are present in about 20% of cases. Finally, RAS mutations and TRK and PPARG rearrangements account for about 5% each of these malignancies. However, despite the presence of tumor-initiating driver events, cancer results from the progressive accumulation of mutations in genes that confer growth advantage over surrounding cells. A better understanding of molecular alterations of PTC will provide important insights into cancer etiology. It will also lead to advance in their diagnosis, possibly opening the way for developing novel molecular therapies.
Thus, the aim of this PhD project is to deeply explore the transcriptome of PTC in order to identify new driver events in this type of cancer.
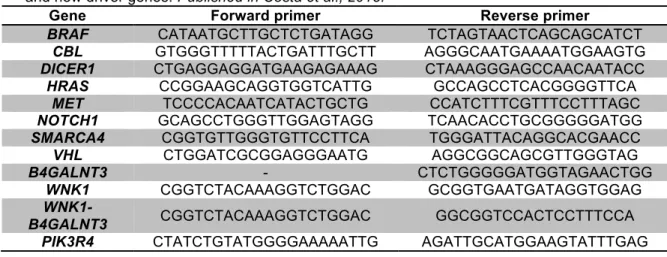
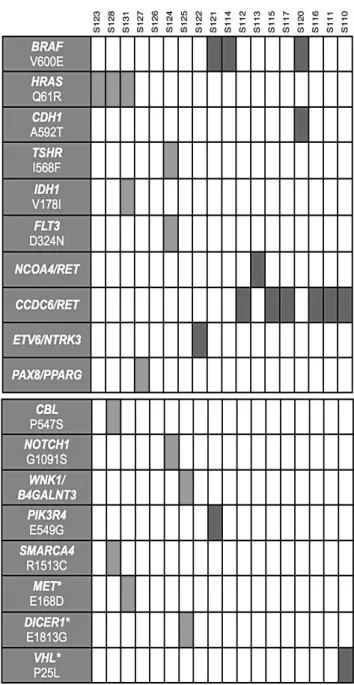
In the first part of this study, we used RNA-Sequencing in a discovery cohort of 18 patients with papillary thyroid carcinoma to identify fusion transcripts and expressed mutations in cancer driver genes. Furthermore, we used targeted sequencing on the DNA of these same patients to validate identified mutations. We extended the screening to thyroids of 50 PTC patients and of 30 healthy individuals. Using this approach we identified new somatic mutations in CBL, NOTCH1, PIK3R4 and SMARCA4 genes. We also found mutations in DICER, MET and VHL genes, previously found mutated in other tumors, but not described yet in PTC. We also identified a new chimeric transcript generated by the fusion of lysine deficient protein kinase 1 (WNK1) and beta-1,4-N-acetyl-galactosaminyl transferase 3 (B4GALNT3) genes and correlated with an overexpression of B4GALNT3.
Moreover, although protein coding genes play a leading role in cancer genetics, in recent years, many studies focused on a novel class of non-coding RNAs, long non-coding RNAs (lncRNAs), which regulate the expression levels of protein coding genes. Since deregulated expression of lncRNAs has been reported in many cancers, it suggests that they may act as potential oncogene or tumor-suppressor.
Thus, to assess if lncRNAs can exert a tumorigenic role in thyroid, in the second part of my PhD project I systematically quantified lncRNAs’ expression in PTC vs healthy thyroids using our RNA-Seq data. Combining ab initio reconstruction to a custom computational pipeline we found that novel and known lncRNAs are significantly altered in PTC, and some of them are possibly associated with cancer driver genes. Then we extensively focused on an un-annotated lncRNA transcribed antisense to MET oncogene, named MET-AS. Both genes are significantly up-regulated in a sub-class of PTCs - i.e. patients with BRAF mutations and RET gene rearrangements, compared to other PTCs and "non-tumor" thyroid biopsies. Preliminary data indicate that MET-AS knockdown induces down-regulation of MET, and produces changes in cell cycle in a PTC cell line, suggesting the novel lncRNA might be a new MET regulator. Further studies should be conducted to demonstrate detailed mechanism of our findings.
Finally, our data confirmed the genetic heterogeneity of papillary thyroid carcinoma revealing that gene expression correlates more with the mutation pattern than with tumor staging. Overall, this study provides new information about PTC genetic alterations, suggesting potential pharmacological adjuvant therapies in PTC.
Abstract (Italiano)
Il carcinoma papillare tiroideo (PTC) costituisce circa l’80% di tutti i tumori maligni della tiroide. Ad oggi, sono state identificate mutazioni a carico del gene BRAF in circa il 40% di casi, mentre riarrangiamenti che coinvolgono il gene RET (RET/PTC) sono presenti in circa il 20% dei casi. Infine, mutazioni nei geni RAS e riarrangiamenti dei geni TRK e PPARG occorrono in circa il 5% dei casi ciascuno.
Tuttavia, nonostante la presenza di alterazioni genetiche che possano dare inizio al processo canceroso, il tumore è il risultato del progressivo accumulo di mutazioni in geni che conferiscono un vantaggio di crescita sulle cellule circostanti. Pertanto, una conoscenza più approfondita delle alterazioni molecolari del carcinoma papillare tiroideo è fondamentale per migliorare gli aspetti diagnostici e prognostici, e la risposta individuale ai trattamenti farmacologici.
Alla luce di ciò, il mio progetto di dottorato ha avuto come obiettivo principale l’analisi del trascrittoma del PTC al fine di individuare nuovi eventi molecolari che possano essere coinvolti in questo tipo di cancro.
La prima parte di questo progetto è stata focalizzata sul sequenziamento - mediante RNA-Seq – di 22 RNA isolati da biopsie di tiroide (18 tiroidi di soggetti con carcinoma papillare tiroideo, 4 tiroidi di soggetti in assenza di PTC) per identificare nuovi trascritti di fusione e mutazioni somatiche in geni espressi. I risultati sono stati validati sul DNA dei medesimi pazienti mediante sequenziamento diretto di Sanger. Inoltre, l’analisi mutazionale è stata estesa ad ulteriori 50 pazienti con carcinoma papillare tiroideo e 30 individui in assenza di PTC. Mediante quest’approccio sono state identificate nuove mutazioni puntiformi nei geni CBL, NOTCH1, PIK3R4 e SMARCA4. Inoltre, l’analisi ha rivelato la presenza di mutazioni somatiche nei geni DICER1, MET e VHL, già note nella patogenesi in altri tipi di cancro, ma ad oggi non note nel PTC. Inoltre, è stato individuato un nuovo evento intra-cromosomico generato dalla fusione tra il primo esone del gene WNK1 (lysine deficient protein
kinase 1) e il secondo esone del gene B4GALNT3 (beta-1,4-N-acetyl-galactosaminyl transferase 3).
I geni codificanti rivestono un ruolo di primo piano nella genetica del cancro, ma negli ultimi anni, molti studi si sono concentrati su una nuova classe di RNA non-codificanti, i long non-coding RNA (lncRNAs), che regolano l’espressione dei geni codificanti. I livelli di espressione dei lncRNA sono spesso alterati in diversi tipi di tumori, suggerendo che essi possano agire sia da oncogeni sia da oncosoppressori. Al fine di valutare il loro potenziale ruolo nella tumorigenesi del PTC, la seconda parte di questo progetto è stata focalizzata sull’analisi computazionale dei nuovi lncRNA, e già annotati, nei dataset da me ottenuti mediante RNA-Seq. Attraverso l’utilizzo di approcci per la ricostruzione ab initio del trascrittoma e di una pipeline computazionale sono stati indentificati i lncRNA significativamente deregolati nei campioni tumorali. Inoltre, per individuare i lncRNA che potessero regolare l’espressione genica in cis, alcuni di essi sono stati associati - per vicinanza al TSS (transcription start site) - a geni driver in diversi tipi di cancro. Infine, mi sono focalizzata su un lncRNA non annotato nei database pubblici, associato all’oncogene MET, e trascritto in direzione antisenso rispetto al gene MET. Questo nuovo lncRNA è stato chiamato MET-AS. Entrambi i geni (MET e MET-AS) sono significativamente sovra-espressi in una sotto-classe di PTC - vale a dire i pazienti con mutazioni del gene BRAF e riarrangiamenti dell’oncogene RET – chiamati BRAF-like-, rispetto ai campioni tumorali PTC, con profilo trascrizionale simile ai campioni mutati nei geni RAS – chiamati RAS-like - e campioni di tiroide "non-tumorali". Esperimenti preliminari condotti in vitro in una linea cellulare di carcinoma papillare tiroideo, TPC-1, indicano che il silenziamento del lncRNA MET-AS induce una sotto-regolazione dell’oncogene MET, che induce un blocco del ciclo cellulare in fase G1. Ciò potrebbe suggerire che MET-AS sia un nuovo regolatore dell’oncogene MET.
In conclusione, i risultati ottenuti in questo lavoro di tesi confermano l'eterogeneità genetica del carcinoma papillare della tiroide rivelando che l'espressione genica correla più con il profilo mutazionale dei pazienti che con
la stadiazione del tumore. Inoltre, questo studio fornisce nuove informazioni sulle alterazioni genetiche del PTC, suggerendo potenziali terapie adiuvanti farmacologiche per questo tipo di cancro.
1.1 Cancer Genetics
Cancer arises as a result of deregulated cell growth. Essentially, the gradual accumulation of mutations in genes that regulate crucial cell processes, like cell cycle or DNA repair, is one of the proposed mechanisms accounting for the increased proliferation rate, which is a typical feature of cancer cells. The acquired genetic alterations are then transmitted to the next generation of cells, which can accumulate also other genetic alterations. Indeed, the vast majority of genetic alterations are acquired somatically.
In 1914, Boveri proposed firstly the hypothesis that cancer can arise from somatic alterations in DNA. He noted abnormal mitotic division and cell masses, very similar to tumors, in eggs of sea urchin fertilized by two sperms (Boveri, 1914). In the last 30 years significant experiments supporting this thesis have been performed in different fields, from molecular biology to epidemiology. Today, we know that the onset and the expansion of a malignant cell population result from multiple (perhaps five, ten or more) genetic alterations that occur in the transition of a cell from a normal to malignant phenotype. Such alterations, that in proof-of-principle can be both somatic or germline, can occur in three major classes of genes, i.e. oncogenes, tumor suppressor genes and DNA damage recognition/repair genes, which play key roles in tumorigenesis.
1.1.1 Proto-oncogenes and oncogenes
Proto-oncogenes are genes that drive normal cells to become cancerous when they are mutated (Adamson, 1987; Weinstein & Joe, 2006). Oncogenes are the mutated version of proto-oncogenes that typically carry dominant mutations, i.e. mutations affecting only one allele of the gene can be sufficient to activate the gene and trigger the neoplastic program. A broad spectrum of genes can be defined as proto-oncogenes even though most of them encode proteins involved in stimulation of cell division, inhibition of cell differentiation, and are responsible of halting cell death and apoptosis. All of these processes are crucial for normal tissues and organs development and maintenance. The oncogenes' activation involves a quantitative or qualitative gain of function. It
can result from different genetic mechanisms, which can be schematized as follows: i) point mutations, deletions, or insertions that lead to a hyperactive gene product; ii) point mutations, deletions, or insertions in the promoter region of a proto-oncogene that lead to increased transcription; iii) gene amplifications that lead to extra chromosomal copies of a proto-oncogene; iv) chromosomal translocations that relocate a proto-oncogene to a new chromosomal site, possibly leading to a higher expression of the transposed gene; v) chromosomal translocations that lead to a fusion between a proto-oncogene and another gene, with the result of producing a chimeric protein with an oncogenic activity.
Activated oncogenes typically give rise to increased protein translation and/or activation, with a significant alteration of cellular processes such as increased cell division, decreased cell differentiation, and inhibition of cell death and apoptosis. All of these phenotypes are hallmarks of the cancer cells. Thus, oncogenes are currently a major molecular target for anti-cancer drug design (Chial, 2008).
Among the most extensively studied proto-oncogenes, RAS and RAF, which encod proteins involved in intracellular signalling, are frequently mutated in human malignancies, like melanoma or thyroid cancer (Bos 1989; Davies 2002). Mutations in these genes determine an increased activation of their protein products with the resulting over-stimulation of the mitogen-activated protein kinase (MAPK) pathway. Other frequent events are the germline mutations in RET proto-oncogenes in familiar medullary thyroid carcinoma (Eng 1999) and in MET gene, often mutated in papillary renal carcinoma.
1.1.2 Tumor suppressor genes
In 1988, Harris hypothesized that − in addition to oncogene activation − the loss of genetic material is a crucial event in tumorigenesis (Harris 1988). Tumor suppressor genes can be defined as genes encoding proteins that inhibit cell proliferation, or that act as the “brakes” for cell cycle. Other tumor suppressor genes encode proteins that promote the apoptosis or that are involved in cell differentiation. A tumor suppressor gene contributes to cancer
when both alleles are inactivated by a mutation. Indeed, as long as the cell contains one functional copy of a given tumor suppressor gene, it can inhibit the formation of tumors. Therefore, mutations in tumor suppressor genes are recessive or loss-of-function mutations, and they are often point mutations or small deletions that disrupt the function of the protein encoded by the gene. The requirement of two mutations to promote tumorigenesis was proposed by Dr. Alfred Knudson in 1971 during his studies on retinoblastoma. Knudson proposed that sporadic cases of this tumor require the inactivation of both copies of a particular gene, the retinoblastoma gene (RB1). He formulated the “two-hit theory”: a “first hit” inactivates one of the two copies of RB1. Later a “second hit” inactivates the remaining functional copy of RB1 in the same cell or one of its progeny (Knudson 1971). However, in the hereditary forms of cancer the first mutation is inherited from parents, thus only one somatic “hit” is necessary for tumor initiation.
1.1.3 DNA repair
DNA mutations are caused by copying errors during DNA replication, chemical and physical agents and can compromise DNA function. To protect the genome, mammalian cells employ at least eight distinct DNA repair pathways to cope with a multitude of different genotoxic lesions (Dietlein et al., 2014). In this network of genome maintenance pathways, the two major repair system consists of mismatch repair (MMR), and nucleotide-excision repair (NER). MMR recognizes erroneous insertions, deletions, and erroneous bases incorporations of bases. The MutSα (formed by Msh2/Msh6), and MutSβ (formed by Msh2/Msh3) complexes detect small mismatches and large mismatches and insertion loops, respectively (Kunkel and Erie 2005). The MutLα complex (formed by MLH1 and PMS2) binds MutS and recruits the exonuclease Exo1; subsequently DNA Polδ fills the lesion gap. NER is mainly responsible for repairing single or double strand breaks and helix-distorting lesions, which are induced by UV irradiation and platinum-based chemotherapeutics. Cells with defects in MMR encoding genes have a
mutation rate 100-1000 fold higher than normal cells. Moreover, these MMR-defective cells display microsatellite instability. Microsatellites are repetitive genetic elements dispersed in the genome, with repeating units of 1-4 bases. Because of the repetitive nature of microsatellites they are prone to DNA polymerase slippage, which is efficiently repaired by the MMR. Defects in MMR result in increasing length and number of microsatellites, which have been observed in different types of cancer (Lengauer 1998). The important function of NER to protect against skin cancer becomes obvious by the rare genetic disease Xeroderma Pigmentosum, in which different NER genes are mutated. In animal models, it has been demonstrated that UVB is more effective to induce skin cancer than UVA when this repair system is mutated (Rass and Reichrath, 2008).
1.1.4 Cell cycle
Cellular life span is highly variable between different cell types. At a given time the absolute majority of cells are not dividing, but exists in a resting and metabolic active state called G0. A cell enters in the cell cycle, duplicating its
DNA and dividing itself, in response to external or internal stimuli. This process is supervised by checkpoint controls, which act to ensure that identical chromosome copies are transferred to the two daughter cells.
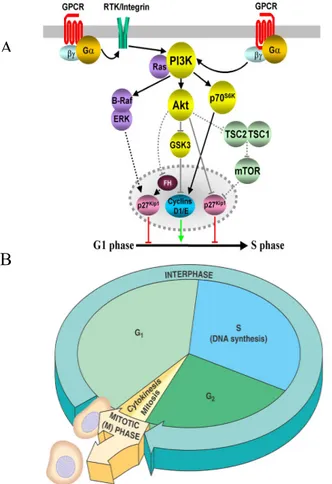
The cell cycle is divided into two basic parts: mitosis and interphase (Figure 1.1 B). Mitosis (nuclear division), or M phase, is the most dramatic stage of the cell cycle, corresponding to the separation of daughter chromosomes and usually ending with cell division (cytokinesis). However, approximately 95% of the cell cycle is spent in interphase, the period between mitoses. The M phase is followed by the G1 phase (gap 1), which corresponds to the interval between mitosis and initiation of DNA replication, which takes place in S phase (synthesis). This phase is followed by the G2 phase (gap 2), during which cell growth continues and proteins are synthesized in preparation for mitosis.
The progression of cells through the division cycle is regulated by extracellular signals from the environment, as well as by internal signals that monitor and
coordinate the various processes that take place during different cell cycle phases (Figure 1.1 A). In addition, cell cycles have different checkpoints, which ensure the correct coordination of all phases. Indeed, it is critically important that the cell does not begin mitosis until replication of the genome has been completed. Progression through the cell cycle is also arrested at the G1 and G2 checkpoint in response to DNA damage. This arrest allows time for the damage to be repaired, rather than being passed on to daughter cells. In mammalian cells, arrest at the G1 checkpoint is mediated by the action of p53 protein. Interestingly, the gene encoding p53 is frequently mutated in human cancers. Loss of p53 function as a result of these mutations prevents G1 arrest in response to DNA damage, so the damaged DNA is replicated and passed on to daughter cells instead of being repaired.
Figure 1.1. A) Gene products and pathways involved in induction of S phase from G1 phase. B) Schematic illustration of cell cycle.
A
1.1.5 Mutation timing and driver genes
Tumors evolve from benign to malignant lesions by acquiring different mutations over time, a process that has been particularly well studied in colorectal tumors (Nowell, 1976; Fearon and Vogelstein, 1990). The first, or “gatekeeping,” mutation provides a selective growth advantage to a normal epithelial cell (Vogelstein et al., 2013). When a second mutation in another gene that can promote or “drive” tumorigenesis occurs, it causes a second round of clonal growth that allows an expansion of cell number (Figure 1.2). The mutations that confer a selective growth advantage to the tumor cell are called “driver” mutations. All the mutations that have no effect on the neoplastic process are called “passenger” mutations (Vogelstein et al., 2013). It has been estimated that a typical tumor contains two to eight of these “driver" gene mutations; the remaining mutations are passengers. Moreover, it is important to point out that there is a fundamental difference between a driver gene and a driver gene mutation. A driver gene is a gene that contains driver mutations (also defined as Mut-Driver gene) or is aberrantly expressed conferring a selective growth advantage to cells (Epi-Driver gene, Vogelstein et al., 2013).
For instance, BRAF is a well-known driver gene, but only mutations that result in increased kinase activity of the protein are considered driver mutations. An example is constituted by the V600E mutation that results in a valine (V) to a glutamic acid (E) substitution at position 600 in BRAF. Other missense mutations throughout the gene, as well as protein-truncating mutations in the C-terminal domain, are passenger gene mutations.
Numerous statistical methods to identify driver genes have been published. Some of them are based on the predicted effects of the mutation on the encoded protein (Carter et al., 2009; A. Youn et al., 2011; J. S. Kaminker et al, 2007). Other methods are based on other frequency of mutations in an individual gene in a specific tumor, compared with the mutation frequency of other genes, occurred by chance, in the same or related tumors after correction for sequence context and gene size (Parmigiani et al., 2009; M.
Meyerson et al., 2010). All of these algorithms useful for genes' prioritization are most likely to confer a growth advantage when mutated.
Figure 1.2. Multistep progression toward cancer. A normal cell (N) acquires one mutation (I), which provides the cell a growth advantage. It constitutes a substrate for accumulation of additional mutations resulting in cell clones with increased proliferative capacity (II-IV).
1.1.6 Signaling pathways in tumors
All of the known driver genes can be classified into one or more of 12 pathways (Figure 1.3). These pathways can be categorized into three main cellular processes: cell fate, genome maintenance and cell survival. Cell fate: is regulated by the inverse relationship between cell division and differentiation. Pathways that function through this process include, Hedgehog (HH) pathway, APC and NOTCH signaling, all of which are known to control cell fate. Genes involved in chromatin modifications can also be included in this category. Cell survival pathways are shown as regulators of cell metabolism and cell survival, but examples are also provided where aberrant activity of the pathway may contribute to the induction of apoptosis. MYC, BCL2 RAS and BRAF are driver genes that directly regulate progression through the cell cycle and apoptosis.
Genome maintenance: cells are frequently exposed to a variety of toxic substances, such as reactive oxygen species, o radiations. These events cause mistakes in DNA replication process or during division. Tumor cells with mutations in DNA damage control pathway, such as mutations that abrogate checkpoints genes – for instance TP53 and ATM -, have a selective growth advantage compared to cells without these mutations.
Figure 1.3. Cancer cell signalling pathways and the cellular processes they regulate. All of the driver genes can be classified into one or more of 12 pathways (middle ring) that confer a selective growth advantage (inner circle). These pathways can themselves be further organized into three core cellular processes (outer ring). Figure from Vogelstein et al., 2013
1.2 Thyroid Carcinoma
The thyroid is an endocrine gland located in the anterior region of the neck. It consists of two lobes connected with the isthmus. In a healthy adult the thyroid gland weights about 15-35 g, but it can considerably increase in size and weight in pathological conditions. The thyroid gland, which is the largest endocrine organ in humans, regulates systemic metabolism through thyroid hormones, with an important physiological role in skeletal development and brain, as well as in regulating the body's metabolism and the development of skin, subcutaneous tissue and organs.
It is composed of two distinct hormone-producing cell types, follicular and parafollicular C cells. Follicular cells comprise most of the epithelium and are responsible for iodine uptake and thyroid hormone synthesis, triiodothyronine (T3) and thyroxine (T4). The synthesis requires enzymatic activity provided by thyroxine peroxidase (TPO). The hormones are directly secreted in blood vessels bound to the thyroglobulin protein (Tg). T3 is the biologically active hormone and T4 can be converted to T3. C cells are scattered intrafollicular
or parafollicular cells that are dedicated to the production of calcitonin, the calcium-regulating hormone.
The activity of thyroid gland is mainly regulated by the secretion of thyroid stimulating hormone (TSH) from the pituitary gland, which is regulated by the thyrotropin-releasing hormone (TRH) from the hypothalamus (Figure 1.4). TSH stimulates growth of follicular epithelium and the synthesis of thyroid hormones. In turn, thyroid hormones exert negative feedback control on the hypothalamus as well as on the anterior pituitary, thus controlling the release of both TRH from hypothalamus and TSH from anterior pituitary gland (Dietrich JW et al. 2012). This control mechanism is compromised in pathological conditions such as the presence of thyroid carcinoma.
Thyroid cancer is the most common malignancy of the endocrine system and accounts for approximately 1% of all newly diagnosed cancer cases (Carlomagno e Santoro, 2011).
In spite of thyroid carcinoma being an uncommon type of tumor, over the past decades, increasing attention has been focused on this malignancy. In 1986, after the Chernobyl nuclear accident, the incidence of thyroid cancer dramatically increased among children who lived in the regions contaminated with radioactive isotopes. This attracted the attention of medical experts, resulting in increased awareness of the disease. Moreover, the thyroid covers a broad spectrum of malignancies, ranging from well-differentiated carcinomas to undifferentiated tumors, thus, thyroid tumors provide an ideal model for studying tumorigenesis in epithelial tissue.
According to the National Cancer Institute, the rate of increase in the incidence of thyroid cancer among women in the United States is more rapid than for all other types of tumors. In the last 30 years it has tripled, and for reasons not yet well understood it is about 3-4 times more common in women than men (Brown et al., 2011). Indeed, this neoplasia is becoming the seventh most common tumor in women (Pillai et al., 2015).
Approximately 95% of thyroid cancers arise from follicular cells - which is the most common endocrine malignancy - and it can be distinguished in papillary carcinoma (PTC), follicular carcinoma (FTC), poorly differentiated thyroid
carcinoma, and anaplastic thyroid carcinoma (ATC). Papillary carcinoma is the most common type of thyroid malignancy, comprising about 80–90% of all carcinomas (Ries et al., 2007; Davies et al., 2006).
FTC represents about 15% of thyroid cancers and is very common in geographic regions where the addition of iodine in the diet is inadequate. The tumor is characterized by the presence of follicular structures well defined; the lesion appears surrounded by a capsule but the cells are often able to invade and metastasize through the blood into districts furthest such as bones and lungs (D’Avanzo et al., 2004). Mutations in RAS genes are very frequent in this cancer, however, in 30% of cases, rearrangements involving the gene PPARγ have been found (Kroll et al., 2000).
ATC constitutes about ~ 2% of cases and is very aggressive. The prognosis is often unfavorable and death occurs after 6 months from diagnosis. This tumor is typically made up of spindle cells mixed in giant cells cancer cells, which have lost partially or fully differentiated phenotype. In more than 50% of the cases were detected mutations in the gene encoding the p53 protein, which plays a crucial role in regulating the cell cycle, DNA repair and apoptosis (Taccaliti and Boscaro, 2009).
The remaining 5% of the cases is represented by medullary thyroid carcinoma (MTC), which is a neoplasm arising from the calcitonin-producing C thyroid cells derived from neural crest (Mears L and Diaz-Cano, 2003; Skinner et al., 2005). In the majority of cases (~ 75%), this cancer occurs as a sporadic tumor, whereas the remaining ones are part of familial disorders (Kloos et al. 2009). The hereditary forms are caused by a mutation in the "rearranged during transfection" (RET) gene, of which familial MTC (FMTC), MEN2A and MEN2B variants are discerned. Hereditary forms are transmitted with an autosomal rate in patients with an autosomal dominant pattern with high penetrance (>90%; Weels Jr 2000).
Figure 1.4. Hypothalamic-Pituitary-Thyroid Axis. Solid lines correspond to stimulatory effects, and dotted lines depict inhibitory effects. Conversion of T4 to T3 in the pituitary and the hypothalamus is mediated by 5′-deiodinase type II. This event also is important throughout the central nervous system, thyroid, and muscle. 5′-Deiodinase type I (propylthiouracil-sensitive) plays a major role in liver, kidney, and thyroid function. TRH, Thyrotropin-releasing hormone; TSH, Thyroid-stimulating hormone.
1.2.1 Papillary Thyroid Carcinoma
Papillary thyroid carcinoma is the most common malignant tumour of thyroid gland in countries having iodine-sufficient or iodine-excess diets, and comprises about 80–85% of thyroid malignancies. PTCs tend to be biologically indolent and have an excellent prognosis (survival rates of 95% at 25 years). Papillary carcinoma can occur at any age and rarely has been diagnosed as a congenital. Most tumors are diagnosed in patients in the third to fifth decades of life. Women are affected more frequently than men in ratios of 2:1 to 4:1 (Mazzaferri et al., 2002).
The gross appearance of papillary thyroid cancer is quite variable. The lesions may appear anywhere within the gland. By definition, typical papillary carcinomas often average 2–3 cm, although lesions may be quite large. The lesions are solid and usually white in color with an invasive appearance. Lesional calcification is a common feature. In addition, cyst formation may be
observed. Indeed, some lesions may be rarely almost completely cystic making diagnosis difficult (Rosai et al., 1992; Carcangui et al., 1985).
Microscopically, papillary carcinomas share common features. The neoplastic papillae contain a central core of fibro-vascular (occasionally just fibrous) tissue lined by one or occasionally several layers of cells with crowded oval nuclei (LiVolsi et al., 2011; Hawk W and Hazard J; 1976).
Papillary thyroid tumors will be composed mostly of papillary areas (Figure 1.5), but a large number will also contain follicular areas. The tumor cells are usually cuboidal or columnar. About the 80% of such lesions contain clear nuclei, in the 80–85% are seen intranuclear inclusions, whereas, nuclear grooves are seen in almost all the cases (Baloch et al., 2008; Scopa et al., 1993; Deligeorgi-Politi H, 1987).
Moreover, psammoma bodies, formed by calcium deposits, are found inabout 40-50% of cases, which within the cores of papillae, in the tumor stroma, or in lymphatic vessels, but not within the neoplastic follicles (LiVolsi, 2011). The evidence of psammoma bodies in a cervical lymph node is indicative of a papillary carcinoma in the thyroid. Psammoma bodies are rare in benign thyroid (only 1% of psammoma bodies are in benign glands).
The primary tumor can invade lymphatic vessels leading to multifocal lesions and to regional node metastases. Whether the lymphatic invasion itself causes metastases in distinct foci within the thyroid or whether these foci represent independent clonal proliferations is still debated. On the other hand, venous invasion is rare; indeed, metastases outside the neck are unusual, occurring only in 5–7% of cases, predominately in lung and bones (LiVolsi et al., 2011). Despite the presence of multiple metastases, in ordinary papillary carcinoma, death is uncommon.
Figure 1.5. Microscopic appearance of a papillary carcinoma of the thyroid. The fronds of tissue have thin fibrovascular cores. The fronds have an overall papillary pattern.
1.2.2 Molecular genetics alteration in Papillary Thyroid Carcinoma
During the past decade there has been an increasing number of publications about genetic alteration in thyroid tumors (Xing 2013). More than 70% of PTCs carry mutations in two genes coding for Mitogen-Activated Protein Kinase (MAPK) signaling pathway effectors - a serine-threonine kinase, BRAF and a GTP-binding protein, RAS – and rearrangements in two tyrosine kinases receptors – RET and NTRK1 (also known as TRKA), which play a role in the regulation of growth, differentiation and programmed cell death of neurons in the peripheral and the central nervous system (Teng and Hempstead, 2004). These alterations are mutually exclusive in PTCs patients, suggesting that the alteration, leading to the constitutive activation, in one of these genes is sufficient for cell transformation and hyper-activation of MAPK pathway and is essential for papillary tumor initiation (Santoro and Carlomagno, 2013; Kimura et al., 2003; Soares et al., 2003; Frattini et al., 2004).
BRAF gene
BRAF gene, located on the long arm of chromosome 7, encodes a serine/threonine protein kinase involved in the epidermal growth factor receptor (EGFR)-mediated MAPK pathway, where it is activated by RAS small GTPase (Lavoie H and Therrien M, 2015). Moreover, BRAF can affect other
key cellular processes, such as cell migration (through RHO small GTPases), apoptosis (through the regulation of BCL-2), and survival (through the HIPPO pathway; Matallanas D et al., 2011). Thus, it is not a surprise that BRAF is constitutively activated by mutation in 15% of all human known cancer types. Several mutations, affecting different regions of the protein, have been identified. However, despite more than 40 mutations have been so far identified in BRAF gene, the vast majority (up to 80%) of mutated BRAF-related tumors carry the 1799T>A (Davies et al., 2002). This mutation frequently occurs in thyroid cancer (Xing 2005) and causes V600E (valine with glutamic acid) amino acid change in the BRAF protein, resulting in the constitutive BRAF kinase activation, with a high oncogenic ability (Davies et al., 2002; Dhomen et al., 2007; Fukushima et al., 2003; Wan et al., 2004). BRAF V600E mutation can both initiate tumorigenesis in normal thyroid follicular cells and maintain and promote thyroid cancer progression (Nucera et al., 2009).
RAS gene
RAS genes encode proteins involved in key intracellular signal transducers that can activate several downstream pathways, RAF-MEK-ERK and PIK3K pathway (Peyssonnaux C and Eychene, 2001). Mutations in RAS genes – NRAS, HRAS, and KRAS – usually occur in codons 12, 13 or 61 of any of the three genes. These alterations - common in FTA and FTC and less frequent, in PTC (Bos, 1989) - produce constitutively active RAS proteins. The mutations associated to PTC predominantly involve codons 61 of NRAS and, to a less extent, of HRAS (Vasko et al., 2003; Zhu et al., 2003; Di Cristofaro et al., 2006)
RET/PTC rearrangements
The rearrangements of RET involve its fusion to heterologous genes (Nikiforov, 2002) and result in constitutive activation of tyrosine kinase domain leading to the formation of tumorigenic chimeric proteins.
The RET proto-oncogene is localized on chromosome 10q11.2 and is composed of 21 exons spanning a region of 55,000 bp. It encodes a single-pass trans-membrane tyrosine kinase receptor (Takahashi, 1988). It is
constituted by three functional domains: an extracellular ligand binding domain, a hydrophobic transmembrane domain, composed of 22 amino acids, among which S649 and S653 mediate self-association and dimerization of RET, and an intracellular tyrosine kinase (TK) domain. RET has several autophosphorylation sites (Kawamoto et al. 2004). RET tyrosine 1062 (Y1062) is a multidocking site for signalling molecules, which, in turn, contribute to the activation of RAS-MAPK and PI3K (phosphatidyl inositol 3 kinase)-AKTpathways. These signalling cascades is involved in cell survival, proliferation, and motility (Alberti et al. 1998; Murakami et al. 1999; Segouffin-Cariou and Billaud 2000; Melillo et al. 2001).
The ligands of RET receptor are neurotrophic growth factors belonging to the glial cell line-derived neurotrophic factor family (GNDF) (Sugg et al., 1998). GNDF binding causes receptor dimerization, autophosphorylation of Y1062, and activation of the signalling cascade.
In the thyroid gland the RET gene is expressed at high levels only in the parafollicular cells, but not in the follicular cells in which it can be activated by the fusion of the 3’ portion of the RET gene (from exon 12 to the 30-end) to the 5’ portion and to the promoter sequence of to various heterologous genes (Grieco et al. 1990; Nikiforov and Nikiforova 2011). Such chromosomal aberrations result in chimeric oncogenes, known as RET/PTC. To date, at least 11 different RET/PTC fusions have been reported. Common RET/PTC rearrangements (90% of the cases) are RET/PTC1 and RET/PTC3, involving RET and CCDC6 or NCOA4 genes (both localized in chromosome 10), respectively (Santoro and Carlomagno, 2013).
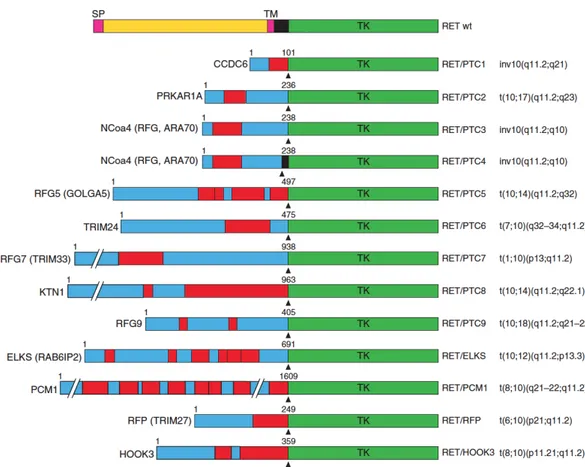
RET/PTC1, RET/PTC3 are generated through a paracentric inversion of the long arm of chromosome 10 (Grieco et al. 1990; Santoro et al. 1994). Other RET/PTC variants are either rare (RET/PTC2) or identified only in single cases of radiation-induced PTC, and are generated by translocations between different chromosomes (Figure 1.6).
Figure 1.6. Schematic representation of RET/PTC oncoproteins. On the top, wild-type RET protein is illustrated. For each RET/PTC rearrangement, the name of the fusion partner is indicated on the left and the corresponding chromosomal alteration is indicated on the right. The fusion points are indicated by arrowheads. The length in amino acids of the partner protein portion is also indicated. Boxes in red indicate dimerization (coiled-coil) domains. SP, Signal peptide; TM, transmembrane domain; TK, tyrosine kinase domain.
RET/PTC fusions are tumorigenic in follicular cells; indeed, they transform thyroid cells in culture (Santoro et al., 1993) and give rise to thyroid carcinomas in transgenic mice (Santoro et al., 1996).
RET/PTC is found in 20–40% of adult sporadic papillary carcinomas, but the percentages are even higher among children affected by papillary carcinomas after the Chernobyl nuclear accident (about 80% of tumors).
PAX8/PPARG and NTRK1 rearrangements
Oncogenic rearrangements of PPARG and NTRK1 genes are also found in PTC. PPARG, localized on chromosome 3, encodes a member of the
peroxisome proliferator-activated receptor (PPAR) subfamily of nuclear receptors. Translocations involving the DNA-binding domains of the transcription factor PAX8 (2q13) and the A-to-F domains of the peroxisome
proliferator-activated receptor γ (PPARG1) were found by Kroll and co-workers in FTC (Kroll et al., 2000). This event causes the loss of proper PAX8 and PPARG transcriptional function in the rearranged PAX8/PPARG fusion, that can act as dominant-negative (Kroll et al., 2000).
PAX8/PPARG fusions were detected in FTC but not in FTA, PTC, or multinodular hyperplasias, but recently they have been also described in relatively high percentage of cases of the follicular variant of PTC (37.5%, Castro et al., 2006).
The NTRK1 gene, localized in chromosome 1, codes for nerve growth factor (NGF) receptor, and its activation has been linked to the activation of the RAF-MEK-ERK pathway (Miller and Kaplan, 2001). NTRK1 rearrangements are rare, usually found in less than 10% of cases of sporadic PTC (Musholt et al., 2000; Kuo et al., 2000). The most common fusion type was between exon 4 of ETV6 gene and exon 14 of NTRK3, significantly more common in tumors associated with exposure to (131) I from the Chernobyl accident (Leeman-Neill RJ et al, 2013). The rearrangement results in a fusion protein constituted by of SAM domain of ETV6 and the tyrosine kinase domain of NTRK3, which lead to a constitutively active tyrosine kinase (Lannon and Sorensen, 2005).
1.3 RNA-Sequencing
Ten years ago, the idea that all of the genes altered in cancer could be identified at base-pair resolution would have seemed like science fiction. Today, such genome-wide analysis, through exome, whole genome, or transcriptome sequencing is ordinary.
The introduction of Next-Generation Sequencing (NGS) technologies has significantly impacted cancer research (Costa et al., 2013; Hoadley et al., 2014).
High-throughput sequencing technologies are widely used in biomedical research. Indeed, NGS technologies overcame many of the limitations dictated by previous technologies, such as cross-hybridization background, signal saturation-induced and range limitation in array technology (Costa et al., 2013; Hoadley et al., 2014). Moreover, these high-throughput technologies
produce complex datasets at single nucleotide resolution and at reduced cost, offering the opportunity to investigate on a wide scale both genomics, epigenetics and transcriptional aspects of cells and tissues, in a deep and comprehensive manner.
In May 2008, five articles introducing a new technique that has been upsetting microarray were published online on Science, Cell, Nature and Nature Methods. The method named RNA-Sequencing (RNA-Seq) provides higher resolution snapshot of the transcriptome than what was the standard before. RNA-Sequencing is perhaps one of the most complex next-generation applications. It consists in a set of experimental procedure that starting from entire RNA molecules generates cDNA sequences, followed by library construction and massively parallel deep sequencing. It allows in a single experiment to analyse expression levels, differential splicing, allele-specific expression, RNA editing and fusion transcripts for both coding and non coding RNAs in disease-related studies (Costa et al., 2010).
Gene expression is known to be tissue-, cell-type-, time- and stimulus-dependent, and many transcripts are only expressed under very specific conditions. RNA-Seq allows the quantification of abundance level of each transcript during defined developmental stages, under specific treatment or in physiological and/or pathological conditions (Costa et al., 2013). In contrast to microarray, it is not limited to the interrogation of selected probes on an array and can be also applied in species, for which the whole reference genome is not assembled yet.
Moreover, RNA-Seq can also be exploratory. Recently, it was appreciated that 85% of the human genome is transcribed and in contrast, only 2-3% of the genome encodes protein-coding genes (Hangauer et al., 2013), and a lot of other non-coding RNAs classes have been discovered. For instance, RNA-Seq allowed the discovery of a novel class of long non coding RNAs, named “enhancer RNA”, a class of transcript directly transcribed from the enhancer region, involved in epigenetic gene regulation. In addition, RNA-Seq allows the analysis of transcriptional start sites (TSSs) revealing alternative promoter usage, and premature transcription termination at the 3’ of untranslated
regions (UTRs), which is critical from mRNA stability (Griffith M et al. 2010; Picardi et al., 2010; Wang 2008).
More recently, RNA-Seq has been used to identify allele-specific expression, disease-associated single nucleotide polymorphisms (SNPs) and mutation, as well as gene fusions and alterations involved in cancer pathogenesis (Maher et al., 2009; Supper et al., 2013).
This technology relies heavily on deep sequencing which means that every RNA molecule in the samples is sequenced hundreds or thousands of times (Meyerson, et al., 2010). In general, RNA population (total or fractionated, such as poly(A)+) is converted to a library of cDNA fragments with adaptors attached to one (single-end sequencing) or both ends (paired-end sequencing). Each molecule is then sequenced in a high-throughput manner to obtain short sequences typically ranging from 30 to 400 bp, depending on the DNA-Sequencing technology used. Various sequencing platforms are supported including Illumina, Life Sciences, Roche 454, Applied Biosystems and Helicos Biosciences. After sequencing, the resulting reads can be both aligned to a reference genome or reference transcriptome or assembled de novo if the genomic sequence in unknown (Wang et al., 2009).
1.3.1 Illumina sequencing technology
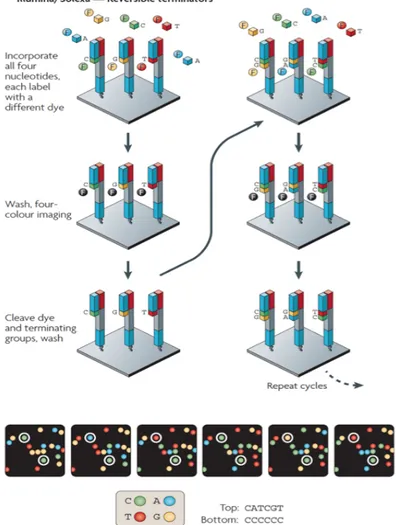
In the project described in this PhD thesis we have used Illumina technology for the sequencing of RNA samples. The single molecule amplification step for the Illumina starts with an Illumina-specific adapter library, takes place on the oligo-derivatized surface of a flow cell, and is performed by an automated device called a Cluster Station (Figure 1.7). Illumina sequencing is based on standard dideoxy method. cDNA fragments are immobilized on a surface of a flow cell to produce multiple DNA copies, or clusters, that each represent the single molecule that initiated the cluster amplification (Metzker et al., 2009). This system utilizes a sequencing-by-synthesis approach in which the flow cell channels receives a DNA polymerase cocktail with different fluorescently labelled nucleotides A, T, G and C. Different fluorescent molecules are attached to the four nucleobases that thus emit four different wavelengths. Specifically, the nucleotides carry a base-unique fluorescent label and the 3′
-OH group is chemically blocked such that each incorporation is a unique event. The cycles of sequencing are regulated by this block so fluorescent signal can be read correctly. After each imaging step, the 3′blocking group is chemically removed to prepare each strand for the next incorporation. This series of steps continues for a specific number of cycles, as determined by user-defined instrument settings, which permits discrete read lengths of 25–35 bases. A base-calling algorithm assigns sequences and associated quality values to each read and a quality-checking pipeline evaluates the Illumina data from each run (Metzker et al., 2008; Figure 1.7).
Figure 1.7. Four-colour and one-colour cyclic reversible termination methods. A) The four-colour cyclic reversible termination (CRT) method uses Illumina/Solexa’s 3′-O-azidomethyl reversible terminator chemistry using solid-phase-amplified template clusters. Following imaging, a cleavage step removes the fluorescent dyes and regenerates the 3′-OH group using the reducing agent tris(2-carboxyethyl)phosphine (TCEP). B) The four-colour images highlight the sequencing data from two clonally amplified templates. From Metzker, 2010.
1.3.2 RNA-Sequencing data analysis
The unprecedented level of data produced by NGS platforms requires a considerable effort in the development of new bioinformatics tools to deal with these massive data files since data analysis is very expensive in term of memory and computational time. The RNA-Seq data generation is an ever-evolving process, which requires a parallel development in sequencing technologies, experiment designs, and computational algorithms. In light of this, bioinformatics tools with improved performances are emerging constantly.
After image and signal processing the output of a RNA-Seq experiment consists of ten to thousand of millions of short reads (or raw reads). The raw reads are the starting material of the computational analysis that include quality assessment, reads mapping, gene quantification and differential gene expression – in a standard RNA-Seq analysis – and/or alternative splicing identification/quantification, variants' calling and gene fusion detection, depending on the experimental purpose.
Quality assessment
Since raw reads derive from a multiple-step process involving sample preparation, fragmentation, amplification, and sequencing, the quality assessment represents the first step of the bioinformatics workflow of RNA-Seq. Often, it is necessary to filter data, trimming low-quality bases, adaptors, or overrepresented sequences to remove undesirable biases in the analysis.
Reads mapping
Once high-quality data are obtained from pre-processing, the next step consists of mapping the sequence reads to a reference genome (and/or to known annotated transcribed sequences) if available, or de novo assembling to produce a genome-scale transcriptional map. This procedure refers to the classic bioinformatics problem of obtaining the more accurate mapping possible in a speed- and memory-efficient manner. The introduction of algorithms that are based on transcriptome mapping before a genome
mapping step avoid erroneous mapping of the reads to pseudogenes, generally improving the overall alignment accuracy.
Reads counting
The number of RNA-Seq reads that map to a gene is a direct measure of the gene’s expression level. Such approach can both help in quantifying known elements (i.e., genes or already annotated exons) and/or in detecting new transcribed regions, defined as transcribed segments of DNA that are not yet annotated as exons in public databases (Costa et al., 2010). This step provides the expression of a given gene as the total number of reads mapping to the coordinates of each annotated element. After getting the read counts, data normalization is one of the most crucial steps in data processing, as it is essential to ensure accurate inference of gene expression. Reads counts can be normalized for the length of the transcribed element and the number of mapped reads for each sample. Marioni and colleagues proposed a quantitative normalized measure of gene expression, i.e. the Reads Per Kilobase per Million of mapped reads (RPKM), to compare both different genes within the same sample and the same gene across distinct biological conditions (Marioni et al., 2008).
Differential expression analysis
An important application of RNA-Seq is transcriptomes' comparison between pathological and physiological conditions, across different developmental stages, or between specific experimental stimuli. This type of analysis requires identification of genes and/or transcripts with different expression through the comparison of two or multiple samples (Costa et al., 2010). It is essential for interpreting the functional elements of the genome and uncovering the transcriptome complexity, providing important insights in the biological mechanisms of development and diseases.
Detection of fusion genes
Gene fusions have gained attention because of their relationship with cancer. Different tools have been developed to analyze fusion events in RNA-Seq data.
After the reads' mapping step, there will be a pool of unmapped short reads (i.e reads not mapping within an exon or to exon-exon junctions). These unmapped reads can be processed by specific algorithms to determine whether they match an exon-exon junction where the exons come from different genes. This would be evidence of a possible fusion event.
Detection of nucleotide variants
RNA-Seq data are generally used to study gene expression, or to perform novel gene/isoforms' identification and quantification. However, very recently RNA-Seq data have been also used for the identification of expressed mutations, especially in tumor samples. In this approach there are many limitations, such as the unbalanced coverage between different genes. Among many variants calling and annotation methods the best practical workflow to identify mutations from RNA-seq data has been provided by GATK although it is still far from perfect and under heavy development
(http://gatkforums.broadinstitute.org/discussion/3891/calling-variants-in-rnaseq).
1.3.3 RNA-Seq in Papillary thyroid carcinoma
In recent years, the introduction and the rapid development of new technologies for the sequencing of nucleic acids, has revolutionized the study of cancer genetics (Costa et al., 2010; Costa et al., 2013). In particular, RNA-Seq has provided a tool to simultaneously investigate all genomic as well as transcriptome alterations occurring in the same cancer cells.
These technologies have recently been used to study mutations in different types of cancers, in order to improve diagnostic and prognostic abilities, as well as the individual response to treatment.
Recent NGS-based studies have explored the mutational landscape and gene expression profiles of PTCs.Smallridge and colleagues performed RNA-Seq to explore the transcriptome of BRAF- and not BRAF-mutated PTCs.
Such analysis revealed different gene expression between the two groups of patients; they found that about 50 of differentially expressed genes were related to immune functions. Moreover, through NGS they also identified 4
fusion genes in PTC samples (i.e. CKLF3-CMTM4, ETV6-NTRK3, MKRN1-BRAF and PPIP5K1-CATSPER2). Notably, CKLF3-CMTM4, ETV6-NTRK3, MKRN1-BRAF gene fusions have been found in three different not BRAF-mutated PTC samples, indicating that these may potentially represent new driver events, although with a very rare occurrence (Smallridge et al., 2014). Similarly, Leeman-Neill and colleagues performed RNA-Seq to identify new chromosomal rearrangements in patients exposed to ionizing radiations. They found that ETV6-NTRK3, RET/PTC and PAX8-PPARγ rearrangements are significantly more common than point mutations in PTCs associated with exposure to 131I.
Recently, the seminal work of The Cancer Genome Atlas (TCGA) Research Network has explored more than 400 PTCs(Cancer Genome Atlas Research Network 2014). In this study, the authors have described a comprehensive multiplatform analysis of the genetic landscape of PTC, performed by SNP arrays, exomes, RNA-Seq, miRNA-Seq, DNA methylation and targeted sequencing. One of the most significant advances was the identification of somatic mutations (single nucleotide variants, INDELSs and gene fusions) as potential new tumor-initiating events - i.e. the ‘‘dark matter’’ - in patients without any known driver lesion. In particular, the authors identified EIF1AX, PPM1D and CHEK2 as new driver genes in PTC, and also discovered TERT promoter mutations in a subset of aggressive and less-differentiated PTCs, strongly correlated to a high risk of recurrence. Gene and miRNA expression analysis also allowed defining clinically relevant subclasses potentially correlated to loss of differentiation and tumor progression (e.g. over-expressed miR-21 in association with aggressive tall cell variant of PTC).
1.4. Long Non coding RNAs
Over the past decade, evidence from numerous high-throughput genomic platforms suggests that complexity of the organism is mainly due to the expansion of the non coding portions of the genome (Mattick, 2004). Indeed, the portion of the genome responsible for protein coding constitutes approximately 2%, while many noncoding regulatory elements are transcribed
into non coding RNA (ncRNA). Non-coding RNAs are divided into two major classes based on their size: 1) small ncRNAs (sncRNAs, 20-30 nt) which are critical post-transcriptional regulators of target RNAs via RNA interference (RNAi), and/or able to modify other RNAs, including the widely-studied class of microRNAs (miRNAs), piwi-interacting RNAs (piRNAs) and small nucleolar RNAs (snoRNAs), and 2) the heterogeneous group of long ncRNAs (lncRNAs).
With the term lncRNA we define a class of transcripts longer than 200 bp without the protein coding capacity (Derrien and Jhonson et al., 2012).
These transcripts are characterized by relatively low levels of evolutionary conservation, fewer exons than protein coding genes in average, and high tissue-specificity (Guttman and Rinn, 2012; Kapranov et al., 2007; Clark and Mattik, 2011). On the other hand, they exhibit some similarities with protein coding transcripts; for instance, they are transcribed by RNA polymerase II and can be capped, polyadenylated and spliced. They can localize both in nucleus, acting mainly as epigenetic modulators, and in cytoplasm, where they can act as post-transcription regulators (Fatica and Bozzoni, 2014; Vance and Ponting, 2014).
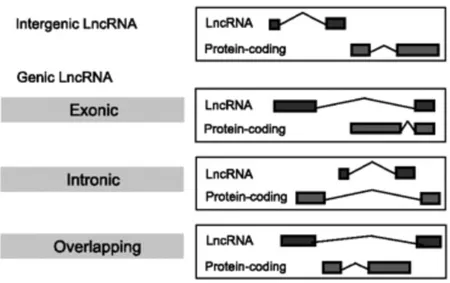
According to the GENCODE Consortium (Derrien and Jhonson et al., 2011), lncRNAs can be classified with respect to protein-coding genes in "antisense" (if they intersect protein-coding loci on the opposite strand), "lincRNA" (long intergenic non-coding RNA), "sense overlapping" (that overlap intron and exon of a coding gene on the same strand), "sense intronic" (within the intron of a coding gene on the same strand), "processed transcript" (without ORF and not classified in the other categories because of their complexity; Figure 1.8)
Figure 1.8. LncRNAs classification according to GENCODE catalogue (Derrien et al., 2011)
While the nomenclature is still evolving, lncRNAs typically refers to polyadenylated lncRNAs that are transcribed by RNA polymerase II and associated with epigenetic signatures common to protein-coding genes, such as trimethylation of histone 3 lysine 4 (H3K4me3) at the transcriptional start sites (TSSs) and trimethylation of histone 3 lysine 36 (H3K36me3) throughout the gene body (Guttman et al., 2009).
1.4.1 Functions and mechanisms of lncRNAs
Like protein-coding genes, long ncRNAs cover a broad spectrum of functions. Compared with coding transcripts, lncRNAs are expressed at 10-fold lower levels on average, and their expression in different tissues and cell types has generally been found to be more cell type specific (Clark and Blackshaw, 2014).
Long ncRNAs are involved in transcriptional regulation of mRNA processing, which is reminiscent of miRNAs and may indicate a similar sequence-based mechanism to miRNA binding to seed sequences on target mRNAs. However, unlike miRNAs, long ncRNAs show a wide spectrum of biological contexts that demonstrate greater complexity to their functions.
They can act as positive and negative modulators of gene expression (Numata and Kiyosawa, 2012; Su et al., 2012; Johnsson et al., 2013),
involved in different functions, such as X inactivation (Brown et al., 1992; Lee 2009), imprinting, epigenetic regulation (Gupta et al., 2010; Tollervey et al., 2012) and can affect any step within the biogenesis or the mobilization of target mRNA, including transcription, splicing, nuclear and cytoplasmic trafficking and translation (Chen and Carmichael, 2010).
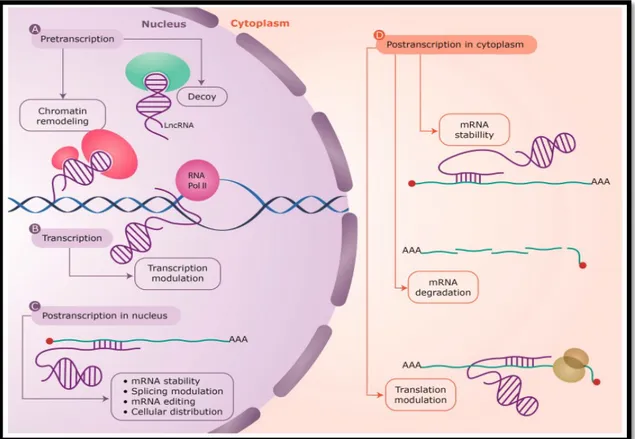
LncRNAs can impact genes localized on the same chromosome (cis-acting lncRNAs) or on other chromosomes (trans-acting lncRNAs); but their function is strictly related to their localization, in nucleus, where they can modulate gene expression at pre-transcriptional, co-transcriptional and post-transcriptional level, or in cytosol, where they act at post-post-transcriptional level (Figure 1.9).
Figure 1.9. LncRNAs have been found to act at every level of gene regulation: A) Pretranscriptional, as protein guides or acting as decoys holding proteins away from chromatin; B) Transcriptional, as modulators of transcription; C,D) Posttranscriptional, altering sense mRNA structure or cellular compartmental distribution either in the nucleus or the cytoplasm. LncRNAs are depicted in purple, with the interacting protein factors in green and light red. The mRNAs are shown as green lines and the base pair interactions highlighted by short purple lines. Also shown is the transcribing RNA polymerase II (RNA Pol II) on genomic
DNA (blue helix) and the translating ribosome (yellow) on the mRNA. Figure from Villegas and Zaphiropoulos, 2015.
Epigenetic transcriptional regulation
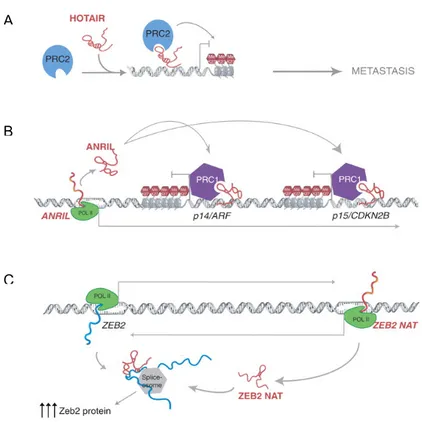
Studies about nuclear lncRNAs have mainly focused on their potential epigenetic regulation of target genes. Such a regulation typically results in gene transcriptional repression or activation. The first class of lncRNAs to be characterized has been the one containing lncRNA with repressive functions, including ANRIL, HOTAIR, H19, KCNQ1OT1, and XIST (Gibb et al., 2011; Yap et al., 2010; Rinn et al., 2007). These lncRNAs achieve their repressive function by coupling with histone modifying or chromatin remodelling protein complexes.
The most common protein partners of lncRNAs are the polycomb repressive complexes 1 and 2 (PRC1 and PRC2). These complexes can transfer the repressive post-translational modifications to specific amino acid positions on histone proteins, thereby inducing chromatin folding and heterochromatin formation in order to repress gene transcription. PRC1 may be comprised of numerous proteins, including BMI1, RING1, RING2 and Chromobox (CBX) proteins, which act as a multi-protein complex to ubiquitinate histone H2A at lysine 119 (Margueron and Reinberg, 2011). PRC2 is classically composed of EED, SUZ12, and EZH2, the latter of which is a histone methyltransferase enzymatic subunit that trimethylates histone 3 lysine 27 (Margueron and Reinberg, 2011). Both EZH2 and BMI1 genes are up-regulated in numerous common solid tumors, leading to tumor progression and aggressiveness (Margueron and Reinberg, 2011).
Even if, PRC1 and PRC2 are perhaps the most known partners of lncRNAs, numerous other epigenetic complexes are implicated in lncRNA-mediated gene regulation. For example, the 3’ domain of HOTAIR contains a binding site for the LSD1/CoREST, a histone deacetylase complex that facilitates gene repression by chromatin remodelling (Tsai et al., 2010). Similarly, AIR interacts with G9a, an H3K9 histone methyltransferase (Nagano et al., 2008). LncRNAs have been also observed in activating epigenetic complexes. For instance, HOTTIP interacts with WDR5 to mediate the recruitment of the MLL
histone methyltransferase to the distal HoxA locus. MLL transfers methyl groups to H3K4me3, generating open chromatin structures that promote gene transcription (Wang et al., 2011).
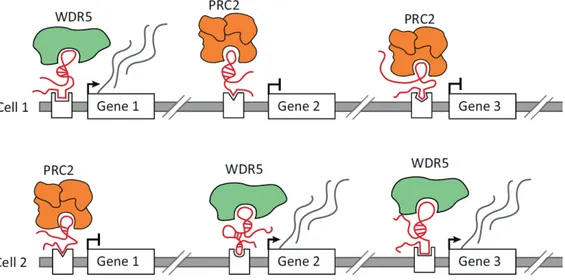
Moreover, lncRNAs can act as scaffold, serving as central platforms upon which relevant molecular components are assembled. By this mechanism, a lncRNA would bind its multiple effector partners, forming ribonucleoprotein complexes, which may have transcriptional activating or repressive activities, at the same time in the same space (Figure 1.10).
Figure 1.10. Long noncoding RNA (lncRNA)-mediated regulation of gene expression through the recruitment of chromatin regulatory proteins. (A) Different cell types express distinct lncRNAs that can differentially recruit these same chromatin regulatory proteins, including the repressive Polycomb Repressive Complex 2 (PRC2) and the activating WDR5 chromatin-modifying protein, to specific genes. Inset: lncRNAs can recruit these complexes by binding to target sites through three mechanisms: tethering to its nascent transcription locus (top panel); directly hybridizing to genomic targets (middle panel); or interacting with a DNA-binding protein (bottom panel). From Quinodoz and Guttman, Trends in Cell Biology, 2014
lncRNAs in post-transcriptional regulation: mRNA processing, stability, and translation