Doctoral Dissertation
PhD in Science, Technology and Biotechnology for Sustainability Curriculum: Forest Ecology
-XXIX cycle-
Effects of climate on deadwood decomposition dynamics and
interaction with the soil in Apennine and Alpine beech
forests
-BIO/07-Programme Coordinator Prof. Mauro Moresi
Tutor
Prof. M. Marchetti
Doctoral Candidate Giulia Fravolini
Università degli Studi della Tuscia in convenzione con l’Università del Molise
Department of Bioscience and Territory, University of Molise, Pesche (IS), Italy
Department of Biological, Agricultural and Forest Innovation (DIBAF), University of Tuscia, Viterbo (VT), Italy
2 Tutor: Prof. M. Marchetti
Full Professor. University of Molise Sciences and Technologies for the Environment and Territory Department Pesche (Is), Italy Co-Tutor: Prof. F. Lombardi
Associate Professor. Mediterranean University of Reggio Calabria AGRARIA Department Reggio Calabria, Italy
3
Life is short. Forgive quickly, Kiss slowly, Love truly, Laugh uncontrollably. And never regret anything that made you smile, or cry.
S. Bambarén
Trees are Earth's endless effort to speak to the listening heaven.
R. Tagore
Let’s take our hearts for a walk in the woods and listen to the magic whispers of old trees.
Author Unknown
Adopt the pace of nature: her secret is patience.
4 Table of Contents Abstract ... 5 List of Appendices ... 7 Extended Abstract ... 8 Experimental Procedure ... 10
Determination of the main physical properties ... 11
Introduction ... 17
Deadwood in forest ecosystems ... 19
Deadwood as indicator of biodiversity ... 23
Deadwood decay processes ... 28
State-of-the-Art ... 38
Thesis Aims and Questions ... 40
Summary of papers ... 41
Study areas ... 42
Climate and soil parameters are main drivers of the slow decay of Norway spruce in sub-alpine forests (Paper I) ... 43
Is climate the most important factor on deadwood decomposition in Apennine mountain forests? (Paper II) ... 46
Time since death and decay rate constants of Norway spruce and European larch deadwood in subalpine forests determined using dendrochronology and radiocarbon dating (Paper III) ... 47
Conclusions and Future Perspectives ... 50
Acknowledgements ... 52
List of papers (published or submitted). ... 53
References……….53 1 Appendix I……...………...66 2 Appendix II………79 3 Appendix III………113 4
Abstract
5
Fravolini G, 2016: Effects of climate on deadwood decomposition dynamics and 6
interaction with the soil in Apennine and Alpine beech forests. 7
Forests contribute to the sequestration of organic C and a key issue in C cycling in 8
forest ecosystems can be linked to deadwood dynamics. Deadwood and litter act as 9
important linkages between forest productivity and current community, an ecosystem 10
processes. In forest ecosystems, coarse woody debris (CWD) influences the nutrient 11
cycling, humus formation, carbon storage, fire frequency, water cycling and it 12
represents also a habitat for many organisms. While a broad range of literature about 13
CWD decay (above-ground) already exists, mechanisms describing the incorporation of 14
the woody necromass into humus forms are rather poorly investigated. 15
The objectives of this thesis are focused on providing a deeper understanding of 16
deadwood decay processes in forest ecosystems located in the Mediterranean and 17
Alpine montane areas. Moreover, this research project investigates the relationship 18
between deadwood decay, altitude and exposure, exploring the decomposition timing in 19
Apennine and Alpine forests, with the main aim to deeper understand the deadwood 20
decay processes in these climatic contexts. 21
In detail, the organic matter integration into the soil was investigated, focusing on the 22
CWD decay and its incorporation in the soil organic matter (SOM) through the analysis 23
of the wood biochemical compounds and soil chemical composition. 24
A climosequence approach was used to investigate the decay processes, comparing 25
along sites located on north- and south-facing slopes, at different elevations. An 26
accurate sampling configuration and experimental procedure was set up: at each site of 27
the climosequence, a field experiment using soil mesocosms (PVC tubes with deadwood 28
inside) was tested. Data were collected in Apennine (Fagus sylvatica) and Alpine 29
(Picea abies) forest types, in order to assess the variation of chemical and biochemical 30
compounds in CWD during the decay progression. Lignin and cellulose amounts were 31
quantified in 5 different decay stages of CWD in the Alpine sites (Picea abies and Larix 32
decidua).
33
Results showed that CWD decompose differently between Alps and Apennines, 34
depending on the tree species, climate factors and soil composition. In detail, CWD of 35
Fagus sylvatica decays very fast, while CWD decay progression of Picea abies is
36
lower, as demonstrated by the analysis of lignin and cellulose in the different 5 decay 37
stages. 38
6 In conclusion, these results represent a contribution to the knowledge on CWD decay 39
progression in Mediterranean and Subalpine forest ecosystems. However, further 40
studies are needed to deeper explore the factors influencing the deadwood decay rates, 41
in order to clarify the role of deadwood in contributing to the overall forest functioning 42 at different scales. 43 44 45 46 Key words 47
Deadwood, mountain forests, decay progression, lignin, cellulose, soil. 48
Author’s Address: Fravolini Giulia, Department of Bioscience and Territory, University of Molise, 49
Contrada Fonte Lappone, 86090 Pesche (IS), Italy 50
7 List of Appendices 51 52 Papers I-III 53
I. Fravolini, G., Egli, M., Derungs, C., Cherubini, P., Ascher-Jenull, J., Gómez-54
Brandón, M., Bardelli T., Tognetti R., Lombardi F., Marchetti, M. (2016). Soil 55
attributes and microclimate are important drivers of initial deadwood decay in 56
sub-alpine Norway spruce forests. Publ. - Science of The Total Environment, 569, 57
1064-1076. 58
II. Fravolini G., Egli M., Ascher-jenull J., Arfaioli P., Tognetti R., Cherubini P., 59
Lombardi F., Marchetti M. Quantifying decomposition in coarse woody debris in 60
Mediterranean mountain forests. - Subm. 61
III. Petrillo M., Cherubini P., Fravolini G., Ascher J., Schärer M., Synal H.-A., Bertoldi 62
D., Camin F., Larcher R., Egli M. (2016): "Time since death and decay rate 63
constants of Norway spruce and European larch deadwood in subalpine forests 64
determined using dendrochronology and radiocarbon dating. Publ. - 65
Biogeosciences, 13, 1537–1552, www.biogeosciences.net/13/1537/2016/ 66
doi:10.5194/bg-13-1537-2016 67
8 Extended Abstract
68
This PhD thesis dealt with CWD decay and integration into the soil of Fagus sylvatica 69
forests, in the Apennines (Majella Mt.) and Italian Alps (Val di Rabbi, Val di Sole), and 70
on how climate affects the CWD decay in subalpine natural forests, analysing the decay 71
rates and the relationship between lignin/cellulose decay and soil properties. 72
Deadwood is an important component in the functioning of forest ecosystems and their 73
structure, as it is relevant for biodiversity, trophic chains, forest natural regeneration, 74
nutrient cycles and overall carbon storage (Harmon et al., 1986; Franklin et al., 1987; 75
Jonsson and Kruys, 2001; Laiho and Prescott, 2004; Luyssaert et al., 2008; Russel et al., 76
2015). A special contribution to the maintenance of forest functions is provided by 77
CWD (coarse woody debris) residues of living trees in a forest ecosystem including 78
whole fallen trees, fallen branches, and pieces of fragmented wood, stumps and standing 79
dead trees (snags) (Zhou et al., 2007). 80
Field soil-warming experiments (e.g. Rustad et al., 2001; Melillo et al., 2002; Eliasson, 81
2005; Allison et al., 2010; Ågren, 2010; Budge et al., 2011) have provided evidences of 82
the particular sensitivity of litter decomposition to temperature. Consequently, a need 83
exists to explore more in detail the interplay between soils, forests, deadwood and 84
climate particularly in mountain areas (Egli et al., 2006; Ascher et al., 2012). 85
The decay rate of CWD is affected by several factors such as the ratio of bark to wood, 86
tree species, log diameter (or the geometry in general; MacMillan, 1988; Van der Wal et 87
al., 2007), contact with the forest floor (Ganjegunte et al., 2004), soil type (van der Wal 88
et al., 2007), and others. The negative exponential time model is the most commonly 89
used to estimate the decrease in density of CWD (Naesset, 1999; Chen et al., 2005). 90
Although the decay rate of CWD as a function of climate is basic information for 91
understanding the cycle of carbon and nutrients, only scarce data is available. Several 92
studies have been done in the North-Western Pacific in the U.S. and Canada (Harmon et 93
al., 1986; Daniels et al., 1997; Campbell and Laroque, 2007) while our knowledge 94
about decay rates of different tree species in European forest ecosystems is limited to 95
few experimental and field studies (Naesset, 1999; Storaunet and Rolstad, 2002; 96
Lombardi et al., 2008; Herrmann and Bauhus, 2012) or rough estimations and 97
modelling (Storaunet, 2004; Mäkinen et al., 2006). 98
Recently, more information on deadwood chemistry (even in Europe) as a function of 99
decay stage in temperate to subalpine environments is available (cf. Lombardi et al., 100
9 2008; Petrillo et al., 2015). The relation to the factor time is, however, in most cases 101
completely missing and only in rare cases some estimates are presented (e.g. Petrillo et 102
al., 2016). Detailed information on carbon stored in deadwood and its relationships with 103
different decay stages are required by national forest and carbon sink inventories to 104
understand deadwood dynamics and the impact on microhabitats with a changing 105
climate. These relationships are expected to vary with disturbance regime and forest 106
type. 107
The decay rate can be estimated by relating the time-since-death to the density loss or 108
mass loss of deadwood during a given time period (e.g. Busse, 1994; Melin et al., 109
2009). The decay rate is commonly expressed through a decay constant k, which 110
indicates the density loss or mass loss per year. This constant is derived from a decay 111
model (Harmon, 1986), which can be most simply expressed by the equation 112
xt = x0 e-kt (1)
113
(single-negative-exponential model), where xt is the density or mass of deadwood at a
114
given time, and x0 is the initial density or mass (Jenny et al., 1949; Olson, 1963).
115
To unravel the decay behaviour of these compounds, a multiple-exponential model can 116
be applied (Means et al., 1985; Mackensen et al., 2003), with the general form: 117
118
(2) 119
where xt is the density or mass of deadwood at a given time and x1…n are partitioned
120
parameters. The portioning of cellulose and lignin is solved graphically using their mass 121
over time, and fitting them to an exponential regression curve. From this, the half-life of 122
cellulose or lignin in the CWD could be calculated: 123
124
(3) 125
126
where t1/2 is the half-life and k is the decay constant (obtained from the exponential
127 regression curve). 128 𝑥 = 𝑥1𝑒−𝑘1𝑡+ 𝑥2𝑒−𝑘2𝑡… + 𝑥1𝑛𝑒−𝑘𝑛𝑡 𝑡1/2= ln (12) −𝑘
10
Experimental Procedure
129
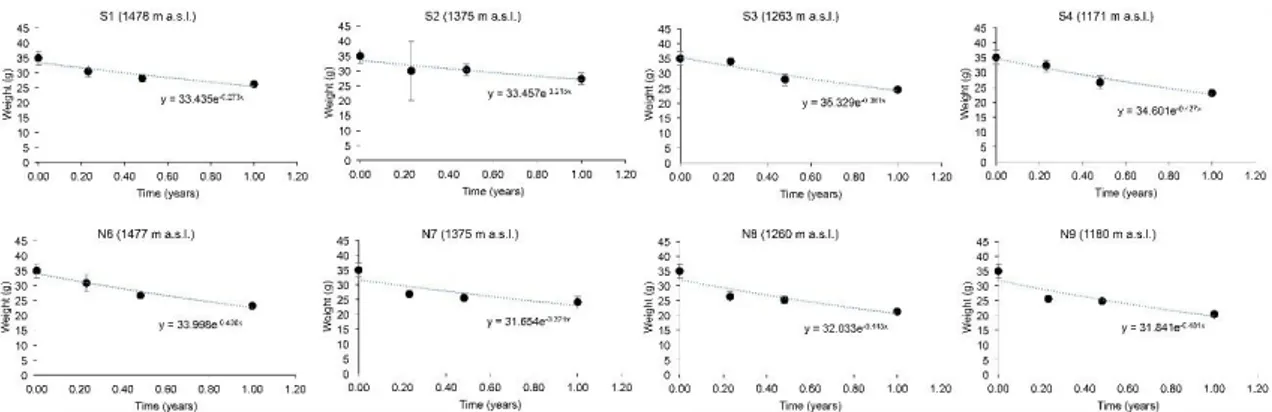
In this PhD thesis an experimental procedure was set up: at each site of the 130
climosequence, a field experiment using soil mesocosms was set up. The design of the 131
mesocosms in the field followed Maestrini et al. (2014). Mesocosms (10.2 cm diam., 20 132
cm long PVC tubes) were inserted (summer 2014) into the soil and then normed wood 133
blocks were added. The mesocosms were placed >1 m from large trees and >0.5 m from 134
the adjacent mesocosms. Coarse woody debris having a uniform size was added to the 135
soil mesocoms (with 3 replicates for each time step and site). Because the size and 136
geometry of CWD can strongly influence the decay mechanisms (Van der Wal et al., 137
2007), wood blocks, having the dimension of 2 cm x 5 cm x 5 cm, from the same Fagus 138
sylvatica tree were prepared. All wood blocks were placed on top of the soil and within
139
the mesocosms. The CWD wood blocks were sampled after 8, 16 and 52 weeks; always 140
with 3 replicates. The weight (density) and cellulose and lignin were recorded for these 141
blocks. 142
The wood cellulose extraction method begins weighing powdered samples into Teflon 143
pockets (10 mg). The first step is the washing of samples in 5% NaOH (Sodium 144
hydroxide) solution for two times at 60°C. Then samples are washed with 7% NaClO2
145
(Sodium chlorite) solution and 96% CH3COOH (acetic acid; until pH is between 4-5) at
146
60 °C for three times. This method eliminates lignin in the wood samples. 147
The method for extracting lignin from wood is a long procedure that begins with 148
extracting water-soluble compounds. It means that 80 °C ultrapure water is added to the 149
samples, mixed well and stirred for 3 times. After drying the procedure goes on with 150
extracting ethanol soluble compounds. So ethanol is added to all samples and mixed 151
well, centrifuged for three times. After that the samples with ethanol are filtered with 152
paper filters. Then 72% Sulphuric acid (H2SO4) is added in each sample also with
153
ultrapure water and put into the autoclave at 120 °C. This solution is then filtered in 154
ceramic crucibles. The lignin is measured in the crucibles (difference of weight gives 155
Klason lignin; Klason, 1893) and in the bottles that collect the discarded solution of the 156
samples (ASL, Acid Soluble Lignin; Klason, 1893). 157
The pH in the soil was measured through the Metrohm 620 pH-meter, while the 158
carbonates were analysed using NaOH (Sodium hydroxide) and HCl (Chloridric acid) 159
till the samples became pink. 160
11 Soil pH (H2O) was determined using a soil:solution ratio of 1:10. Particle
size-161
distribution of the <2 mm fraction was determined as weight percentage (USDA scale) 162
using the sieve-and-pipette method with prior oxidation of organic matter by 163
hypochlorite (NaClO) (Patruno et al., 1997). 164
Determination of the main physical properties
165
The cellulose was analysed as follows: 166
Cell % = (mg of cellulose *100)/mg of wood 167
Where cell mg of cellulose refers to weighed material in the Teflon bag after the whole 168
process, and mg of wood to wood weighed in the Teflon bag before the cellulose 169
extraction process (10 mg ca.). 170
The lignin extraction follows this formula: 171
(((a-b)-(c-b))/d)*100 172
Where a is the dry sample weighed in ceramic (mg), b is the ceramic tare, c is the 173
ceramic weight after incineration (550°C) and d is the weight of the sample at the 174
beginning of the extraction (300 mg ca.). 175
176
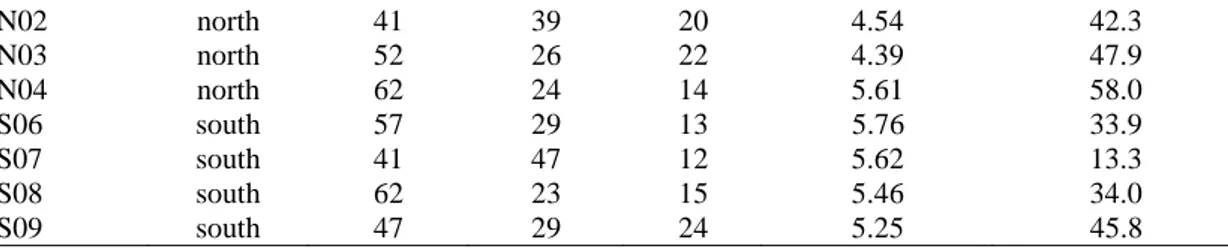
Table 1. Some typical characteristics of the soils (mesocosms) on the Apennines (1.a) 177
and on the Alps (1.b). 178
a) Apennines 179
Site Exposure pH (H2O) Moisture
(g) Sand (%) 500-250 um Sand (%) 250-53 um Silt (%) 53-2 um Clay (%) < 2 um S1 south 7.11 20,339 0,938 2,411 8,824 6,174 S2 south 7.15 15,639 1,805 7,619 6,861 2,214 S3 south 6.48 28,325 1,045 2,207 3,273 0,739 S4 south 6.61 24,78 1,331 5,832 6,78 2,053 N6 north 6.38 19,317 0,867 5,09 8,132 3,501 N7 north 6.95 23,752 2,458 7,598 13,46 4,962 N8 north 7.31 18,676 4,316 9,376 17,14 7,217 N9 north 7.2 20,824 1,757 17,89 5,700 5,013 180 b) Alps 181
Site Exposure Sand (%) Silt (%) Clay (%) pH (H2O) Moisture
(g)
12 N02 north 41 39 20 4.54 42.3 N03 north 52 26 22 4.39 47.9 N04 north 62 24 14 5.61 58.0 S06 south 57 29 13 5.76 33.9 S07 south 41 47 12 5.62 13.3 S08 south 62 23 15 5.46 34.0 S09 south 47 29 24 5.25 45.8 182
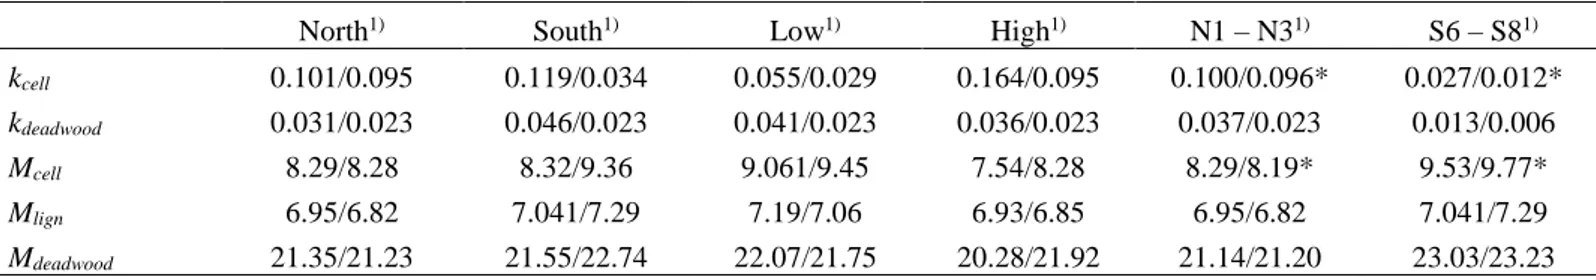
The following table shows decay constants, using Equation and Regression Approach. 183
The decay rate constants for beech CWD were estimated on the basis of the mass loss 184
within the observation period using a single negative exponential model and an 185
exponential regression approach. Both approaches yielded comparable values. Over 186
time, the detectable changes in wood mass and cellulose (less in lignin) appear to be 187
significant. Accordingly, the decay constants vary from 0.21 to a maximum of 0.49 y-1 188
(Table 7). The average k-values for CWD (mass loss per year) were in the range of 0.32 189
to 0.43 y-1, depending on the calculation procedure and exposure. 190
191
Table 2. CWD, cellulose and lignin decay constants k (y-1) based on a) equation 1, b) the
192
regression approach on the Apennines (2.a) and on the Alps (2.b). N= north-facing sites, S= 193 south-facing sites. 194 a) Apennines 195 Sites S1 S2 S3 S4 Average S N6 N7 N8 N9 Average N Average all CWD a) 0,29 0,25 0,36 0,42 0,33 0,46 0,41 0,37 0,49 0,43 0,38 b) 0,27 0,21 0,38 0,43 0,32 0,41 0,32 0,44 0,48 0,41 0,37 Cellulose a) 1,022 1,08 0,71 1,26 1,02 1,42 1,096 1,19 1,25 1,24 1,13 b) 0,975 1,051 0,742 1,321 1,022 1,034 1,107 1,189 0,853 1,046 1,034 Lignin a) 0,082 0,054 0,12 0,21 0,12 0,33 0,28 0,19 0,35 0,29 0,204 b) 0,059 0,015 0,15 0,22 0,112 0,292 0,191 0,299 0,44 0,306 0,209 196 b) Alps 197 Sites N1 N2 N3 N4 Average N S6 S7 S8 S9 Average S Average all CWD a) 0.080 0.036 -0.006 0.003 0.031 0.028 0.020 -0.009 0.145 0.046 0.039 b) 0.071 0.057 0.003 0.021 0.038 0.043 0.021 0.002 0.101 0.042 0.040 Cellulose a) 0.072 0.096 0.131 0.103 0.101 0.042 0.011 0.029 0.393 0.119 0.110 b) 0.078 0.128 0.135 0.127 0.117 0.062 0.077 0.052 0.347 0.116 0.117
13
Lignin
a) -0.004 0.035 0.030 -0.028 0.003 -0.018 -0.071 -0.047 0.130 -0.002 0.001
b) -0.004 0.092 0.031 -0.007 0.028 -0.027 -0.024 -0.029 0.089 0.002 0.015
* negative values are not possible for a decay, but are due to measurement uncertainties.
198 199
Statistical analysis
200
All statistical analyses were performed using the software IBM SPSS Statistics 21. The 201
distribution of each population was tested using the Shapiro Wilk normality-test. If the 202
result of the normality test was positive, parametric comparison methods were then 203
adopted through a t-test or an analysis of variance (ANOVA). Otherwise, non-204
parametric comparison tests were applied, i.e the Mann-Whitney (U-test) and the 205
Kruskal-Wallis test. These tests were used to see if differences between north- and 206
south-facing sites or along the altitudinal gradient exist with respect to the decay rates 207
(mass losses) of deadwood, cellulose or lignin. For the correlation analyses, the 208
Spearman rank correlation coefficient was used with non-normally distributed data. The 209
correlation analyses were applied to detect how the decay rates relate to (micro)climatic 210
conditions and soil parameters. 211
All statistical tests were carried out using a level of significance of p < 0.05. 212
213
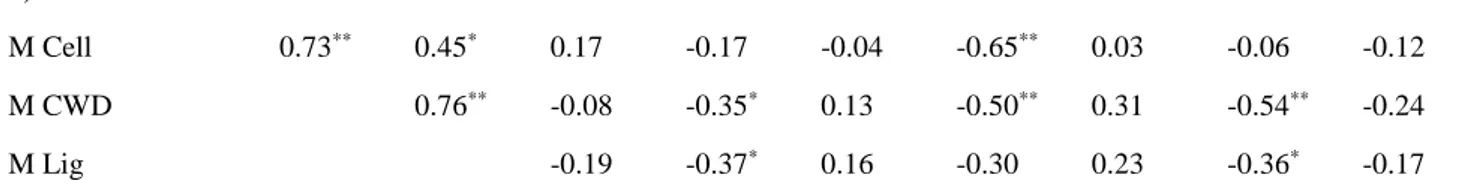
Table 3. Relationships (Spearman rank correlation coefficients) of a) decay constants of 214
cellulose and CWD and b) mass of cellulose, CWD and lignin with environmental and soil 215
parameters on the Apennines (3.a) and on the Alps (3.b). *p < 0.05, **p < 0.01 216
a) Apennines 217
k CWD k Lign pH Inorg C Org C N MAP MAAT Moist
a) decay constants k Cell 0.25 0.29 0.04 0.05 0.001 -0.23 0.03 0.19 0.01 k CWD 0.84** -0.11 -0.14 0.11 0.16 -0.37* 0.62** 0.10 k Lign -0.22 -0.12 0.14 0.26 -0.20 0.55** 0.13 pH 0.80** -0.71** -0.12 -0.24 0.31 -0.09 Inorg C -0.74** 0.16 -0.01 0.18 -0.16 Org C 0.06 0.25 -0.29 0.26 N 0.11 -0.20 MAP -0.83** -0.22 MAAT 0.12 Moist
14 b) Mass
M Cell 0.73** 0.45* 0.17 -0.17 -0.04 -0.65** 0.03 -0.06 -0.12
M CWD 0.76** -0.08 -0.35* 0.13 -0.50** 0.31 -0.54** -0.24
M Lig -0.19 -0.37* 0.16 -0.30 0.23 -0.36* -0.17
k Cell (decay constant of cellulose), k CWD (decay constant of CWD), k Lign (decay constant of lignin), M CWD
218
(mass of CWD), M Cell (Mass of cellulose), M Lig (Mass of lignin), Inorg C (inorganic carbon content), Org C
219
(organic carbon content), N (nitrogen content), MAP (mean annual precipitation), MAAT (mean annual air
220
temperature), Moist (soil moisture content).
221
b) Alps 222
k CWD MAP MAST pH MAAT Moist Clay Silt Sand
a) decay constants k Cell 0.46* 0.43* -0.26 -0.45* -0.52** 0.49* 0.61** -0.05 -0.11 k CWD 0.01 0.18 -0.05 -0.03 -0.03 0.23 0.14 -0.09 MAP -0.68** -0.29 -0.73** 0.78** 0.39 -0.42* 0.17 MAST 0.48* 0.81** -0.88** -0.41* 0.74** -0.47* pH 0.62** -0.48* -0.91** 0.11 0.32 MAAT -0.88** -0.60** 0.40 -0.11 Moist 0.52** -0.49* 0.26 Clay -0.14 -0.21 Silt -0.88**
M CWD M Lig MAP MAST pH MAAT Moist Clay Silt Sand
b) Mass
M Cell 0.80** 0.66** -0.43* 0.26 0.45* 0.52** -0.49* -0.61** 0.05 0.11
M CWD 0.86** -0.28 0.01 0.33 0.29 -0.22 -0.48* -0.16 0.27
M Lig -0.22 0.05 0.42* 0.26 -0.26 -0.56** -0.14 0.28
k Cell (decay constant of cellulose), k CWD (decay constant of CWD), M CWD (mass of CWD), M Cell (Mass of
223
cellulose), M Lig (Mass of lignin), MAP (mean annual precipitation), MAST (mean annual soil temperature),
224
MAAT (mean annual air temperature), Moist (soil moisture content)
225 226
In Table 3 and 4 the amount of cellulose and lignin is not displayed as a concentration 227
value but as a mass — obtained by multiplying the concentration of cellulose and lignin 228
with the CWD mass. 229
230
Table 4. Comparison of variables in South- and North-facing sites (using Mann-Whitney Test) 231
on Apennines (a) and Alps (b). 232
a) Apennines
15 North South k cell 1,28 1,02 k lign 0,27 0,12 k CWD 0,43 0,33 M cell 3,03 3,30 M lign 3,28 3,58 M CWD 10,42 11,80 234 b) Alps 235 North South k cell 0,91 0,094 K lign 0,691 0,092 K CWD 0,737 0,303 M cell 0,91 0,094 M lign 0,691 0,092 M CWD 0,988 0,095
k cell (decay constant of cellulose), k lign (decay constant of lignin), k CWD (decay constant of CWD), M
236
CWD (mass of CWD), M cell (Mass of cellulose), M lign (Mass of lignin), North (North-facing sites),
237
South (South-facing sites).
238 239
On the Apennines, already after 8 weeks, the lignin content of the dead wood increased 240
compared to the fresh wood. The cellulose analysis, however, showed a slight 241
decreasing trend (not always statistically significant), both for the north and the south 242
exposure. On the Alps, decay seems to be slower and, in most cases, the amount of 243
cellulose decreased with time while no significant variations were found for lignin. The 244
decay rate of cellulose not only correlates with climatic parameters such as annual 245
precipitation or mean annual temperature, but also with soil parameters such as pH and 246
soil moisture in all the sites. Especially at the highest altitudes this decreasing trend was 247
best expressed. The highest sites are the coolest and also have enough moisture during 248
the dry summer months. The amount of lignin does not seem to be affected by climatic 249
parameters. In addition, lignin significantly correlated with soil parameters such as 250
inorganic C, on the Apennines, and pH and soil texture, on the Alps. This correlation 251
analysis evidences the important role of soil parameters in the complex CWD decay 252
process. Despite all these potential ambiguities, our field experimental approach 253
confirms the fast decay rates of beech CWD in subalpine environments compared to 254
16 spruce. At the local scale (our investigation areas) - besides air temperature and annual 255
precipitation - also soil moisture influences the decay dynamics. However, not all wood 256
components react similarly. Cellulose is decaying much faster than lignin or the bulk 257
CWD. Consequently, particularly good correlations of cellulose with environmental and 258
soil parameters can be detected. The slower decay of lignin compared to cellulose 259
suggests that lignin is an important long-term stock of organic carbon, providing the 260
presence of a stable background source for the forest soil. 261
262 263
17 Introduction
264
In Europe, forests occupy about 160 million ha (35% of the EU’s land area). They are 265
home for the largest number of species on the continent and provide important 266
environmental functions, such as the conservation of biodiversity and the protection of 267
water and soil. The forests as CO2 sinks gained the highest global political significance
268
in relation to climate change and implementation of the Kyoto Protocol. The 269
atmospheric concentration of CO2 has increased from 280 ppm in 1750 to 367 ppm in
270
1999 (31%). About half of the anthropogenic CO2 emissions between 1750 and 2011
271
have occurred in the last 40 years (high confidence) (IPCC 2014). More recently, it 272
reached constantly a new record: 400 ppm. In November 2015, the Met Office (United 273
Kingdom's national weather service) predicted that mean concentrations of atmospheric 274
CO2 in May 2016 would reach 407.57 ppm, with a 0.5 ppm margin of error. In fact, 275
they reached 407.7. In October 2016, NOAA (U.S. National Oceanic and Athmospheric 276
Administration) measured 401.57 ppm in Mauna Loaa, Hawaii. The UN’s 277
Intergovernmental Panel on Climate Change (IPCC) says that CO2 concentrations must 278
be stabilized at 450 ppm to have a fair chance of avoiding global warming above 2 °C, 279
which could carry catastrophic consequences. Today’s CO2 concentration has not been
280
exceeded during the past 420,000 years and likely not during the past 20 million years. 281
The rate of increase over the past century is unprecedented, at least during the past 282
20,000 years (IPCC, 2001). The principal climate forcing, defined as an imposed 283
change of planetary energy balance, is increasing carbon dioxide (CO2) from fossil fuel
284
emissions, much of which will remain in the atmosphere for millennia (Hansen et al 285
2013), and from deforestation (IPCC, 2001). The emission of CO2 concentration from
286
industries, burning of fossil fuels and deforestation causes GHGs (green house gases). 287
Hence, forests in terms of agroforestry, plantation, reforestation has been suggested as 288
one of the most appropriate land management systems for mitigating atmospheric CO2
289
through photosynthesis process (Alemu 2014). Forest ecosystems also contribute to 290
store more than 80% of all terrestrial aboveground C and more than 70% of all SOC 291
(Soil Organic Carbon) (Alemu 2014). 292
Total anthropogenic GHG (greenhouse gases) emissions have continued to increase 293
over 1970 to 2010 with larger absolute increases between 2000 and 2010, despite a 294
growing number of climate change mitigation policies. Emissions of CO2 from fossil
295
fuel combustion and industrial processes contributed about 78% of the total GHG 296
18 emissions increase from 1970 to 2010, with a similar percentage contribution for the 297
increase during the period 2000 to 2010 (high confidence) (IPCC 2014). 298
Terrestrial ecosystems return carbon to the atmosphere by respiration, decay and fires 299
(Post et al., 1990). The terrestrial carbon reservoir is actually a collection of carbon 300
pools with a wide range of net primary production rates, respiration rates and carbon 301
turnover times (Post et al., 1990). The total net primary production of terrestrial 302
vegetation has been estimated in 1983 by Olson and his colleagues at 62 gigatons per 303
year. This is assumed to be approximately balanced, over a period of several years, by 304
an equivalent return of carbon to the atmosphere from decomposition of litter and soil 305
organic matter (Olson et al, 1983; Post et al., 1990). The return flow comes from two 306
pools of “dead” organic matter: the detritus/decomposer pool, made up of litter and 307
decomposers at the soil surface, and the active soil carbon pool, which consists of that 308
fraction of the carbon in soils, and the associated decomposer organisms, that are in 309
relatively active exchange with the atmosphere (Post et al., 1990). The turnover time of 310
carbon in the detritus/decomposer pool can range from less than a year in moist tropical 311
forests to decades in cold, dry boreal forests (Post et al., 1990). 312
The IPCC (Gitay et al., 2002), SEC (2006) and the EU Soil Thematic Strategy (COM 313
(2006)231) identified, among others, the following information needs: 314
- Understanding of the response of biodiversity to changes in climatic factors and other 315
pressure 316
- Closing the gaps in knowledge about soil processes and strengthening the foundation 317
for policies. 318
- Knowledge and concepts on how mountainous landscapes, including the soil system, 319
in the Mediterranean to high-mountain areas may change under conditions of fast to 320
accelerated external (climatic) forcing. 321
Mountainous ecosystems are likely to be especially sensitive to changing environmental 322
conditions, including global warming, acid deposition or nutrient cycling (Theurillat et 323
al., 1998). Landscape, climate, society and infrastructure in the mountainous areas are 324
changing at high rates (Haeberli et al., 2007). Mountainous areas are a complex system, 325
in which different features influence each other while reacting with different intensities 326
and time frames to changing environmental conditions. Unfavorable or threatening 327
19 processes need to be prevented or mitigated, in order to preserve the possibility of 328
sustainable development. 329
It is defined an ecologically sustainable forest management (ESFM) as forest 330
management that perpetuates ecosystem integrity while providing wood and nonwood 331
products; where ecosystem integrity means the maintenance of forest structural 332
complexity, species diversity and composition, and ecological processes and functions 333
within the bounds of normal disturbance regimes (Lindenmayer et al 2012). 334
The amounts and patterns of deadwood are therefore being increasingly used, both as an 335
index of current ecosystem health and as a means of setting standards for sustainable 336
forest management (Albrecht, 1991; Kohl, 1996; Tomppo, 1996). 337
Deadwood in forest ecosystems 338
Deadwood is a key indicator for assessing policy and management impacts on forest 339
biodiversity (Verkerk et al 2011). 340
Deadwood is an important component in the functioning of forest ecosystems and their 341
structure, as it is relevant for biodiversity, trophic chains, forest natural regeneration, 342
nutrient cycles and overall carbon storage (Harmon et al., 1986; Franklin et al., 1987; 343
Jonsson and Kruys, 2001; Laiho and Prescott, 2004; Luyssaert et al., 2008; Russel et al., 344
2015). A special contribution to the maintenance of forest functions is provided by 345
CWD (coarse woody debris) residues of living trees in a forest ecosystem including 346
whole fallen trees, fallen branches, and pieces of fragmented wood, stumps and standing 347
dead trees (snags) (Zhou et al., 2007). The decomposition of woody debris has an 348
important influence on carbon (C) retention in forest ecosystems (Yatskov et al. 2003). 349
Woody debris is also an important long-term nutrient storage (Harmon et al. 1986) and 350
is widely regarded as an important structural element for the provision of biodiversity 351
(Christensen et al. 2005). Low levels of woody debris are considered to be a major 352
factor causing the decrease in biodiversity in European forests (Schuck et al. 2004; 353
Christensen et al. 2005; Assmann et al. 2007; Böhl and Brändli 2007; von Oheimb et al. 354
2007). 355
The amount of woody debris is normally much lower in managed forests than in 356
unmanaged old-growth forests: most of the large-sized harvestable timber is extracted 357
from managed forests. The remaining trees produce woody debris consisting of twigs 358
20 and branches (Christensen et al. 2005). In Germany, branches and twigs have not been 359
used as firewood for several decades. As a result, fine woody debris (FWD) is readily 360
available in most forests (Röhrig 1991). However, the high number of endangered 361
species of saproxylic fauna (Berg et al. 1995; Binot et al. 1998; Ranius and Fahrig 2006; 362
Franc et al. 2007) requiring woody debris to survive, suggests that the availability of 363
coarse woody debris (CWD) in managed forests is insufficient (Muller-Using and 364
Bartsch, 2009). A certain level of CWD storage is a requirement for close-to-nature 365
forest management (Pommerening and Murphy 2004) and certification (FSC 2008; 366
PEFC 2008) of forests. Timber harvesting forests should function as links in a woody 367
debris habitat network (Scherzinger 1996; Ammer and Utschick 2004). However, 368
management concepts to achieve goals for European forests have not yet been 369
developed, because the factors influencing the quantity, quality, and dynamics of woody 370
debris are not sufficiently identified. Therefore, current models for CWD dynamics in 371
Europe (Rademacher and Winter 2003 for beech; Ranius et al. 2003 for spruce) cannot 372
be widely applied (Muller-Using and Bartsch, 2009). 373
Deadwood cycling is the process of components of wood (carbon, minerals, moisture, 374
and so on) in the forest ecosystem through the processes of death, decomposition, and 375
uptake. The changes of trees, which are the most significant structural features of 376
forests, during this process affect many other forest components and functions (Maser et 377
al. 1979; Maser and Trappe 1984; Maser et al. 1988; Hammond 1991). The amount of 378
CWD in any stand is a function of mortality agents, site conditions and exposure, and 379
decay mechanisms and rates (Harmon and Hua 1991). CWD biomass in some 380
coniferous ecosystems may exceed the total biomass of many deciduous ecosystems 381
(Spies and Cline 1988). Decay classification for CWD has been described by Maser et 382
al. (1988). The total volume or biomass of CWD varies with ecological condition (Spies 383
and Cline 1988; Lofroth, unpublished data). The substantial stocks of woody debris 384
(WD) – forested ecosystems constitute as much as 50% of total C in the terrestrial 385
biosphere (Malhi 2002) and WD represents up to 20% of the total in old-growth forests 386
(Delaney et al. 1998) – and its ecological importance have stimulated studies on various 387
aspects of their role in ecosystem processes (see reviews by Harmon & Sexton 1996; 388
Wirth et al. 2009). 389
Brewer (1993) reported that CWD in plots in some SBS (sub-boreal spruce) stands 390
ranged from 37 to 384 m3/ha. Mean volumes for all stand conditions and ages were 44.1 391
21 m3/ha in the SBSdk (dry-cool) subzone and 159.2 m3/ha in the SBSmc (moist-cold)
392
subzone (Lofroth, unpublished data). The driest sites had the lowest biomass and moist 393
sites the greatest in Douglas-fir forests of Washington and Oregon (Spies et al. 1988). 394
Within mature stands in the SBSmc (moist-cold) subzone, CWD volumes were lowest 395
in xeric ecosystems (Dry Pine: 36.2 m3/ha and highest in moist ecosystems (Devil's 396
Club: 268.4 m3/ha (Lofroth, unpublished data). Mean volumes of CWD in mature 397
stands by natural disturbance type (Province of British Columbia 1995) and 398
biogeoclimatic zone ranged from a low of 60 m3/ha in the Boreal Black and White 399
Spruce Zone in ecosystems with frequent stand-initiating events (NDT3) (Province of 400
British Columbia 1995) to a high of 390 m3/ha in the Coastal Western Hemlock Zone 401
in ecosystems with rare stand-initiating events (NDT1) (Lofroth, unpublished data). 402
Benson and Schlieter (1979) reported that CWD volumes were 210 m3/ha in dry-site 403
Douglas-fir stands, but as much as 560 m3/ha in grand fir stands.
404
CWD volumes also vary with successional stages. Mean volumes across a range of 405
moisture and nutrient regimes in the SBSmc (moist-cold) subzone were high in early 406
successional stages (herb/shrub) (174.2 m3/ha), declined to a low of 58.2 m3/ha in 407
young forest successional stages, and were highest in old-growth stands (261.5 m3/ha) 408
(Lofroth, unpublished data). Spies et al. (1988) reported that amounts of CWD were 409
high in the youngest successional stages, were lowest in 60-80-year-old forests, and 410
were high in old stands (< 500 years). After 500 years CWD amounts declined to an 411
intermediate level. Spies and Franklin (1988) reported that CWD input might be low in 412
young stands because of the small size of dead and dying stems. Volumes in these 413
stands are often high, however, due to residual CWD from the previous stand. The 414
amount of this residual CWD depends on the disturbance agent causing the change in 415
succession. In stands where succession has been retarded by natural catastrophic events 416
(windthrow, fire, etc.), it can be significant. Spies et al. (1988) suggest that the nature 417
and the timing of disturbance play a key role in CWD dynamics. Human-caused 418
changes (such as logging) will usually result in conditions different than those that may 419
have initiated the original stand. In these circumstances, the amount of CWD, as with 420
standing dead trees, may not be indicative of natural dynamics within ecosystems. 421
The rates of input and decay also vary with ecological site conditions and stand age, and 422
between tree species (Sollins 1982; Spies and Franklin 1988). Sollins (1982) reported 423
that although there was considerable variability in the data, the highest values for CWD 424
22 biomass were reported from old-growth stands. Harmon et al. (1987) reported that 425
decay rates of logs might vary with microclimate, size, substrate, and species of log. 426
Mattson et al. (1987) reported that decay rates varied by as much as tenfold between 427
tree species. They also reported that aspect was an important factor in determining 428
decay rates, and that logs suspended above the ground decayed at slower rates than 429
those on the ground. Keenan et al. (1993) attribute large accumulations of CWD in 430
western red cedar and western hemlock stands on Vancouver Island to slow 431
decomposition rates, high rates of input following windstorms, and the large size and 432
decay resistance of western redcedar. Abbott and Crossley (1982) reported that in 433
chestnut oak (Quercus prinus) stands, decomposition was influenced by moisture and 434
temperature and was inversely related to the diameter of the material. 435
Deadwood quantities are normally much lower in managed forests than in unmanaged 436
old-growth forests, as most of the large-sized harvestable timber is extracted (Green and 437
Peterken, 1997; Kirby et al., 1998; Odor and Standovar, 2001; Winter and Nowak, 438
2001). In addition, deadwood in managed stands typically consists only of small twigs 439
and branches and short stumps, with few large logs or snags found (Kruys et al., 1999). 440
In the interest of sustainable forestry and biodiversity conservation, efforts are being 441
made to increase deadwood levels in managed forests (e.g. Hodge and Peterken, 1998; 442
Harmon, 2001). In Europe, the volume of standing and fallen deadwood is one of nine 443
pan-European indicators for sustainable forest management (criterion 4: maintenance, 444
conservation and appropriate enhancement of biological diversity in forest ecosystems) 445
(MCPFE, 2003). 446
In central and southern Europe deadwood has received less attention (Bretz Guby and 447
Dobbertin, 1996; Marage and Lemperiere, 2005; Motta et al., 2006; Lombardi et al., 448
2008) and human pressure has affected forest dynamics since prehistoric times (Farrell 449
et al., 2000; Motta and Nola, 2001; Winter et al., 2010). In this context, quantity and 450
quality of coarse woody debris (CWD) are regarded as important structural indicators of 451
naturalness and biodiversity (Corona et al., 2003; MCPFE, 2003; Jönsson and Jonsson, 452
2007), providing information on the intensity of past human disturbances and closeness 453
to oldgrowth condition (Stokland, 2001; Woodall and Nagel, 2006). 454
The public attitude towards forests and forestry has dramatically changed (Castagneri et 455
al., 2010). Past management was concentrated on what was being extracted from the 456
forest, whereas current management emphasizes what is being left (Kohm and Franklin, 457
23 1997). In the past, CWD was routinely removed in an attempt to limit fuel loading 458
(thereby minimizing wildfires) and make replanting easier. Also, because of the slow 459
rate at which CWD decayed, its role in nutrient cycling, and therefore its importance, 460
was not well understood (Triska and Cromack 1979). 461
462
Deadwood as indicator of biodiversity 463
Climate is projected to affect all aspects of ecosystems functioning and biodiversity, and 464
their ability to provide services (The Millennium Assessment, 2005); however, the 465
projected changes have to take into account the impacts from other past, present and 466
future human activities (Gitay et al., 2002). Below-ground diversity is difficult to 467
quantify but it is assumed to surpass above-ground plant and animal diversity (Wall et 468
al., 2010). Climate change is expected to affect individual organisms, populations, 469
species distributions and ecosystem composition and function through increases in 470
temperature and changes in precipitation. The data and models needed to project the 471
extent and nature of future ecosystem changes and changes in the geographical 472
distribution of species are incomplete, meaning that these effects can only be partially 473
quantified (Gitay et al., 2002). 474
Precipitation and temperature influence vegetation and consequently soil properties by 475
affecting type and rates of chemical, mineralogical, biological, and physical processes. 476
Field experiments about soil warming (e.g. Rustad et al., 2001; Melillo et al., 2002; 477
Eliasson et al., 2005; Allison et al., 2010; Ågren, 2010; Budge et al., 2011) have 478
provided evidences about the temperature sensitivity of decomposition. Deadwood is an 479
important component in forest ecosystems, and despite its ecological role has been 480
recognized widely for a long time (Haapannen 1965; Elton, 1966), only recently, 481
research has focused on its role in ecosystems. Deadwood has become a structural key 482
factor (Larsson 2001) and an indicator in the assessment of biodiversity and naturalness 483
of forest systems (McComb and Lindenmayer, 1999; Skogsstyrelsen, 2001). 484
Wood decomposition rate and dynamics, like for other types of litter, are virtually 485
entirely determined by the interactions between (1) wood quality and (2) the 486
composition, abundance and activity of decomposer communities (Cadisch and Giller 487
1997). However, these interactions are strongly controlled by abiotic drivers, which 488
determine the growth performance of the trees and thereby the properties of their woody 489
24 debris (Cornelissen et al., 2012). Moreover, these abiotic drivers also control the 490
moisture and temperature regime of the deadwood as well as the decomposer activity 491
and community. Micro-organisms, particularly fungi and invertebrates, are the main 492
agents of wood decay (Kaarik 1974). The structural and chemical traits of deadwood, 493
inherited from the traits of living trees, are also major drivers of wood decomposition 494
and these traits vary greatly among tree species (Chave et al. 2009; Cornwell et al. 495
2009; Weedon et al. 2009; Zanne and Falster 2010). 496
Deadwood and litter act as important linkages between recent productivity and current 497
community, and ecosystem processes (Anderson et al., 2009). The increasing interest in 498
the quantity and properties of coarse woody debris and litter is relevant both to 499
maintaining biodiversity and to global C dynamics (Kueppers et al., 2004). Dying and 500
dead trees are valuable habitats (providing food, shelter and breeding conditions, etc.) 501
for a large number of rare and threatened species: saproxylic insects, invertebrates, 502
fungi, lichens, bryophytes, birds and mammals (Harmon et al., 1986; Ódor and 503
Standovár, 2001; Humphrey et al., 2002; Ódor et al., 2006). 504
Although wood degrading organisms largely differ in preference of substrate and/or 505
abiotic conditions, most of them share the need for oxygen and water. This makes wood 506
moisture content an important driver of wood decomposition (Cornelissen et al., 2012). 507
Below a wood moisture content of 20%, most fungi are inactive while wood moisture 508
content of 80–100% restricts enzymatic activity of fungi due to lack of oxygen 509
(Tsoumis, 1991; Zabel and Morrell, 1992; Schmidt, 2006). 510
It has been demonstrated that advanced decay stages of CWD can leach significant 511
quantities of organic matter and dissolved organic carbon into the soil (Zalamea et al., 512
2007), that soil chemical characteristics can be altered under its influence, increasing 513
calcium, magnesium, and total N concentrations (Kappes et al., 2007), as well as 514
decreasing soil pH (Spears and Lajtha, 2004). 515
In spite of its demonstrated importance in forest ecosystems, it is not well understood 516
how CWD could affect abiotic and biotic characteristics in its sphere of influence 517
(Gonzalez et al., 2013). Some authors have suggested that soil contact accelerates CWD 518
decomposition (Naesset, 1999; Garrett et al., 2010), but the feedback on soil biotic 519
activity from CWD presence is not clear. 520
25 One of the principal legacies of CWD in forest ecosystems is its persistence in time and 521
its slow decomposition (Harmon et al., 1986), which allows for the development of 522
long-term interactions between CWD and soil (Gonzalez et al., 2013). 523
To a greater or lesser degree, depending on the moisture and temperature regimes of an 524
ecosystem, deadwood may add a significant amount of organic matter to the soil, 525
provide habitat for decomposer organisms, retain moisture through dry periods, 526
providing a refuge for ectomycorrhizal roots and their associated soil organisms, 527
provide a site for asymbiotic or associative nitrogen-fixing bacteria, represent a capital 528
pool of nutrients for the ecosystem, provide a site for the regeneration of conifers and 529
contribute to soil acidification and podsolization (Stevens 1997). 530
All size classes of decaying pieces of wood contribute to the long-term accumulation of 531
organic matter because the lignin and humus of well-decayed wood are high in carbon 532
constituents (Maser et al. 1988). It improves the moisture-carrying capacity and 533
structure of the soil. To protect the productive potential of a forest soil, a continuous 534
supply of organic materials must be maintained (FAO 2005). Also ectomycorrhizal 535
activity has been found to be essential to the healthy growth of conifers. 536
This activity is a moisture-dependent phenomenon (Harvey et al. 1983). Both diameter 537
and state of decay affect the ability of down wood to hold moisture. All size classes of 538
decaying wood act as a moisture store and provide refugia for tree roots and 539
ectomycorrhizal fungi during dry periods; however, the larger pieces can hold more 540
water and are therefore more effective at holding moisture and acting as refugia through 541
long, dry spells (Stevens 1997). When moisture returns to the site, it is a much faster 542
process to reinvade the organic layer of soil with ectomycorrhizal root tips when refugia 543
are scattered throughout the forest floor. Wood is only a moderate source of nutrients, 544
but usually occurs in sufficient volumes to be a significant source of moisture (Harvey 545
et al. 1986). Deadwood can also contribute to nutrient storage. This includes the 546
nutrients accumulated in the woody bole, large branches, roots and stumps during tree 547
growth and the nutrients added from litterfall and throughfall (rain falling through the 548
forest canopy) being intercepted by a down log rather than falling on the forest floor 549
(Stevens 1997). If the nutrients are added faster than they are leached out by rain, the 550
result is positive nutrient storage. As the wood decays, the nutrients are added to the 551
available pool. Mechanisms for removing the nutrients from deadwood and adding them 552
to the available pool vary. Harmon et al. (1994) found that during early stages of 553
26 decomposition, fungal sporocarps (mushrooms) growing on decaying logs increased the 554
concentrations of nitrogen, potassium and phosphorous 38, 115 and 136 times, 555
respectively, over the concentrations found in the logs (Lombardi, 2013). When these 556
mushrooms fall off the logs and decay, they are returning nutrients from the downed 557
wood into the available nutrient pool. Arthropods and earthworms digest the complex, 558
organic molecules in down deadwood with the help of micro-organisms in their 559
digestive systems, and return the nutrients to the forest in their frass (Stevens 1997). 560
Thus, deadwood can be a reliable and steady source of nutrients over more than 100 561
years. When coarse woody debris is added to the ecosystem at regular intervals and is 562
well distributed, it represents a long-term source of nutrients (Lombardi et al., 2013). 563
Moreover, deadwood is also useful for the health of the soil. Soil health is a result of the 564
myriad of biological organisms and interactions that are a part of the forest ecosystem 565
we call soil. This involves soil arthropods, fungi, bacteria, animal waste and among 566
other things, decaying wood. There are many more species and interactions than we 567
currently know, but the strategy for assembling available nutrients into parts of a forest 568
ecosystem is present in all natural forests. These pieces and processes may differ 569
between ecosystems, depending on both biotic and abiotic components available. 570
Deadwood provides also a structural link with the previous stand in some natural 571
disturbance types, and as such provides continuity of habitat for some species (Hansen 572
et al. 1991). Carey and Johnson (1995) reported that along with understorey vegetation, 573
CWD is the most important habitat factor for small mammals. Healthy small mammal 574
populations help to sustain the ecological processes in which they are an integral part 575
(e.g., the dispersal of seeds and mycorrhizal fungi spores, the maintenance of healthy 576
predator populations, and the control of potentially harmful invertebrate populations). 577
Arthropods are one of the most diverse groups of animals and one of the least 578
understood. Soil microarthropods, although largely unidentified, are the most important 579
arthropods in terms of their impact on nutrient cycling. Groups of them associated with 580
deadwood have been shown to increase the availability and suitability of organic 581
particles for decomposer communities (Norton 1990), and contribute to nutrient cycling 582
and soil formation (Behan-Pelletier 1993; Setälä and Marshall 1994). 583
Moreover, many species of nonvascular plants and fungi are associated with deadwood. 584
The diversity of these species is related to the diversity of substrates, including a variety 585
of decay stages, and has been linked to forest health (Amaranthus et al. 1994; Crites and 586
27 Dale 1995). Variability in piece size contributes to this diversity. Some bryophytes and 587
fungi are restricted to very large pieces (Soderstrom 1988). Deadwood is also important 588
in the geomorphology of terrestrial ecosystems, due to the physical properties of large 589
pieces of wood. Upland sources of deadwood contribute to slope stability, soil surface 590
stability, prevention of erosion and control of storm surface runoff. Particularly, where 591
there is a significant slope, deadwood may play a role in soil stabilization, controlling 592
the flow of water, soil and litter across the forest floor. Material in any decay class, 593
lying across the slope, will reduce soil movement down-slope. Larger pieces collect 594
more material on their upslope side, creating a substrate for invertebrate and small 595
mammal burrowing (Maser et al. 1988) and higher decomposition rates for the debris. 596
Finally, deadwood plays also a wider role by storing carbon to mitigate global warming 597
as efficiently as many young timber plantations (WWF 2004). As the reality of climate 598
change is widely recognised, carbon sequestration (the storing of carbon in ecosystems) 599
is gaining attention as one way of reducing greenhouses gases. Major forest carbon 600
pools include trees, under-storey vegetation, deadwood, litter, and soil. Deadwood is 601
important as it is both a store and source of carbon but is generally the least studied of 602
the carbon pools (WWF 2004). This will now change because national carbon 603
inventories are required under the Kyoto Protocol of the 1992 United Nations 604
Framework Convention on Climate Change (Woldendorp et al. 2002). Initial discussion 605
on carbon storage focused on fast-growing rotations of exotic plantations. Deadwood 606
itself releases carbon to the atmosphere – becoming a carbon source – during microbial 607
respiration from decomposer organisms (WWF 2004). But in ecosystems in cool 608
climates, microbial activity is restricted and decomposition very slow, so that deadwood 609
tends to act as a long-term storage site. Much of the carbon in long-lived and slow 610
decaying trees, such as Scots pine, can remain sequestered for over a thousand years. 611
Dead trees and old-growth forests are therefore usually better carbon stores than the 612
new forests, which replace them (WWF 2004). 613
Deadwood is an important and often neglected component of many terrestrial 614
ecosystems (Harmon et al., 1986; Sturtevant et al., 1997; Chen et al., 2001; Rock and 615
Badeck, 2004). Changes in the wood have been decisive influence on plant 616
communities that colonize this substrate. The quantity and wood decay rate in a forest 617
depends on many factors such as temperature, humidity, solar radiation, the specific 618
composition of tree species, structure, age of the population, the spatial structure, the 619
28 type and frequency of natural and anthropogenic disturbances. Wood is therefore an 620
important and irreplaceable driving force of biodiversity, which helps to increase the 621
complexity, and with it the stability of forest ecosystems (Dudley and Vallauri 2004). 622
623
Deadwood decay processes 624
The causal factors governing wood decomposition are still poorly understood 625
(Cornwell et al. 2009). The decomposer community, climate, position of the tree 626
(standing or down), and chemical and physical properties of the wood are known to 627
influence the decay rates (Mackensen et al. 2003). Climatic factors determine the 628
temperature and moisture regimes in the woody material. These affect the biological 629
activity of the decomposing organisms. 630
This effect is apparent in the generally positive relationship between mean annual 631
temperatures and decay rates, when the differences in tree species-specific decay 632
resistance are taken into account (Alban and Pastor 1993, Chambers et al. 2000, 633
Yatskov et al. 2003, Laiho and Prescott 2004). On a stand scale, the dynamics of 634
deadwood, i.e. fluctuations in its volume and quality, are determined by tree mortality 635
and decomposition over time (Grove 2002, Jonsson et al. 2005). When the weakening 636
stress factors are taken into account, tree death can be a lengthy process. 637
Deadwood is an important component in the functioning of forest ecosystems, as it 638
plays an important role in biodiversity, trophic chains, forest natural regeneration, 639
nutrient cycles and overall carbon storage (Harmon et al., 1986; Franklin et al., 1987; 640
Jonsson and Kruys, 2001; Laiho and Prescott, 2004; Luyssaert et al., 2008). The role of 641
deadwood on biodiversity conservation of forest ecosystems is widely recognised. 642
Interest on deadwood has increased in the last years, and forest management policy 643
regards deadwood as indicator of sustainable forest management (Castagneri et al., 644
2010). Coarse woody debris (CWD) is the residue of living trees in forest ecosystems 645
including whole fallen trees, fallen branches, and pieces of fragmented wood, stumps 646
and standing dead trees (snags) (Li et al., 2007). It comes from natural tree mortality, 647
disease and insects, as well as catastrophic events such as fires, storms and floods. Also 648
fire creates deadwood directly or by making trees more susceptible to wind, disease, or 649
insect damage. Insects and disease can cause tree death directly or weaken a tree, 650
29 thereby contributing to its death and eventual fall to the forest floor (Lombardi et al. 651
2008). 652
CWD serves a variety of essential functions in forest ecosystems. It provides sites for 653
seed germination (Harmon et al. 1986 & 1989; Graham and Cromack 1982; Gray and 654
Spies 1997; Xu 1998), serves as reservoirs during droughts (Deng et al. 2002; Harmon 655
and Sexton 1995; Zhao et al. 2002), and provides habitats for many forest animals 656
(Rabe et al. 1998; Timothy and Mark 2004; Torgersen and Bull 1995) and microbes 657
(Amaranthus et al. 1994). 658
Decomposition of the organic matter is largely a biological process that occurs 659
naturally; it is the process whereby the complex organic structure of biological material 660
such as wood is reduced to its mineral form (Li et al., 2007). Its speed is determined by 661
three major factors: soil organisms, the physical environment and the quality of the 662
organic matter (Brussaard, 1994). In the decomposition process, different products are 663
released: carbon dioxide (CO2), energy, water, plant nutrients and resynthesized organic
664
carbon compounds. Successive decomposition of dead material and modified organic 665
matter results in the formation of a more complex organic matter called humus (Juma, 666
1998). Humus affects soil properties. As it slowly decomposes, it colours the soil 667
darker; increases soil aggregation and aggregate stability; increases the CEC (the ability 668
to attract and retain nutrients); and contributes N, P and other nutrients. 669
Soil organisms, including micro-organisms, use soil organic matter as food and, as they 670
break down the organic matter, any excess nutrients (N, P and S) are released into the 671
soil in forms that plants can use (mineralization). The waste products produced by 672
micro-organisms are also soil organic matter. This waste material is less decomposable 673
than the original plant and animal material, but it can be used by a large number of 674
organisms (FAO 2005). By breaking down carbon structures and rebuilding new ones or 675
storing the C into their own biomass, soil biota plays the most important role in nutrient 676
cycling processes and, thus, in the ability of a soil to provide the crop with sufficient 677
nutrients to harvest a healthy product. The organic matter content, especially the more 678
stable humus, increases the capacity to store water and store (sequester) C from the 679
atmosphere (FAO 2005). 680
The decomposition or depletion of CWD involves many different biological and 681
physical processes (Harmon et al. 1986; Golladay and Webster 1988). Generally, fine 682
30 deadwood material forms a richer habitat for fungi like morels, and cup fungi (Nordén 683
et al. 2004). Due to its high amount of lignin, deadwood is difficult to decay (Floudas et 684
al 2012). Under natural conditions, only fungi substantially decompose deadwood. With 685
their ability to use a battery of secreted oxidoreductases and hydrolases (wood 686
decomposition enzymes), they are considered as the primary wood decomposers and 687
among them are the only organisms, which are able to decompose lignin (Cornelissen et 688
al. 2012, Stokland et al. 2012, Purahong et al. 2014, Kubartva et al. 2015, Persoh et al. 689
2015). Diverse bacteria also colonize deadwood and form at least commensal 690
interactions with wood-inhabiting fungi, for example, by providing additional nitrogen 691
(de Boer et al. 2005, Hoppe et al. 2005, Hoppe et al. 2015). However, due to their 692
limited ability to decompose polymeric lignocelluloses, bacteria are thought to play only 693
a minor role in wood decomposition (Cornelissen et al. 2012). Elsewhere, research 694
shows that small logs and branches do not decay in the same way as large trunks, so that 695
necessary habitat types will not occur (Yee et al. 2001). The process of deadwood 696
recycling can sometimes take hundreds of years to complete and includes three main 697
phases (Speight 1989). 698
The dynamics of the mass of deadwood on a site are affected by decay processes and 699
material transfer processes. The first stage of decay processes is the fragmentation. It is 700
the breaking up of deadwood into smaller particles. This occurs as insects chew the 701
wood, as vertebrates forage for insects in decaying wood, when partially or fully 702
decayed snags fall, and when decayed wood is disturbed by falling trees, wind, rain or 703
other physical disturbances. Leaching, collapse and settling, and seasoning are all 704
aspects of fragmentation (Lombardi, 2007). Leaching (water percolating through the 705
log) dissolves soluble materials. It is less important in early decay classes as most of the 706
material in these classes is not soluble. As the decay process proceeds, decomposers 707
change the polymers into soluble material and leaching becomes more important 708
(Stevens 1997). In addition, in later decay classes, as fragmentation begins, the 709
importance of leaching increases as the surface-to-volume ratio increases. As the tree 710
decays, the internal structure becomes weak and settling occurs. This usually increases 711
the contact of the log with the ground, which can increase the activity of microbes, 712
invertebrates and vertebrates at the soil-log interface where there is likely to be 713
increased moisture retention and access for the above organisms (Stevens 1997). During 714
the decay processes, seasoning characterize deadwood. It refers to a series of changes, 715
including a decrease in moisture, shrinkage and the formation of cracks that increase 716