O R I G I N A L R E S E A R C H
Mechanisms of resistance to a PI3K inhibitor in
gastrointestinal stromal tumors: an omic approach
to identify novel druggable targets
This article was published in the following Dove Press journal: Cancer Management and Research
Gloria Ravegnini1,* Giulia Sammarini1,* Sebastian Moran2 Giovanni Calice3 Valentina Indio4 Milena Urbini4 Annalisa Astolfi4 Federica Zanotti1 Maria A Pantaleo4,5 Patrizia Hrelia1 Sabrina Angelini1
1Department of Pharmacy and
Biotechnology, University of Bologna, Bologna, Italy;2Cancer Epigenetics and
Biology Program (PEBC), Bellvitge Biomedical Research Institue (Idibell), l’Hospitalet de Llobregat, Barcelona, Spain;3Laboratory of Preclinical and
Translational Research, IRCCS-CROB, Referral Cancer Center of Basilicata, Rionero in Vulture, Italy;4Giorgio Prodi
Cancer Research Center, University of Bologna, Bologna, Italy;5Department of
Specialized, Experimental, and Diagnostic Medicine, Sant’Orsola-Malpighi Hospital, University of Bologna, Bologna, Italy *These authors contributed equally to this work
Background: Gastrointestinal stromal tumors (GISTs) represent a worldwide paradigm of target therapy. The introduction of tyrosine kinase inhibitors has deeply changed the prognosis of GIST patients, however, the majority of them acquire secondary mutations and progress. Unfortunately, besides tyrosine-kinase inhibitors, no other therapeutic options are available. Therefore, it is mandatory to identify novel molecules and/or strategies to overcome the inevitable resistance. In this context, after promising preclinical data on the novel PI3K inhibitor BYL719, the NCT01735968 trial in GIST patients who had previously failed treat-ment with imatinib and sunitinib started. BYL719 has attracted our attention, and we compre-hensively characterized genomic and transcriptomic changes taking place during resistance. Methods: For this purpose, we generated two in vitro GIST models of acquired resistance to BYL719 and performed an omic-based analysis by integrating RNA-sequencing, miRNA,
and methylation profiles in sensitive and resistant cells.
Results: We identified novel epigenomic mechanisms of pharmacological resistance in
GISTs suggesting the existence of pathways involved in drug resistance and alternatively acquired mutations. Therefore, epigenomics should be taken into account as an alternative adaptive mechanism.
Conclusion: Despite the fact that currently we do not have patients in treatment with BYL719 to verify this hypothesis, the most intriguing result is the involvement of H19 and PSTA1 in GIST resistance, which might represent druggable targets.
Keywords: gastrointestinal stromal tumors, GIST, BYL719, PI3K inhibitor, tyrosine-kinase inhibitors
Introduction
Gastrointestinal stromal tumors (GISTs) are rare mesenchymal tumors harboring KIT/PDGFRA-driver mutations in 85%–90% of cases.1GISTs are the example par excellence of targeted therapy in solid tumors. Indeed, with the introduction of the tyrosine-kinase inhibitor (TKI) imatinib, patients’ prognosis have dramatically improved.2Despite imatinib effectiveness, the majority of patients with advanced GISTs have persistent measurable disease and eventually develop progressive disease within 24–36 months.3About 20 years after its approval, imatinib is still the gold standard in GIST treatment. However, to cope with the emergence of pharmacological resistance, the multi-TKIs sunitinib and regorafenib have been introduced, as second- and third-line treatment, respectively, in GIST management. Sunitinib and regorafenib share a mechanism of action with imatinib, adding
Correspondence: Sabrina Angelini Department of Pharmacy and Biotechnology, University of Bologna, 48 Via Irnerio, Bologna 40126, Italy Tel +39 051 209 1787
Fax +39 051 209 1780 Email [email protected]
Cancer Management and Research
Dove
press
open access to scientific and medical research
Open Access Full Text Article
Cancer Management and Research downloaded from https://www.dovepress.com/ by 137.204.234.57 on 19-Jul-2019
clinical benefit to GIST patients after imatinib failure. Even with clinical aids, the majority of patients experience tumor progression, due to the emergence of multiple drug– resistant KIT/PDGFRA mutations.4–9Unfortunately, all the approved treatments for GIST management are TKIs, and to date there are no additional therapeutic options. Therefore, the identification of novel druggable targets, favored by better characterization of the resistance pro-cess, may represent a key starting point to achieve a different clinical approach. In this regard, a novel PI3K inhibitor — BYL719 (Novartis) — is currently being tested in a phase IB trial in GIST patients who have previously failed imatinib and sunitinib (NCT01735968).10 Specifically, BYL719 is a selective inhibitor of the PI3K catalytic p110a subunit.11 Indeed, the PI3K pathway, which is downstream of KIT/ PDGFRA receptors, is frequently activated in GIST and thought to be related to imatinib resistance.12–16Therefore, PI3K-pathway inhibition represents an attractive target and a promising strategy to counteract imatinib resistance in GIST. In this study, we comprehensively characterized genomic and transcriptomic changes taking place during resistance and how GIST cells evolve from being drug-sensitive to drug-resistant, from an“omic” point of view. For this purpose, we generated two in vitro GIST models of acquired resistance to BYL719 and performed an omic-based analysis by integrating RNA sequencing, miRNA profiling, and methylation profiling in sensitive and resis-tant cells.
Methods
Cell culture and treatment
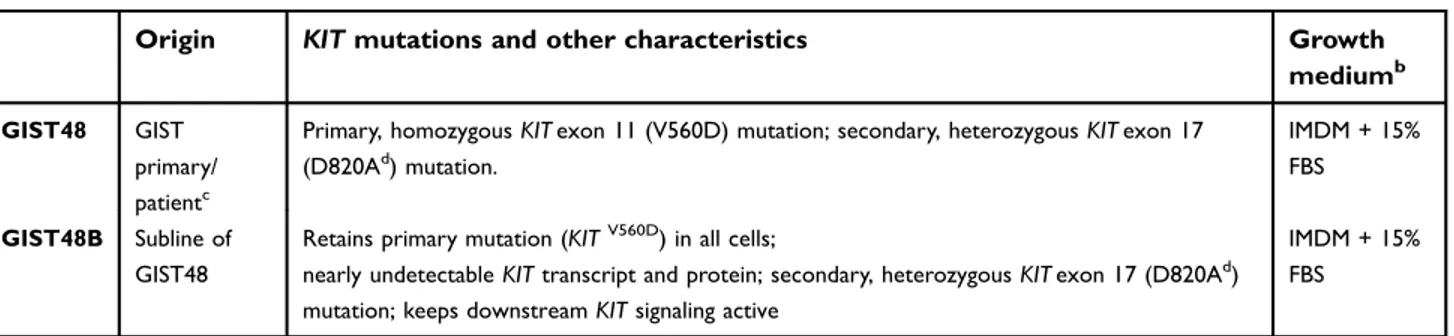
Two established human imatinib-resistant GIST cell lines, GIST48 and GIST48B, were used (Table 1). These were authenticated by KIT-sequencing and TKI-sensitivity
experiments, routinely grown in adhesion, and cultured at 37°C in a 5% CO2 humidified atmosphere. To generate
BYL719-resistant sublines, GIST48 and GIST48B were exposed to increasing concentrations of BYL719 (Selleck Chemicals, Houston, TX, USA), starting with a concentration of 0.05 µM and increasing gradually to 5 µM. Fresh drug was provided every 3–4 days, when the medium was replaced. After the cells had acquired the ability to grow in the presence of a specific concentration of BYL719, a proportion of them was frozen and the remaining grown at the next-highest drug level. After approximately 50 weeks, sublines of cells growing in 5 µM BYL719 were maintained continuously in culture at this dose. Upon receipt and before each change of BYL719 concentration, GIST lines were tested for myco-plasma contamination and were found to be negative.
IC
50: MTT-assay method
IC50 was evaluated by MTT assays using a standard
protocol.17Briefly, 104cells/well were seeded in triplicate in a 96-well plate and incubated for 24 hours. After incu-bation, the medium was removed and replaced with a fresh one containing BYL719 in serial dilution and incubated for 48 hours. Subsequently, cells were washed with PBS and incubated with MTT (5 mg/mL) in PBS for 2 hours. Following MTT removal, the formazan crystals were dis-solved in isopropanol and absorbance measured at 570 nm with a Tecan spectrophotometer (Spectra Model Classic, Salzburg, Austria).
DNA and RNA isolation
Genomic DNA and total RNA were extracted from par-ental (GIST48 and GIST48B) and BYL719-resistant (GIST48-R and GIST48B-R) cultured cells using the QIAamp DNA minikit and RNeasy minikit, respectively,
Table 1 GIST cell-linesacharacteristics
Origin KIT mutations and other characteristics Growth
mediumb
GIST48 GIST primary/ patientc
Primary, homozygous KIT exon 11 (V560D) mutation; secondary, heterozygous KIT exon 17 (D820Ad) mutation.
IMDM + 15% FBS GIST48B Subline of
GIST48
Retains primary mutation (KITV560D) in all cells;
nearly undetectable KIT transcript and protein; secondary, heterozygous KIT exon 17 (D820Ad) mutation; keeps downstream KIT signaling active
IMDM + 15% FBS
Notes:aKindly provided by Dr Fletcher (Department of Pathology, Brigham and Women’s Hospital, Harvard Medical School, Boston, MA);b
reagents purchased from Thermo Fisher Scientific (Waltham, MA);c
established from a GIST patient that had progressed after initial response to imatinib therapy;d
located in the kinase-activation loop, confers resistance to imatinib and sunitinib.
Abbreviations: IMDM, Iscove's Modified Dulbecco's Medium; FBS, Fetal Bovine Serum.
Cancer Management and Research downloaded from https://www.dovepress.com/ by 137.204.234.57 on 19-Jul-2019
following manufacturer’s instructions. Both kits were pur-chased from Qiagen (Hilden, Germany).
KIT and PI3KCA mutational analysis
Genomic DNA from parental and BYL719-resistant cell lines was screened for the presence of hot-spot mutations in KIT (exons 9, 11 13, 14, 17, and 18) and PI3KCA (exons 9 and 20). Selected exons were amplified by PCR using specific primers. Amplified PCR products were pur-ified and sequenced on both strands using a Big Dye Terminator version 1.1 cycle-sequencing kit (Thermo Fisher Scientific). Sanger sequencing was performed on an ABI 310 genetic analyzer (Applied Biosystems) and analyzed using Chromas (Technelysium). Sequencing data were analyzed using BLAST (https://blast.ncbi.nlm.nih. gov/Blast.cgi) to match sequences with reference sequences of KIT (NM_000222) and PI3KCA (NM_006218) genes obtained from Ensembl genome browser 94 (https://www.ensembl.org/index.html).
Western blot analysis
Whole-cell protein lysates were prepared from parental and BYL719-resistant cell-monolayers using NP40 buffer containing protease inhibitors (Halt protease- and phos-phatase-inhibitor cocktail; Thermo Fisher Scientific) and 1 mM phenylmethylsulfonyl fluoride (Sigma-Aldrich). Proteins were separated on SDS-PAGE and transferred onto nitrocellulose membranes. Transfer efficiency was demonstrated by Ponceau S staining (Sigma-Aldrich). Membranes were blocked by 5% skimmed milk, followed by incubation at 4°C overnight with the presence of a primary antibody against KIT (A4502; Dako, Ely, UK), phospo-KIT (3391; Cell Signaling Technology, Leiden, Netherlands), AKT (9272; Cell Signaling Technology), phospo-AKT (9271; Cell Signaling Technology), MAPK (9102; Cell Signaling Technology), phospo-MAPK (9101; Cell Signaling Technology), mTOR (2972; Cell Signaling Technology), phospo-mTOR (2448; Cell Signaling Technology), PTEN (138G6; Cell Signaling Technology), and actin (A1978; Sigma-Aldrich). After rinsing, mem-branes were incubated with horseradish peroxidase –con-jugated secondary antibody (Thermo Fisher Scientific) at room temperature for 2 hours. After further rinsing, immu-noreactive bands were visualized by enhanced chemilumi-nescence (BioRad, Hercules, CA, USA) and signals captured and quantified using ChemiDoc (BioRad).
ABC transporter gene
–expression
analysis
Total RNA was reverse-transcribed to cDNA using a high capacity RNA-to-cDNA kit (Applied Biosystems) accord-ing to the manufacturer’s instructions. cDNA was loaded into a TaqMan human ABC-transporter array, which allows quantitative gene-expression analysis of human ABC-transporter genes important in drug discovery and resistance. In particular, it contains assays in triplicate for 50 human genes and 14 endogenous controls in a 348-well array. mRNA-expression levels were normalized using GAPDH and 18S as endogenous controls, and data were analyzed using the 2−ΔΔCt method. mRNAs with Ct>35 were considered unexpressed and excluded from further analysis.
RNA sequencing (RNA-seq)
Whole-transcriptome RNA libraries were prepared in accordance with the TruSeq RNA Sample Prep version 2 protocol (Illumina, San Diego, CA, USA). Poly(A)-RNA molecules from 500 ng total Poly(A)-RNA were purified using oligo-dT magnetic beads. Subsequently, mRNA was fragmented and randomly primed for reverse tran-scription followed by second-strand synthesis to generate double-stranded cDNA fragments. The cDNA fragments generated went through a terminal end–repair process and ligation using paired-end sequencing adapters. The obtained products were amplified to enrich for fragments carrying adapters ligated on both ends, and to add addi-tional sequences complementary to the oligonucleotides on the flow cell, thus creating the final cDNA library. 12pM paired-end libraries were amplified and ligated to theflow cell by bridge PC and sequenced at 2×75bp read length for RNA using Illumina sequencing-by-synthesis technology.
RNA-seq : bioinformatic analysis
After demultiplexing and FASTQ generation, through the bcltofastq function developed by Illumina, paired-end reads were trimmed using AdapterRemoval (https:// github.com/MikkelSchubert/adapterremoval) with the aim of removing stretches of low-quality bases (<Q10) and Truseq/Nextera rapid-capture adapters present in the sequences. Sequences coming from RNA-seqwere mapped with TopHat/BowTie pipeline and PCR or optical dupli-cates were removed with the function rmdup of SAMtools.
Cancer Management and Research downloaded from https://www.dovepress.com/ by 137.204.234.57 on 19-Jul-2019
RNA-seq: SNV calling
Single nucleotide variant (SNV) calling was performed with SAMtools and SNVMix2, which allows the identi fi-cation of all point mutations and insertion/deletion var-iants. Variants in the dbSNP, 1000 Genomes, ExAc, and EVS databases with frequency >1% were excluded. The possible functional effects of identified variants were ana-lyzed with three in silico tools: SIFT, PolyPhen2, and MutationTaster2.18–20
Gene-expression analysis
In order to compare gene-expression profile (GEP) between BYL719-sensitive and -resistant GIST cell lines, RNA-seq data were analyzed. After the alignment proce-dure, the BAM file obtained was manipulated with SAMtools to remove the optical/PCR duplicate and to sort and index it. The HTSeq count (Python HTSeq pack-age) was adopted to count the number of reads mapped on known genes included in Ensembl 72 annotation features.
Functional annotation, GO, and pathway
analysis
NetworkAnalyst (https://www.networkanalyst.ca/faces/ home.xhtml) was used to identify molecular pathways and functional groupings. Gene-interaction networks, bio-function, and pathway analysis were generated using dif-ferentially expressed genes (DEGs) into known functions, pathways, and networks, primarily based on human stu-dies. The DEGs were organized in Gene Ontology (GO) biofunction and regulatory effect networks. Significance was set at P<0.05. NetworkAnalyst uses a comprehensive high-quality protein–protein interaction database based on InnateDB. This database contains manually curated pro-tein-interaction data from published literature, as well as experimental data from several protein–protein interaction databases, including IntAct, MINT, DIP, BIND, and BioGRID. The database currently contains 14,755 proteins and 145,955 interactions for humans.
qRT-PCR
Gene-expression levels of H19 and PSAT1 were evalu-ated through quantitative reverse-transcription (qRT) PCR. Briefly, RNA from both parental and BYL719-resistant cell lines was reverse-transcribed to cDNA using a high-capacity RNA-to-cDNA kit (Applied Biosystems) according to the manufacturer's instructions. qRT-PCR was performed with a Fast SYBR Green
Master Mix (Applied Biosystems) using the 7900HT real-time PCR system. qRT-PCR assays for H19 and PSAT1 were performed using the primers H19-Fwd 5 ʹ-ATCGGTGCCTCAGCGTTCGG-3ʹ, H19-Rev 5ʹ-CTGTC CTCGCCGTCACACCG-3ʹ, PSAT1-Fw 5ʹ-ATACAGA GAATCTTGTGCGGG-3ʹ, PSAT1-Rev 5ʹ-CATAGTCAG CACACCTTCCTG-3ʹ, GAPDH-Fwd 5ʹCGGGAAGCTT GTCATCAAT-3ʹ, and GAPDH-Rev 5ʹ-GACTCCACGAC GTACTCAGC-3ʹ. All primers were obtained from Integrated DNA Technologies. Relative expression levels were evaluated by the 2–ΔΔCt method using GAPDH as a housekeeping gene.
miRNA-expression evaluation
Total RNA (300 ng) was reverse-transcribed using a TaqMan miRNA reverse-transcription kit (Thermo Fisher Scientific) using Megaplex RT primers Human Pool A and Pool B. cDNAs were load on the TaqMan arrays Human MicroRNA A and B Cards and run on a 7900HT real-time PCR system in accordance with the manufacturer's procedure. miRNA data were analyzed with SDS relative quantification software version 2.4 (Applied Biosystems) and miRNAs with Ct>35 were con-sidered unexpressed and excluded from further analysis. miRNA-expression levels were normalized using U6 and RNU48 as endogenous controls. Normalization was car-ried out by subtracting the mean Ct from individual Ct values. R-Bioconductor (package Limma) was adopted to evaluate differential expression profiles between the par-ental and BYL719-resistant GIST cell lines.
Global methylation pro
file
Genomic DNA (600 ng/sample) were bisulfite-converted using EZ DNA methylation kits (Zymo Research), and DNA methylation was measured using the Illumina Infinium HD-methylation assay with Infinium Methylation Epic BeadChips according to Illumina's protocol. Raw data (Idatfiles) were processed in R Bioconductor (minfi27). The quality of each sample was analyzed and probe signals removed when: i) P>0.05; ii) >1% of the data set contained no data; or iii) probes contained single-nucleotide poly-morphisms. None of the samples included in the study was flagged as an outlier.21
Statistical analyses were carried out using GenomeStudio, normalizing Idat values with controls provided by Illumina. The methylation score of each CpG is represented as aβ-value, and differences between β-values of treated and untreated cells represent alterations in methyla-tion level. The CpGs selected were those with absolute
Cancer Management and Research downloaded from https://www.dovepress.com/ by 137.204.234.57 on 19-Jul-2019
methylation differential value of >0.2 or <–0.2.21,22To iden-tify CpGs on promoter regions, we considered only UCSC reference-gene groups TSS200 or TSS1500.
Identi
fication of validated miRNA targets
Targets of significant miRNAs were identified through specific in silico tools that allowed prediction of the most probable targets. Specifically, to limit false-positive results, we used the miRTarBase tool, which encloses more than 400,000 miRNA-target experimentally verified interactions, collected by manually surveying pertinent literature after systematic data mining of the text.
miRNA-pro
file and gene-expression
correlation
miRNA and mRNA arrays were analyzed to highlight pairs of mRNAs and miRNAs that were discordant (up- versus downregulated and vice versa). Potential miRNA–mRNA interactions and miRNA/mRNA-expression profiles were used to construct functional interaction networks.
Methylation-pro
file and gene-expression
correlation
To integrate methylation profiles and GEP, we considered only CpGs on promoter regions that shown absolute methylation differentials of >0.2 or <–0.2 in parental lines versus BYL719-resistant ones. Promoter regions were defined as upstream 1,500 bp and downstream 200 bp from the transcription-start site (TSS) of each gene. For each differentially methylated gene, we checked the expression level derived from RNA sequencing.
Results
MTT assay
GIST48 and GIST48B cell lines were exposed to BYL719 using doses that were increased in a stepwise manner. We thus established two BYL719-resistant GIST cell lines (48-R and 48B-R), which exhibited BYL719 IC50values that were
about 15-fold higher than the parental cell lines (Figure S1).
KIT and PI3KCA mutational analysis
The involvement of KIT and PI3KCA mutations as mechan-isms driving BYL719 resistance in GIST cells in vitro was investigated. Mutational analysis did not reveal additional KIT mutations in BYL719-resistant cell lines by Sanger sequencing or SNV calling. With regard to PI3KCA, we Sanger sequenced exons 9 and 20, both codifying for thecatalytic p110a subunit and associated with drug resistance.23–26All samples were wild type. PI3KCA wild-type status was also confirmed by SNV calling.
Western blot analysis
To better characterize the BYL719-resistant GIST48-R and GIST48B-R lines, we performed Western blot analy-sis, evaluating in particular the signaling pathway down-stream of KIT (Figure 1A). In the imatinib-resistant GIST48 line (as expected, considering that the targeted PI3K is downstream of KIT), we observed comparable KIT phosphorylation between GIST48 and GIST48B-R (Figure 1B). Absence of KIT phosphorylation was observed, as expected, in both GIST48B and GIST48B-R. Indeed this GIST model had entirely lost KIT expres-sion (ie, KIT-negative, despite activation of downstream signaling [Figure 1C]). No differences were observed in PTEN status between parental and BYL719-resistant cell lines. On the contrary, in both GIST models, we detected activated AKT in BYL719-sensitive cell lines and inacti-vation in the resistant ones. We also observed actiinacti-vation of mTOR in both parental and BYL719-resistant cell lines. Finally, we observed MAPK activation in both BYL-sensitive and -resistant GIST models. All immunoblots are shown inFigure 1, BandC.
RNA-seq: SNV calling
We identified ten novel mutations in BYL719-resistant cells compared to parental cell lines. In particular, four mutations were identified in GIST48-R cells and six in GIST48B-R (Table 2). None of the mutations was com-mon to both the two resistant GIST cell lines. With regard to GIST48-R, one mutation was identified as benign (KIFC2) and one probably damaging (RPGR) by the three tools. One mutation (RIF1) was predicted as prob-ably damaging by two tools. Lastly, no agreement was reached for one mutation (DPF1). Concerning GIST48B-R, one mutation (FRY) was predicted as probably dama-ging by the three tools, two mutations (PDGFB and SYT14) were identified as benign by two tools, and no agreement was reached for two mutations (DCHS1 and EEF2KMT). Lastly, one mutation (RARS2) was a gain of stop codon. Data are reported inTable 2. However, none of them was related to the PI3KCA pathway, had been previously identified in GIST, or associated with resistance in other tumor types; therefore, we did not consider them driver mutations for BYL719 resistance.
Cancer Management and Research downloaded from https://www.dovepress.com/ by 137.204.234.57 on 19-Jul-2019
Gene expression: ABC-transporter genes
and RNA-seq analysis
Given the well-recognized role of ABC-transporter genes in mediating drug resistance, first we analyzed a custom panel of 50 genes in BYL719sensitive and -resistant GIST lines. None was significantly deregu-lated. Therefore, we performed a RNA-seq analysis, which showed 95 differentially expressed genes with P≤0.001 and a false discovery rate <0.1 in BYL719-sensitive compared to BYL719-resistant GIST lines. In particular, 48 genes were upregulated, while 47 were downregulated. The significant DEGs are reported in
Table S1. The 20 top deregulated genes — 13 up- and 7 downregulated— are shown in Figure 2A. GO func-tional enrichment analyses of deregulated genes showed cancer, chronic myeloid leukemia, and cell
cycle as the top three deregulated pathways (Kyoto Encyclopedia of Genes and Genomes pathways (KEGG),Figure 2B). In addition, we found viral repro-ductive process and viral reproduction to be the top biological processes involved. RNA binding, structural constituents of ribosome, and structural molecular activity were the top three molecular functions. Finally, cytosol, macromolecular complex, and ribonu-cleoprotein complex were the top three cellular com-ponents involved. Interestingly, among the top upregulated genes in resistant cells, there was the long non coding RNA (lncRNA) H19. RNA-seq data were confirmed by qRT-PCR, which demonstrated overexpression of H19 in GIST48-R and GIST48B-R compared with the parental BYL719-sensitive lines, with fold changes of 20.8 and 6.9, respectively.
Table 2 Acquired mutations in BYL719-resistant GIST cells
GIST 48 vs GIST48-R GIST 48B vs GIST48B-R
Gene Exon AA change Prediction* Gene Exon AA change Prediction*
DPF1 9 p.C313G Ba, PDc DCHS1 2 p.R168C Ba, PDb,c KIFC2 17 p.R732C Ba–c EEF2KMT 2 p.H52Q Ba,b, PDc
RIF1 19 p.V666A PDa,c FRY 5 p.D168Y PDa–c
RPGR 6 p.Q171R PDa–c PDGFB 3 p.R51H Ba,c
RARS2 1 p.C11X Gain of stop codonb SYT14 6 p.V359A Bb,c
Note: *Prediction of the deleterious potential througha SIFT,b
PolyPhen, andc
MutationTaster2. Abbreviations: AA, amino acid; B, benign; PD, probably damaging.
MTOR Survival Proliferation Differentiation MEK RAF RAS GIST48 S AKT KIT phospoKIT phospoKIT phosphoMTOR phospoMAPK PTEN MTOR MAPK Actin S R R GIST48B
A
B
C
MAPK AKT PTEN PI3K BYL719 P PFigure 1 Western blot analysis.
Notes: (A) Simplified KIT-signaling pathway. Immunoblot evaluation of KIT, phospho-KIT, PTEN, AKT, phospho-AKT, mTOR, phospho-mTOR, MAPK, and phospho-MAPK in GIST48 (B) and GIST48B (C). S, BYL719-sensitive; R, BYL719-resistant.
Cancer Management and Research downloaded from https://www.dovepress.com/ by 137.204.234.57 on 19-Jul-2019
miRNA-expression pro
file
The array highlighted a total of 44 deregulated miRNAs of the 754 analyzed (P<0.05); however, after adjustment, only 13 miRNAs maintained statistical significance. In particular, two miRNAs— has-miR190b and has-miR299-5p — were upre-gulated and eleven miRNAs downreupre-gulated in resistant GIST cell lines compared to parental ones. All differentially expressed miRNAs are reported inTable 3. Hierarchical clus-tering of all samples dichotomized sensitive and resistant GIST cell lines into two distinct clusters (Figure 3A). Through miRPath 3.0, we assessed miRNA regulatory roles and
identification of controlled pathways.27Interestingly, among the pathways potentially modulated by the deregulated miRNAs (summarized in Figure 3B), the most significant and those with the greatest number of target genes were PI3K/AKT, MAPK, and RAS cascades, which are involved in BYL719's mechanism of action.Figure 3Cshows the main miRNAs involved in cancer (highlighted in blue) and PI3K– AKT (in green) and JAK–STAT (in pink) pathways. In parti-cular, among the 13 deregulated miRNAs retrieved by our data, we identified a signature of five miRNAs mainly involved in the aforementioned pathways: miR22-3p, miR125b-5p, miR149-3p, miR190b, and miR520c-3p.
Global methylation pro
file
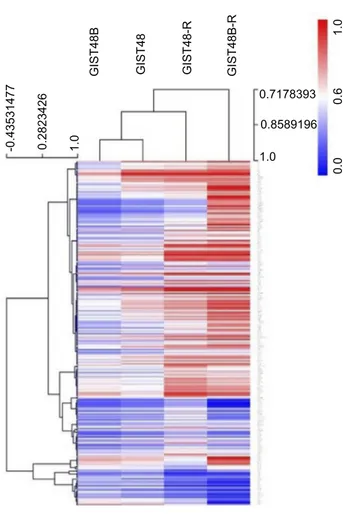
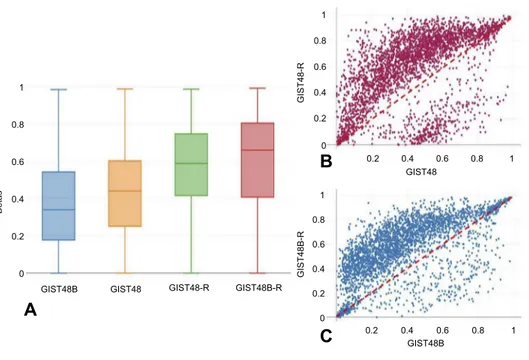
To determine whether acquired resistance involved mod-ifications in DNA methylation, we performed genome-wide DNA-methylation profiling in BYL719-sensitive and -resistant GIST cell lines. We identified 3,305 differ-entially methylated CpGs. Among these, 2,817 were hypermethylated and 488 hypomethylated. Of the hyper-methylated CpGs, 547 were in promoter regions of 379 genes, while 102 hypomethylated sites were in promoter regions of 70 genes. Unsupervised hierarchical cluster analysis of the demethylated genes divided the sensitive and resistant cell lines into two main clusters (Figure 4). Interestingly, as shown inFigure 5,A–C, the resistant cells showed significantly more hypermethylated CpG-island promoters compared to the sensitive counterparts.
Focal adhesion 1,07E-08 2,05E-09 7,57E-10 7,57E-10 3,72E-10 1,31E-12 8,77E-13 5,72E-14 1,15E-14 1,12E-14 1,11E-35 5,01E-38 4,20E-41 1,20E-42 7,27E-43 4,68E-43 7,07E-44 4,86E-44 2,72E-52 3,49E-59 5,22E-13 2,72E-13 2,26E-14 1,15E-15 2,81E-16 4,14E-17 1,26E-18 4,07E-28 4,55E-30 2,52E-36 5,53E-38 2,23E-38 4,78E-39 5,28E-40 5,28E-40 4,16E-41 2,88E-47 3,60E-58 1,44E-71 2,43E-81
Protein targeting to memanrane
Cellular component disassembly
Macromolecular complex disassembly
Translational initiation
Mrna metbolic process
Viral infectious cycle
Protein complex disassembly
Cellular protein complex disassembly
Viral reproduction
Viral reproductive process
KEGG pathways GO biological process
GO cellular component GO molecular function
Mapk signaling pathway
Htlv-i infection
Neurotrophin signaling pathway
Pancreatic cancer
Prostate cancer
Epstein-barr virus infection
Cell cycle
Chronic myeloid leukemia
Pathways in cancer Kinase dinding RAB3IP -4,00 -3,00 -2,00 -1,00 0,00 1,00 2,00 3,00
Top deregulated genes
A
B
mRNA expression (log2) 4,00 TNFSF10MAL2 FOSDSG2LXNEGR1CHAC1CLMN SEMA3C H19 ACSM3 GAB2TSHZ2 C16orf89 CUX2ATOH 8 SGK1 SLC14A1BRINP1 Ribosomal subunit Nucleoplasm Nuclear part
Intracellular non-membrane-bounded organelle
Non-membrane-bounded organelle Nuclear lumen Cytosolic part Ribonucleoprotein complex Macromolecular complex Cytosol Protein kinase binding
Positive regulation of transcription. DNA-dependent
Rna splicing
Nucleotide dinding
Enzyme binding
Transcription factor binding
Structural molecule activity
Structural constituent of riboseome
Rna binding
Figure 2 RNA-seq analysis.
Notes: (A) Top deregulated genes in BYL719-sensitive and -resistant GIST cell lines. (B) Go functional enrichment analysis of up- and downregulated genes. Abbreviations: GIST, gastrointestinal stromal tumors; GO, gene ontology.
Table 3 The most significantly deregulated miRNAs
miRNA P-value Adjusted
P-value hsa-miR1243 2.94–6 0.002232799 hsa-miR520c-3p 1.27–5 0.003316809 hsa-miR190b 1.31–5 0.003316809 hsa-miR1289 2.72–5 0.005164803 hsa-miR1247-5p 0.000118 0.016017348 hsa-miR22-3p 0.000126 0.016017348 hsa-miR1267 0.000188 0.020418143 hsa-miR299-5p 0.000237 0.022470219 hsa-miR125b-5p 0.000294 0.024789505 hsa-miR656-3p 0.000447 0.033993852 hsa-miR331-5p 0.000591 0.040837133 hsa-miR149-3p 0.000868 0.054998185 hsa-miR30d-5p 0.001126 0.065812471
Cancer Management and Research downloaded from https://www.dovepress.com/ by 137.204.234.57 on 19-Jul-2019
miRNAs and mRNA network
To construct miRNA–DEG networks, we downloaded the experimentally verified associations between human miRNAs and their targets from miRTarBase. This data set consists of 4,076 miRNAs and 23,054 mRNAs,28and encloses more than 400,000 miRNA–target interactions collected by manually surveying pertinent literature after systematic data
mining of the text. Among the 13 deregulated miRNAs retrieved by our data, seven (miR331-5p, miR125b-5p, miR520c-3p, miR1289, miR299-5p, miR30d-5p, and miR149-3p) had verified associations with their targets. However, taking into account the canonical inverse correlation between miRNA and target expression, we were able to iden-tify eight mRNA–miRNA networks. In particular, we found
GIST48 -5.0 0.0 5.0 -0.9812809 -0.99282813 0.00358559346 1.0 0 hsa-mir-149-3b hsa-mir-520c-3p Pathways in cancer PI3K-Akt signaling pathway
MAPK signaling patwayRas signaling pathway Endocytosis
Rap1 signaling pathwayProteoglycans in cancer
Transcriptional misregulation in cancer Axon guidance
Protein processing in endoplasmic reticulum
20
Number of target genes
40 60 80 100 120 140 hsa-miR-190b hsa-miR-1243 hsa-miR-520c-3p hsa-miR-1285 hsa-miR-1267 hsa-miR-125b-5p hsa-miR-22-3p hsa-miR-656-3p hsa-miR-331-5p hsa-miR-1247-5p hsa-miR-149-3p hsa-miR-299-5p 0.009359539 1.0 GIST48-R GIST48B GIST48B-R
A
B
C
hsa-mir-190bFigure 3 miRNAs profile .
Notes: (A) miRNA hierarchical clustering. miRNAs identified as differentially expressed between BYL719-sensitive and -resistant GIST cell lines were selected as markers for unsupervised hierarchical clustering. (B) GO functional enrichment analysis of up- and downregulated miRNAs. (C) Main miRNAs involved in cancer (blue), AKT–mTOR (green) and JAK signaling cascades (pink) pathways.
Cancer Management and Research downloaded from https://www.dovepress.com/ by 137.204.234.57 on 19-Jul-2019
four miRNAs downregulated and the corresponding seven targets overexpressed (three miRNAs targeted two distinct mRNAs). One miRNAwas upregulated and the corresponding target downregulated. The miRNAs and their corresponding targets are presented inFigure 6.
DNA methylation and mRNA network
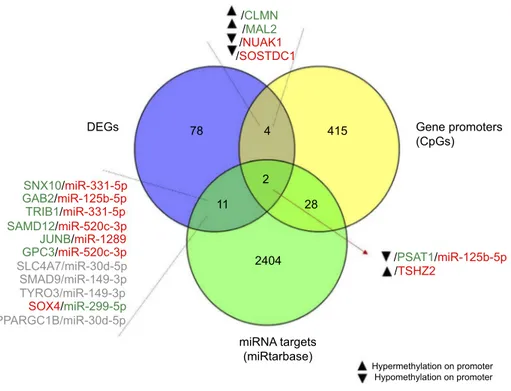
To clarify the relationship between DNA methylation and differentially expressed mRNAs, we integrated the global methylation profile with DEGs. Results are shown inFigure 7. Among the genes with the strongest promoter hypermethylation and concomitant increased expression in resistant cells were CLMN, a member of the hedgehog-interacting protein family MAL, which encodes the T-lymphocyte maturation-associated protein and functions in T-cell differentiation. On the contrary, promoter hyper-methylation and concomitant TSHZ2 downregulation was observed, whereas PSAT1 showed strong promoter
hypomethylation associated with increased gene expression after treatment. Overexpression of PSAT1 was confirmed by qRT-PCR, which demonstrated overexpression of PSAT1 in GIST48-R and GIST48B-R compared with the parental BYL719-sensitive lines, with fold changes of 4.1 and 5.8, respectively.
Construction of the miRNA
–mRNA–
DNA methylation network
In order to identify a more comprehensive network, we integrated data deriving from GEP, miRNA, and methyla-tion profiles. After intersection of all the data, the PSAT1 gene was significantly upregulated in BYL719-resistant cell lines and showed promoter hypomethylation and a potential modulation by miR125b-5p (Figure 7).
Discussion
GISTs represent a worldwide paradigm of target therapy. The introduction of imatinib to clinical practice has deeply revolutionized its management, leading GISTs from an incurable disease to a sort of chronic disease. Imatinib has determined terrific improvement in GIST prognosis; however, as often happens with TKIs, the majority of patients acquire secondary mutations and the disease pro-gresses. Unfortunately, no therapeutic options are available for patients who have failed on imatinib and the subse-quent therapeutic lines: sunitinib and regorafenib. Therefore, it is pivotal and mandatory to identify novel molecules— different from TKIs — and/or strategies to overcome the inevitable resistance. In this context, after the promising preclinical data on the novel PI3K inhibitor BYL719,10the NCT01735968 trial in GIST patients who had previously failed treatment with imatinib and sunitinib started. BYL719 attracted our attention, and we compre-hensively characterized genomic and transcriptomic changes taking place during resistance. Understanding how GIST cells evolve from being sensitive to drug-resistant, from an omic point of view might accelerate the identification of novel druggable targets. For this purpose, we generated two in vitro GIST models of acquired resis-tance to BYL719 and performed an omic-based analysis by integrating RNA-seq, miRNA, and methylation pro fil-ing in sensitive and resistant cells. In particular, we selected GIST48 and GIST48B, sharing activation of KIT downstream signaling, including the PI3K pathway, tar-geted by BYL719.29Furthermore, both cell lines are resis-tant to the second-line treatment sunitinib,30making them
GIST48 GIST48-R GIST48B GIST48B-R -0.43531477 0.2823426 1.0 1.0 0.0 0.6 1.0 0.8589196 0.7178393
Figure 4 Global methylation profile.
Notes: Heat map showing DNA-methylation profiles in parental and BYL719-resistant cell lines (Δβ<–0.2 or >0.2).
Cancer Management and Research downloaded from https://www.dovepress.com/ by 137.204.234.57 on 19-Jul-2019
good models, mirroring GIST patients who hypothetically will receive BYL719 treatment after imatinib and sunitinib failure.
TKI resistance is largely due to accumulation of addi-tional kinase-domain mutations.31Therefore, we sequenced KIT and PI3KCA hot-spot exons — in addition to RNA-seq— to evaluate the appearance of novel point mutations or insertion/deletion variants possibly able to explain BYL719 resistance. Different alterations were found in BYL719-resistant lines; however, none was shared by both models, or harbored in PI3KCA and KIT genes, or downstream effectors. In addition, none of the mutated
genes has been involved in drug resistance; therefore, we did not consider them driver events for BYL719 unrespon-siveness, pinpointing a potential novel mechanism of resis-tance in GISTs. Afterward, we analyzed a precast panel of 50 well-characterized ABC-transporter genes. Overexpression of genes involved in drug efflux is among the most common mechanisms of drug resistance.32–34 However, we did not observe any significant difference in BYL719-resistant cell lines compared to sensitive ones. This prompted us to perform a more comprehensive gene-expression analysis through the RNA-seq approach. We identified the H19 gene as one of the most significantly upregulated in BYL719-resistant cells compared to sensi-tive ones. H19 has been described as an oncogenic lncRNA involved in cell proliferation, metastasis, epithelial– mesenchymal transition, and poor prognosis in several can-cer types, including esophageal squamous-cell carcinoma, osteosarcoma, colorectal and gastric cancer, and others.35–38 A recent study reported H19 overexpression in GIST samples compared to normal paired tissue.39 In addition, H19 upregulation showed a high correlation with ETV1 expression, which is crucial in GIST growth and survival. ETV1 cooperates with KIT through the MAPK-signaling pathway, and together they promote GIST tumorigenesis.40 Furthermore, it has been reported that H19 might promote migration and invasion in colorectal cancer by activating the RAS protein and upregulating
TRIB1 miR-331-5p miR-1289 miR-125b-5p miR-520c-3p miR-299-5p SNX10 SOX4 PSAT1 GAB2 GPC3 SAMD12 JUNB
Figure 6 Integrated miRNA–mRNA regulatory networks.
Notes: Integration of GEP and miRNA profiles. Circles and squares represent genes and miRNAs, respectively. Red and green indicate downregulation and upre-gulation, respectively.
Abbreviation: GEP, gene expression profile.
GIST48 GIST48 GIST48-R GIST48-R GIST48B GIST48B 0 0.2 0.4 Betas 0.6 0.8 1 0 0.2 0.4 0.6 0.8 1 0 0.2 0.2 0.4 0.4 0.6 0.6 0.8 0.8 1 1 0.2 0.4 0.6 0.8 1 GIST48B-R GIST48B-R
A
B
C
Figure 5 Global methylation profile.Notes: (A) Box plots showing theβ-values of CpGs islands at promoters only . General hypermethylation was more common in the BYL719-resistant cell lines. (B, C) Scatterplots of genome-wide DNA methylation levels (β). To highlight general hypermethylation, CpG islands with Δβ<–0.2 or >0.2 are shown.
Cancer Management and Research downloaded from https://www.dovepress.com/ by 137.204.234.57 on 19-Jul-2019
levels of RAF, MEK and phospho-MAPK.41 Considering that RAS is upstream of both the PI3K and MAPK pathways,42 this could represent an alternative mechanism through which resistant cells bypass PI3K and maintain their tumorigenic status. This assumption was confirmed by Western blot analysis, high-lighting MAPK activation in both parental and BYL719-resistant cell lines. Interestingly, we also observed a weak activation of mTOR in BYL719-resistant cell lines, despite no AKT activity. This finding agrees with the recognized complex and dynamic cross talk between PI3K/AKT and MAPK.43,44 Pathway cross talk allows a cell to achieve robust activation of key downstream targets or compensa-tory signaling. Particularly, the latter might be important in the context of drug resistance, allowing growth and viabi-lity of cancer cells. Indeed, combined inhibition of PI3K– Akt and MAPK pathways has shown efficacy in preclini-cal models,43–46 and could be of interest in the manage-ment of imatinib-resistant GISTs.
Considering the lack of acquired PI3KCA muta-tions, we further evaluated the hypothesis that BYL719 resistance could be mediated by epigenetic mechanisms. Studies reported that epigenetic modi fica-tions may represent alternative mechanisms to evade
the pharmacological response.47–49 In this context, dif-ferent trials are evaluating epigenetic therapies as drug-resistance modulators in solid tumors.47 With regard to GISTs, in recent years epigenetic treatments raised among the future perspective50,51 alternatively to TKIs and/or to bypass TKI resistance. However, the results are still at an early stage, and further investiga-tions are essential in this novelfield. Consequently, we performed deep epigenomic characterization of these two in vitro models, looking for novel mechanisms of acquired resistance and potential druggable targets in GISTs. For this purpose, we performed miRNA pro fil-ing, identifying 13 miRNAs significantly deregulated in resistant cells. Among the pathways potentially modu-lated by these miRNAs, the most significant and those with the greatest number of target genes were PI3K/ AKT–MAPK, and RAS cascades, which are involved in BYL719's mechanism of action. Subsequently, inte-gration of miRNA arrays and GEP revealed five miRNAs targeting eight genes (TRIB1, GAB2, SNX10, SAMD12, JUNB, GPC3, and SOX4). Among those genes, TRIB1 is a downstream effector of PI3K, and GAB252 cooperates with the PI3K–AKT pathway in promoting malignant behavior in cells.53,54
/CLMN /PSAT1/miR-125b-5p /MAL2 SNX10/miR-331-5p GAB2/miR-125b-5p TRIB1/miR-331-5p SAMD12/miR-520c-3p JUNB/miR-1289 GPC3/miR-520c-3p SOX4/miR-299-5p /NUAK1 /SOSTDC1 Gene promoters (CpGs) DEGs 78 415 2404 11 2 4 28 miRNA targets (miRtarbase) Hypermethylation on promoter Hypomethylation on promoter SMAD9/miR-149-3p TYRO3/miR-149-3p PPARGC1B/miR-30d-5p SLC4A7/miR-30d-5p /TSHZ2
Figure 7 Integrated miRNA–mRNA–methylation regulatory networks.
Notes: Integration of GEP, miRNA, and methylation profiles. In gray are shown genes and miRNAs with the same trend of expression, which were excluded. Red and green indicate downregulation and upregulation, respectively.
Abbreviation: GEP, gene expression profile.
Cancer Management and Research downloaded from https://www.dovepress.com/ by 137.204.234.57 on 19-Jul-2019
Subsequently, we integrated methylation and GEP, iden-tifying two networks of interest involving TSHZ2 and PSAT1. The TSHZ2 gene resulted in downregulated BYL719-resistant cells compared to sensitive ones. TSHZ2, a zinc-finger homeobox nuclear protein, is sup-posed to be a tumor suppressor and is downregulated in breast cancer.55 We speculated that TSHZ2 might bind transcriptional regulators that control the expression of cru-cial genes in tumorigenesis and resistance acquisition. Moreover, PSAT1 was upregulated in BYL719-resistant cells, and concomitant hypomethylation on the PSAT1 pro-moter was found. However, on integration of miRNA and methylation profiles with gene-expression analysis, we pin-pointed overexpression of PSAT1 associated with both pro-moter hypomethylation and miR125b-5p downregulation. In particular, PSAT1 overexpression in BYL719-resistant cell lines could represent an advantage for resistant cells, which have tofind novel ploys to live.
Here, we showed that both methylation and miRNA modulated PSAT1 overexpression. Additional studies are needed to clarify if the epigenetic mechanisms act concur-rently or in a mutual manner, with thefinal goal of increas-ing PSAT1 levels, which confer a metabolic-related growth advantage to tumor cells. PSAT1 overexpression is involved in drug resistance in different tumors, including colorectal cancer, melanoma, pancreatic cancer, and non-small-cell lung cancer.56,57 PSAT1 belongs to the serine biosynthesis pathway, which has a key role in nucleotide and amino-acid metabolism. Levels of enzymes involved in serine synthesis have been shown to increase under conditions of DNA damage and genomic instability.57,58 In addition, a recent study reported that serine supports one-carbon metabolism and proliferation of cancer cells.59Moreover, different evi-dence suggests that the serine pathway is crucial in cancer metabolism, using glycolysis-derived glucose for serine production and tumor growth.60–64 In addition to these studies, which clearly ascribed to PSAT1 a role in tumor-igenesis, a recent study on esophageal squamous-cell carci-noma patients linked PSAT1 overexpression to upregulation of the PI3K–AKT–GSK3β–Snail pathway.65Therefore, tar-geting PSAT1 might have potential therapeutic implication in GIST patients.
In conclusion, we identified novel epigenomic mechan-isms of pharmacological resistance in GISTs, suggesting the existence of pathways involved in drug resistance and alternative to acquired mutations. We are aware that pro-longed exposure and high BYL719 concentrations used to generate the resistant models can be de facto a substantial
source of numerous off-target effects. However, prolonged inhibition of the PI3K pathway is probably accompanied by profound transcriptomic, proteomic, and metabolomic changes involved in drug resistance. Therefore, epige-nomics should be taken into account as an alternative adaptive mechanism. Currently we do not have access to GIST patients in treatment with BYL719, and thus we are not able to verify the hypothesis in vivo. However, we consider these results intriguing, particularly the involve-ment of H19 and PSTA1 in GIST resistance, which might represent novel druggable targets for GIST patients.
Acknowledgments
This work was supported by the Ministry of Education, University, and Research of Italy (MIUR; grant 2015Y3C5KP_002 to SA). Gloria Ravegnini is supported by an MSD Italia fellowship granted by and on behalf of MSD and L’Oréal–UNESCO for Women in Science. Giulia Sammarini is supported by Fondazione Famiglia Parmiani.
Disclosure
The authors report no conflicts of interest in this work.
References
1. Mei L, Smith SC, Faber AC, et al. Gastrointestinal stromal tumors: the GIST of precision medicine. Trends Cancer. 2018;4(1):74–91.
doi:10.1016/j.trecan.2017.11.006
2. Corless CL, Barnett CM, Heinrich MC. Gastrointestinal stromal tumours: origin and molecular oncology. nat rev cancer. 2011;11 (12):865–878. doi:10.1038/nrc3143
3. Serrano C, George S. Recent advances in the treatment of gastrointest-inal stromal tumors. Ther Adv Med Oncol. 2014;6(3):115–127.
doi:10.1177/1758834014522491
4. Demetri GD, van Oosterom AT, Garrett CR, et al. Efficacy and safety of sunitinib in patients with advanced gastrointestinal stromal tumour after failure of imatinib: a randomised controlled trial. Lancet (London, England). 2006;368(9544):1329–1338. doi:10.1016/S0140-6736(06)69446-4
5. Demetri GD, Reichardt P, Kang Y-K, et al. Efficacy and Safety of regorafenib for advanced gastrointestinal stromal tumours after failure of imatinib and sunitinib (GRID): an international, multicentre, rando-mised, placebo-controlled, phase 3 trial. Lancet. 2013;381 (9863):295–302. doi:10.1016/S0140-6736(12)61857-1
6. Hemming ML, Heinrich MC, Bauer S, George S. Translational insights into gastrointestinal stromal tumor and current clinical advances. Ann Oncol Off J Eur Soc Med Oncol.2018. doi:10.1093/ annonc/mdy309
7. Liegl B, Kepten I, Le C, et al. Heterogeneity of Kinase inhibitor resistance mechanisms in GIST. J Pathol. 2008;216(1):64–74. doi:10.1002/path.2382
8. Yoo C, Ryu M-H, Jo J, Park I, Ryoo B-Y, Kang Y-K. Efficacy of imatinib in patients with platelet-derived growth factor receptor alpha– mutated gastrointestinal stromal tumors. Cancer Res Treat. 2016;48 (2):546–552. doi:10.4143/crt.2015.015
Cancer Management and Research downloaded from https://www.dovepress.com/ by 137.204.234.57 on 19-Jul-2019
9. Cassier PA, Fumagalli E, Rutkowski P, et al. Outcome of patients with platelet-derived growth factor receptor alpha-mutated gastroin-testinal stromal tumors in the tyrosine kinase inhibitor era. Clin Cancer Res. 2012;18(16):4458–4464. doi:10.1158/1078-0432.CCR-11-3025
10. Van Looy T, Wozniak A, Floris G, et al. Phosphoinositide 3-kinase inhibitors combined with imatinib in patient-derived xenograft mod-els of gastrointestinal stromal tumors: rationale and efficacy. Clin Cancer Res. 2014;20(23):6071–6082. doi:10.1158/1078-0432.CCR-14-1823
11. Fritsch C, Huang A, Chatenay-Rivauday C, et al. Characterization of the novel and specific PI3Kα inhibitor NVP-BYL719 and development of the patient stratification strategy for clinical trials. Mol Cancer Ther.
2014;13(5):1117–1129. doi:10.1158/1535-7163.MCT-13-0865 12. Serrano C, Wang Y, Mariño-Enríquez A, et al. KRAS and KIT
gate-keeper mutations confer polyclonal primary imatinib resistance in GI stromal tumors: relevance of concomitant phosphatidylinositol 3-kinase/AKT dysregulation. J Clin Oncol. 2015;33(22):e93–6. doi:10.1200/JCO.2013.48.7488
13. Bauer S, Duensing A, Demetri GD, Fletcher JA. KIT oncogenic signaling mechanisms in imatinib-resistant gastrointestinal stromal tumor: PI3-kinase/AKT is a crucial survival pathway. Oncogene.
2007;26(54):7560–7568. doi:10.1038/sj.onc.1210558
14. Vivanco I, Sawyers CL. The phosphatidylinositol 3-kinase AKT pathway in human cancer. Nat Rev Cancer. 2002;2(7):489–501. doi:10.1038/nrc839
15. Patel S. Exploring novel therapeutic targets in GIST: focus on the PI3K/Akt/MTOR pathway. Curr Oncol Rep. 2013;15(4):386–395. doi:10.1007/s11912-013-0316-6
16. Ríos-Moreno MJ, Jaramillo S, Díaz-Delgado M, et al. Differential activation of MAPK and PI3K/AKT/MTOR pathways and IGF1R expression in gastrointestinal stromal tumors. Anticancer Res.
2011;31(9):3019–3025.
17. Ulukaya E, Colakogullari M, Wood EJ. Interference by anti-cancer chemotherapeutic agents in the MTT-tumor chemosensitivity assay. Chemotherapy.2004;50(1):43–50. doi:10.1159/000077285
18. Kumar P, Henikoff S, Ng PC. predicting the effects of coding non-synonymous variants on protein function using the SIFT algorithm. Nat Protoc.2009;4(7):1073–1081. doi:10.1038/nprot.2009.86
19. Adzhubei IA, Schmidt S, Peshkin L, et al. A method and server for predicting damaging missense mutations. Nat Methods. 2010;7 (4):248–249. doi:10.1038/nmeth0410-248
20. Schwarz JM, Cooper DN, Schuelke M, Seelow D. MutationTaster2: mutation prediction for the deep-sequencing age. Nat Methods.
2014;11(4):361–362. doi:10.1038/nmeth.2890
21. Barault L, Amatu A, Siravegna G, et al. Discovery of methylated circulating DNA biomarkers for comprehensive non-invasive mon-itoring of treatment response in metastatic colorectal cancer. Gut.
2017. doi:10.1136/gutjnl-2016-313372 gutjnl-2016-313372. 22. Moran S, Arribas C, Esteller M. Validation of a DNA methylation
microarray for 850,000 cpg sites of the human genome enriched in enhancer sequences. Epigenomics.2016;8(3):389–399. doi:10.2217/ epi.15.114
23. Omarini C, Filieri ME, Bettelli S, et al. Mutational profile of metastatic breast cancer tissue in patients treated with exemestane plus everolimus. Biomed Res Int.2018;2018:3756981. doi:10.1155/2018/3756981 24. Tessitore A, Bruera G, Mastroiaco V, et al. KRAS and 2 rare PI3KCA
mutations coexisting in a metastatic colorectal cancer patient with aggressive and resistant disease. Hum Pathol. 2018;74:178–182. doi:10.1016/j.humpath.2018.01.021
25. Lai K, Killingsworth MC, Lee CS. Gene of the Month: PIK3CA. J Clin Pathol.2015;68(4):253–257. doi:10.1136/jclinpath-2015-202885 26. Samuels Y, Wang Z, Bardelli A, et al. High frequency of mutations of
the PIK3CA gene in human cancers. Science.2004;304(5670):554. doi:10.1126/science.1096502
27. Vlachos IS, Zagganas K, Paraskevopoulou MD, et al. DIANA-MiRPath v3.0: deciphering MicroRNA function with experimental support. Nucleic Acids Res.2015;43(W1):W460–W466. doi:10.1093/ nar/gkv403
28. Chou C-H, Shrestha S, Yang C-D, et al. MiRTarBase update 2018: a resource for experimentally validated MicroRNA-target interactions. Nucleic Acids Res. 2018;46(D1):D296–D302. doi:10.1093/nar/gkx1067
29. Mühlenberg T, Zhang Y, Wagner AJ, et al. Inhibitors of deacetylases suppress oncogenic KIT signaling, acetylate HSP90, and induce apoptosis in gastrointestinal stromal tumors. Cancer Res.2009;69 (17):6941–6950. doi:10.1158/0008-5472.CAN-08-4004
30. Heinrich MC, Maki RG, Corless CL, et al. Primary and secondary kinase genotypes correlate with the biological and clinical activity of sunitinib in imatinib-resistant gastrointestinal stromal tumor. J Clin Oncol.2008;26(33):5352–5359. doi:10.1200/JCO.2007.15.7461 31. Wardelmann E, Merkelbach-Bruse S, Pauls K, et al. Polyclonal
evolu-tion of multiple secondary KIT mutaevolu-tions in gastrointestinal stromal tumors under treatment with imatinib mesylate. Clin Cancer Res.
2006;12(6):1743–1749. doi:10.1158/1078-0432.CCR-05-1211 32. Beretta GL, Cassinelli G, Pennati M, Zuco V, Gatti L. Overcoming
ABC transporter-mediated multidrug resistance: the dual role of tyrosine kinase inhibitors as multitargeting agents. Eur J Med Chem.2017;142:271–289. doi:10.1016/j.ejmech.2017.07.062 33. Choi YH, Yu A-M. ABC transporters in multidrug resistance and
phar-macokinetics, and strategies for drug development. Curr Pharm Des.
2014;20(5):793–807. doi:10.2174/138161282005140214165212 34. Klukovits A, Krajcsi P. Mechanisms and therapeutic potential of
inhibiting drug efflux transporters. Expert Opin Drug Metab Toxicol.2015;11(6):907–920. doi:10.1517/17425255.2015.1028917 35. Raveh E, Matouk IJ, Gilon M, Hochberg A. The H19 long
noncoding RNA in cancer initiation, progression and metastasis -a proposed unifying theory. Mol Cancer. 2015;14(1):184. doi:10.1186/s12943-015-0458-2
36. Huarte M. The emerging role of LncRNAs in cancer. Nat Med.
2015;21(11):1253–1261. doi:10.1038/nm.3981
37. Yang Q, Wang X, Tang C, Chen X, He J. H19 promotes the migration and invasion of colon cancer by sponging MiR-138 to upregulate the expression of HMGA1. Int J Oncol. 2017;50(5):1801–1809. doi:10.3892/ijo.2017.3941
38. Li H, Yu B, Li J, et al. Overexpression of LncRNA H19 enhances carcinogenesis and metastasis of gastric cancer. Oncotarget.2014;5 (8):2318–2329. doi:10.18632/oncotarget.1913
39. Xue L, Wang Y, Yue S, Zhang J. The expression of miRNA-221 and miRNA-222 in gliomas patients and their prognosis. Neurol Sci.
2017;38(1):67–73. doi:10.1007/s10072-016-2710-y
40. Chi P, Chen Y, Zhang L, et al. ETV1 is a lineage survival factor that cooperates with KIT in gastrointestinal stromal tumours. Nature.
2010;467(7317):849–853. doi:10.1038/nature09409
41. Yang W, Redpath R, Zhang C, Ning N. Long non-coding RNA H19 promotes the migration and invasion of colon cancer cells via MAPK signaling pathway. Oncol Lett.2018;16(3):3365–3372. doi:10.3892/ ol.2018.9052
42. Tolcher AW, Peng W, Calvo E. Rational approaches for combination therapy strategies targeting the MAP kinase pathway in solid tumors. Mol Cancer Ther.2018;17(1):3–16. doi:10.1158/1535-7163.MCT-17-0349
43. Aksamitiene E, Kiyatkin A, Kholodenko B.N. Cross-talk between mitogenic Ras/MAPK and survival PI3K/Akt pathways: a fine balance. Biochem Soc Trans. 2012;40(5):139–146. doi:10.1042/ BST20110609
44. Alonso N, Diaz Nebreda A, Monczor F, et al. PI3K pathway is involved in ERK signaling cascade activation by histamine H2R agonist in HEK293T cells. Biochim Biophys Acta. 2016;1860 (9):1998–2007. doi:10.1016/j.bbagen.2016.06.016
Cancer Management and Research downloaded from https://www.dovepress.com/ by 137.204.234.57 on 19-Jul-2019
45. Serra V, Scaltriti M, Prudkin L, et al. PI3K Inhibition Results in Enhanced HER Signaling and Acquired ERK Dependency in HER2-Overexpressing Breast Cancer. Oncogene. 2011;30 (22):2547–2557. doi:10.1038/onc.2010.626
46. Engelman JA, Chen L, Tan X, et al. Effective use of PI3K and MEK inhibitors to treat mutant kras G12D and PIK3CA H1047R murine lung cancers. Nat Med.2008;14(12):1351–1356. doi:10.1038/nm.1890 47. Brown R, Curry E, Magnani L, Wilhelm-Benartzi CS, Borley J.
Poised epigenetic states and acquired drug resistance in cancer. Nat Rev Cancer.2014;14(11):747–753. doi:10.1038/nrc3819
48. Knoechel B, Roderick JE, Williamson KE, et al. An epigenetic mechanism of resistance to targeted therapy in T cell acute lymphoblastic leukemia. Nat Genet.2014;46(4):364–370. doi:10.1038/ng.2913
49. Salgia R, Kulkarni P. The genetic/non-genetic duality of drug ‘resis-tance’ in cancer. Trends Cancer. 2018;4(2):110–118. doi:10.1016/j. trecan.2018.01.001
50. Nervi C, De Marinis E, Codacci-Pisanelli G. Epigenetic treatment of solid tumours: a review of clinical trials. Clin Epigenetics.
2015;7:127. doi:10.1186/s13148-015-0157-2
51. Bauer S, Hilger RA, Mühlenberg T, et al. Phase I study of panobino-stat and imatinib in patients with treatment-refractory metapanobino-static gastrointestinal stromal tumors. Br J Cancer. 2014;110 (5):1155–1162. doi:10.1038/bjc.2013.826
52. De Marco C, Laudanna C, Rinaldo N, et al. Specific Gene expression signatures induced by the multiple oncogenic alterations that occur within the PTEN/PI3K/AKT pathway in lung cancer. PLoS One.
2017;12(6):e0178865. doi:10.1371/journal.pone.0178865
53. Wang Y, Sheng Q, Spillman MA, Behbakht K, Gu H. Gab2 regulates the migratory behaviors and e-cadherin expression via activation of the pi3k pathway in ovarian cancer cells. Oncogene. 2012;31 (20):2512–2520. doi:10.1038/onc.2011.435
54. Wang WJ, Mou K, Wu XF, et al. Grb2-associated binder 2 silen-cing impairs growth and migration of H1975 cells via modulation of PI3K-Akt signaling. Int J Clin Exp Pathol. 2015;8 (9):10575–10584.
55. Yamamoto M, Cid E, Bru S, Yamamoto F. Rare and frequent pro-moter methylation, respectively, of TSHZ2 and 3 genes that are both downregulated in expression in breast and prostate cancers. PLoS One.2011;6(3):e17149. doi:10.1371/journal.pone.0017149
56. Vié N, Copois V, Bascoul-Mollevi C, et al. Overexpression of phos-phoserine aminotransferase PSAT1 stimulates cell growth and increases chemoresistance of colon cancer cells. Mol Cancer.
2008;7(1):14. doi:10.1186/1476-4598-7-14
57. Ross KC, Andrews AJ, Marion CD, Yen TJ, Bhattacharjee V. Identification of the serine biosynthesis pathway as a critical compo-nent of BRAF inhibitor resistance of melanoma, pancreatic, and non– small cell lung cancer cells. Mol Cancer Ther. 2017;16 (8):1596–1609. doi:10.1158/1535-7163.MCT-16-0798
58. Markkanen E, Fischer R, Ledentcova M, Kessler BM, Dianov GL. Cells deficient in base-excision repair reveal cancer hallmarks origi-nating from adjustments to genetic instability. Nucleic Acids Res.
2015;43(7):3667–3679. doi:10.1093/nar/gkv222
59. Labuschagne CF, van Den Broek NJF, Mackay GM, Vousden KH, Maddocks ODK. Serine, but not glycine, supports one-carbon meta-bolism and proliferation of cancer cells. Cell Rep. 2014;7 (4):1248–1258. doi:10.1016/j.celrep.2014.04.045
60. Schulze A, Harris AL. How cancer metabolism is tuned for prolif-eration and vulnerable to disruption. Nature. 2012;491 (7424):364–373. doi:10.1038/nature11706
61. Luo J. Cancer’s sweet tooth for serine. Breast Cancer Res.2011;13 (6):317. doi:10.1186/bcr2932
62. De Marchi T, Timmermans MA, Sieuwerts AM, et al. Phosphoserine aminotransferase 1 is associated to poor outcome on tamoxifen ther-apy in recurrent breast cancer. Sci Rep.2017;7(1):2099. doi:10.1038/ s41598-017-02296-w
63. Locasale JW, Grassian AR, Melman T, et al. Phosphoglycerate dehy-drogenase diverts glycolyticflux and contributes to oncogenesis. Nat Genet.2011;43(9):869–874. doi:10.1038/ng.890
64. Possemato R, Marks KM, Shaul YD, et al. Functional genomics reveal that the serine synthesis pathway is essential in breast cancer. Nature.2011;476(7360):346–350. doi:10.1038/nature10350 65. Liu B, Jia Y, Cao Y, et al. Overexpression of phosphoserine
aminotransferase 1 (PSAT1) predicts poor prognosis and associates with tumor progression in human esophageal squamous cell carcinoma. Cell Physiol Biochem. 2016;39(1):395–406. doi:10.1159/000445633
Cancer Management and Research downloaded from https://www.dovepress.com/ by 137.204.234.57 on 19-Jul-2019
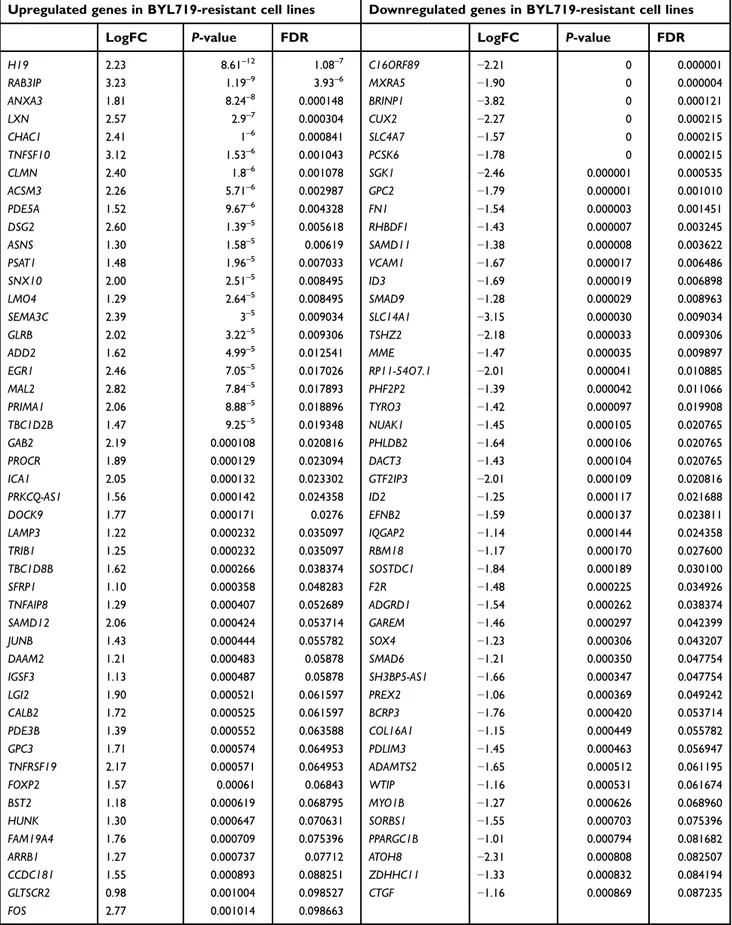
Supplementary materials
Table S1 List of genes differentially expressed in parental and resistant cell lines
Upregulated genes in BYL719-resistant cell lines Downregulated genes in BYL719-resistant cell lines
LogFC P-value FDR LogFC P-value FDR
H19 2.23 8.61–12 1.08–7 C16ORF89 −2.21 0 0.000001 RAB3IP 3.23 1.19–9 3.93–6 MXRA5 −1.90 0 0.000004 ANXA3 1.81 8.24–8 0.000148 BRINP1 −3.82 0 0.000121 LXN 2.57 2.9–7 0.000304 CUX2 −2.27 0 0.000215 CHAC1 2.41 1–6 0.000841 SLC4A7 −1.57 0 0.000215 TNFSF10 3.12 1.53–6 0.001043 PCSK6 −1.78 0 0.000215 CLMN 2.40 1.8–6 0.001078 SGK1 −2.46 0.000001 0.000535 ACSM3 2.26 5.71–6 0.002987 GPC2 −1.79 0.000001 0.001010 PDE5A 1.52 9.67–6 0.004328 FN1 −1.54 0.000003 0.001451 DSG2 2.60 1.39–5 0.005618 RHBDF1 −1.43 0.000007 0.003245 ASNS 1.30 1.58–5 0.00619 SAMD11 −1.38 0.000008 0.003622 PSAT1 1.48 1.96–5 0.007033 VCAM1 −1.67 0.000017 0.006486 SNX10 2.00 2.51–5 0.008495 ID3 −1.69 0.000019 0.006898 LMO4 1.29 2.64–5 0.008495 SMAD9 −1.28 0.000029 0.008963 SEMA3C 2.39 3–5 0.009034 SLC14A1 −3.15 0.000030 0.009034 GLRB 2.02 3.22–5 0.009306 TSHZ2 −2.18 0.000033 0.009306 ADD2 1.62 4.99–5 0.012541 MME −1.47 0.000035 0.009897 EGR1 2.46 7.05–5 0.017026 RP11-54O7.1 −2.01 0.000041 0.010885 MAL2 2.82 7.84–5 0.017893 PHF2P2 −1.39 0.000042 0.011066 PRIMA1 2.06 8.88–5 0.018896 TYRO3 −1.42 0.000097 0.019908 TBC1D2B 1.47 9.25–5 0.019348 NUAK1 −1.45 0.000105 0.020765 GAB2 2.19 0.000108 0.020816 PHLDB2 −1.64 0.000106 0.020765 PROCR 1.89 0.000129 0.023094 DACT3 −1.43 0.000104 0.020765 ICA1 2.05 0.000132 0.023302 GTF2IP3 −2.01 0.000109 0.020816 PRKCQ-AS1 1.56 0.000142 0.024358 ID2 −1.25 0.000117 0.021688 DOCK9 1.77 0.000171 0.0276 EFNB2 −1.59 0.000137 0.023811 LAMP3 1.22 0.000232 0.035097 IQGAP2 −1.14 0.000144 0.024358 TRIB1 1.25 0.000232 0.035097 RBM18 −1.17 0.000170 0.027600 TBC1D8B 1.62 0.000266 0.038374 SOSTDC1 −1.84 0.000189 0.030100 SFRP1 1.10 0.000358 0.048283 F2R −1.48 0.000225 0.034926 TNFAIP8 1.29 0.000407 0.052689 ADGRD1 −1.54 0.000262 0.038374 SAMD12 2.06 0.000424 0.053714 GAREM −1.46 0.000297 0.042399 JUNB 1.43 0.000444 0.055782 SOX4 −1.23 0.000306 0.043207 DAAM2 1.21 0.000483 0.05878 SMAD6 −1.21 0.000350 0.047754 IGSF3 1.13 0.000487 0.05878 SH3BP5-AS1 −1.66 0.000347 0.047754 LGI2 1.90 0.000521 0.061597 PREX2 −1.06 0.000369 0.049242 CALB2 1.72 0.000525 0.061597 BCRP3 −1.76 0.000420 0.053714 PDE3B 1.39 0.000552 0.063588 COL16A1 −1.15 0.000449 0.055782 GPC3 1.71 0.000574 0.064953 PDLIM3 −1.45 0.000463 0.056947 TNFRSF19 2.17 0.000571 0.064953 ADAMTS2 −1.65 0.000512 0.061195 FOXP2 1.57 0.00061 0.06843 WTIP −1.16 0.000531 0.061674 BST2 1.18 0.000619 0.068795 MYO1B −1.27 0.000626 0.068960 HUNK 1.30 0.000647 0.070631 SORBS1 −1.55 0.000703 0.075396 FAM19A4 1.76 0.000709 0.075396 PPARGC1B −1.01 0.000794 0.081682 ARRB1 1.27 0.000737 0.07712 ATOH8 −2.31 0.000808 0.082507 CCDC181 1.55 0.000893 0.088251 ZDHHC11 −1.33 0.000832 0.084194 GLTSCR2 0.98 0.001004 0.098527 CTGF −1.16 0.000869 0.087235 FOS 2.77 0.001014 0.098663
Abbreviation: FDR, fold discovery rate.
Cancer Management and Research downloaded from https://www.dovepress.com/ by 137.204.234.57 on 19-Jul-2019
Cancer Management and Research
Dove
press
Publish your work in this journal
Cancer Management and Research is an international, peer-reviewed open access journal focusing on cancer research and the optimal use of preventative and integrated treatment interventions to achieve improved outcomes, enhanced survival and quality of life for the cancer patient.
The manuscript management system is completely online and includes a very quick and fair peer-review system, which is all easy to use. Visit http://www.dovepress.com/testimonials.php to read real quotes from published authors.
Submit your manuscript here: https://www.dovepress.com/cancer-management-and-research-journal GIST48B –2 0 0 50 Cell viability (%) 100 0 50 100 Log10 [µM] 2 –2 0 Log10 [µM] 2 GIST48B-R GIST48 GIST48-R Figure S1 MTT assay.
Notes: Cell viability in GIST48 and GIST48B (red curves) and BYL719-resistant counterparts (blue curves).
Cancer Management and Research downloaded from https://www.dovepress.com/ by 137.204.234.57 on 19-Jul-2019