Abstract. –OBJECTIVE: To analyze kinemat-ic viscosity and pH of unstimulated whole saliva, evaluate possible variations after sampling, identify any gender differences and detect possi-ble correlations between them.
SUBJECTS AND METHODS: The sample con-sisted of sixty-four healthy young adults (37 fe-males and 27 fe-males, mean age 25.2 years). Saliva was collected using the spitting method at 11:00 am. Kinematic viscosity was determined with a capillary viscometer (ViscoClock, Schott-Geräte Mainz, Germany) equipped with a micro-Ubbelo-hde capillary. Viscosity and pH were measured at a temperature of 36°C in a thermostatic bath. Vis-cosity and pH data were evaluated almost simul-taneously at six different times after sampling in order to identify any variations due to aging. The data were statistically analyzed using Student’s t test and Wilcoxon-Mann-Whitney test.
RESULTS: In total sample kinematic viscosity was 1.40 cSt (SD = 0.39; RSD % = 27.81), in the male and female groups was 1.33 cSt (SD = 0.35, RSD% = 26.31) and 1.45 cSt (SD = 0.41, RSD % = 28.45) respectively; the difference was not statis-tically significant. Viscosity decreased exponen-tially as a function of time after sampling then reaching a plateau around 1.12 cSt, while the pH values increased linearly. There was a trend of pH to increase while viscosity decreases.
CONCLUSIONS: Kinematic viscometry could be a valid tool to evaluate salivary viscosity. Degradation of saliva after sampling affects cosity and slightly pH. The use of capillary vis-cometer to evaluate salivary aging needs more improvements. Further studies are required to investigate and explain the effects of different techniques to reduce the film forming on the air/liquid interface during measurement.
Key Words:
Kinematic viscosity, Salivary pH, Capillary viscome-try, Human whole saliva.
Introduction
Whole saliva is a watery complex mixture of proteins and other molecules secreted
principal-Kinematic viscosity of unstimulated whole
saliva in healthy young adults
A. FOGLIO-BONDA, F. PATTARINO, P.L. FOGLIO-BONDA
1Department of Pharmaceutical Sciences, Amedeo Avogadro University of Eastern Piedmont, Novara, Italy
1Department of Translational Medicine University of Eastern Piedmont, Novara, Italy
ly by the salivary glands. Saliva contributes to numerous functions in oral cavity such as speech and swallowing of foods, maintenance of oral health, protection of mucosa from bacte-rial attack and fungal growth, prevention of de-mineralization of teeth and lubrication of oral cavity. The latter is one of the most important functions of saliva, which provides lubrication of the oral, pharyngeal and other hard (teeth) and soft (mucosal) oral tissues1-4. Lubrication is
generated by the viscous resistance to motion of saliva between surfaces and viscosity is the most representative parameter of this function1.
The most important macromolecules that con-tribute largely to the rheological properties and to the protective action of saliva are mucins5-8.
Rheologically saliva is a non-Newtonian pseudoplastic fluid (i.e. dynamic viscosity de-creases upon increasing shear rate)9. As show in
Table I different protocols were used to deter-mine salivary viscosity1,5-7,10-17. Therefore
non-standardized methodologies employed for saliva analysis can affect the variability of salivary viscosity data (e.g. it was noted that centrifuga-tion did not affect the rheological properties whereas other authors found a viscosity de-crease)9. Moreover, the decrease of saliva
vis-cosity due to its aging9,10,13 and the relationship
with pH are controversial. Is reported that
in-vitroincreasing or decreasing of saliva pH caus-es precipitation of mucins and consequently de-crease in viscosity1,9. Veerman et al9 found an
increase of viscosity at in-vitro lowered pH (4.5) due to the possible mucin association.
Consequently, it is possible that physiological or pathological changing of pH can affect sali-vary viscosity. Nowadays there is a lack in un-derstanding how saliva viscosity values are in-fluenced by pH in-vivo situation9. The aims of
this study were: (1) to determine pH and kine-matic viscosity of unstimulated whole saliva (U.W.S.) in a cohort of healthy young
volun-Time for Shear
Timetable sampling/ rate Temperature Viscosity Authors Cohort collection analysis Instrument (s-1) analysis (°C) (mPa∙s) Roberts BJ N = 20 9:00-11:00 Just after Cone plate 11.5; 230 37 < 12 × < 15; (1977) Y = 56.5 collection microviscometer < 2 × < 5
H = 20 (Brookfield)
Vissink A et al N = 2 9:00 Just after Low shear 94.5 35 2.5 (1984) Y = n.s. collection rheometer
H = n.s. (Contraves)
Nordbo H et al N = 1 n.s. n.s. Capillary n.s.
(1984) Y = n.s. rheometer
H = n.s. (Cannon) 26 < 1.26 × < 1.30 Waterman HA et al N = 7 9:00-11:00 Just after Couette-type 70* 25 1.1 (1988) Y = 23-48 collection (Contraves)
H = 7
Veerman ECI et al N = n.s. n.s. Freshly Low-shear 20.4 37 < 4.20 × < 4.25 (1989) Y = n.s. unhomogenized rheometer
H = n.s. (Contraves)
Van der Reijden N = 7 n.s. 5 minutes of Oscillating capillary 100 23 < 1.5 × < 2.0 WA et al (1994) Y = n.s. centrifugation rheometer
H = n.s. (Vilastic)
Rantonen PJF et al N = 30 8:00 Just after Cone plate 90 37 < 6 × < 7 (1998) Y = 22.7 ± 2.8 collection viscometer
H = 30 (Brookfield)
Preetha A et al N = n.s. n.s. n.s. Rotational co-axial 0.5-94.5 37 15.5- 2.8
(2005) Y = n.s viscometer
H = n.s (Contraves)
Park MS et al N = 20 9:00-11:00 Centrifuged Cone plate 90 37 2.52 ± 0.59 (2007) Y = 22- 35 10 min viscometer
H = 20 at 4°C (Brookfield)
Mehravaran N et al N = 10 n.s. 30 minutes Cone plate n.s. 25 20.16
(2008) Y = 24-60 viscometer
H = 10 (Brookfield)
Inoue H et al N = 40 14:00-18:00 Just after Round vibration n.s. n.s. 1.09 ± 0.11 (2008) Y = n.s. collection viscometer
H = 40 (CBC Materials).
Sajewicz E N = 14 6:00-7:00 5 hours Cone plate 450 20 2.33 ± 1.03
(2009) Y = 24-53 viscometer
H = 14 (Brookfield)
Actual research N = 64 11:00 Just after Capillary 533.78 36 1.40 ± 0.39 Y = 25.2 ± 8.7 collection viscometer
H = 64 (Schott-Geräte)
Table I. Reported viscosities of U.W.S. saliva.
N = number subjects; Y = age; H = healthy subjects; n.s.= not specified; *Measurement unit Hz.
Subjects and Methods
The study initially involved 68 Dental School students: 38 females and 30 males with a mean age of 25.8 years (range 18.6-29.4). They were informed of the purpose of the study, which was approved by the local Ethic Committee (n° RQ3210), and enrolled after their signed in-formed consent was obtained. All subjects an-swered an anamnestic form in order to exclude teers; (2) to assess possible variations in pH and
kinematic viscosity due to the degradation of saliva; (3) to investigate possible correlations between viscosity and pH. In order to increase robustness of the experimental data, the authors paid attention to: (1) reduce time between sam-pling and analysis and duration of the latter; (2) avoid any pre-treatment of saliva; (3) restrict in-terpersonal variation with a strict selection of the subjects.
those with systemic diseases, that could decrease saliva productions, or with symptoms such as dry mouth or oral burning syndrome, those taking drugs (except estrogens contraceptives) and women that could be pregnant. All enrolled sub-jects each year undergo a medical examination, including electrocardiogram, blood and urine tests for admission to the school attendance. An identification code consisting of a letter and a number was assigned to the subjects, and each of them was submitted to an oral examination dur-ing which particular attention was given to the condition of the mucous membrane in order to exclude subjects with oral diseases, wearing any intraoral appliances or having a poor oral hy-giene. The same dentist, expert in oral medicine and trained in salivary testing, performed the oral examinations. Four subjects were excluded dur-ing the preliminary selection: one had oral mu-cosa pathology, two provided a saliva sample volume less than the minimum required for the measurement, and one did not respect the behav-ioural norms. The final sample consisted of 64 subjects with a mean age of 25.2 years: 37 fe-males (57.8%), and 27 fe-males (42.2%).
The enrolled subjects were submitted to a rigid protocol of behavioural norms, already validated in a previous study18: in the two weeks preceding
the saliva collection, they had to avoid consump-tion of chewing gum; in the day before the collec-tion they had to be relaxed and not to practice sports activity. In the sampling day, participants had to be free from symptoms of fever and/or cold; if they were hungry or thirsty, they could eat or drink water, but later immediately they had to clean their teeth with a provided toothpaste; dur-ing the last hour before the salivary collection, it was not permitted them to eat, drink or smoke18.
All subjects were experienced, during the test, in the Province of Novara (Italy) or surrounding ar-eas. U.W.S. was collected at 11:00 a.m., under controlled temperature (22-24°C) and humidity conditions (75% ± 5%), in order to minimize vari-ations induced by these variables, using the spit-ting method31. U.W.S. was collected in a 5 minutes
time span. The undisturbed subject, sitting in a comfortable position, swallowed residual saliva present in the mouth before the beginning of the collection and then, with the head down and mouth slightly open, saliva was allowed to drip from the lower lip into a weighed, dried and sterile plastic test tube. In the last few seconds of the 5 minutes interval, saliva accumulated in the mouth was spat out into the plastic funnel. No other
con-scious movements of the oral musculature were al-lowed during the collection. A portable pH meter (HI 9026, Hanna Instruments, Burlington, VT, USA) with a special 5 mm diameter electrode was used to measure pH18. Viscosity was determined
by a capillary viscometer equipment (Visco Clock and micro Ubbelohde capillary series 357/10, Schott-Geräte Mainz, Germany), which measures kinematic viscosity (i.e. the resistance to flow of a stream under the sole influence of gravity)5,15,19-21.
The choice of this micro-capillary was dictated by the very small volume of sample to be measured. Kinematic viscosity was calculated in centiStokes (cSt) by multiplying the flow time showed by Vis-coClock by the capillary constant (0.01003 mm2/s2). Viscosity and pH were always measured
at 36°C temperature in a thermostatic bath. At the end of a single collection, part of the sample was transferred into the capillary to measure viscosity without any preliminary treatment, taking care to avoid to transfer bubbles and/or solid particles. The tube containing the residual sample was maintained in a thermostatic bath. Approximately 20 seconds before the end of a viscosity measure-ment, the tube was taken from the thermostatic bath, shaken, and pH was measured. Six succes-sive viscosity and pH measurements were carried out on the same sample. This procedure made it possible to measure viscosity and pH almost si-multaneously at six different times, and the values were plotted against time in order to identify any variations.
Statistical Analysis
The data were statistically analysed using R software 2.12.1. The values were descriptively analysed, including their relative standard devia-tion (RSD). To assess the normal distribudevia-tion of quantitative variables Shapiro-Wilk normality test was used. Variables with a normal distribution were compared by means of a Student’s t test for independent samples; Wilcoxon’s non-parametric test was used to compare variables without normal distribution. A p≤0.05 was considered statistically significant in all tests. Correlation coefficient R be-tween pH and viscosity was evaluated for both the total cohort and the two gender groups.
Results
pH
The pH increased linearly over time, with a mean variation of 0.03 points/min (Figure 1).
The first value of each sample was considered the most representative of the situation in oral cavity; consequently, only the first one was con-sidered for the statistical analysis. The pH values of the cohort ranged from 7.50 to 6.28 (mean 6.84, SD = 0.25, RSD% = 3.62) and were nor-mally distributed. In male and female groups maximum and minimum values were 7.37-6.49 and 7.50-6.28 respectively; the corresponding figures were: mean 6.93, SD = 0.20, RSD% =
2.89 and mean 6.78, SD = 0.26, RSD% = 3.83. The difference between the two groups was sta-tistically significant (p = 0.009).
Viscosity
Viscosity showed the tendency to decrease in a short time, reaching a constant value of about 1.12 cSt (Figure 2). The decrease ranged widely from subject to subject; the mean difference be-tween the first and second measurement was Figure 1. pH of saliva as a function of time (error bar as standard error).
12% but, as the maximum was 42% and the min-imum 1%, only the first value of each sample was used for the statistical analysis. The viscosi-ty value in total sample ranged from 2.91 to 0.90 cSt (mean 1.40 cSt, SD = 0.39, RSD% = 27.81) and were not normally distributed (p < 0.05). The average viscosity was 1.33 cSt (SD = 0.35, RSD% = 26.31) in the male and 1.45 cSt (SD = 0.41, RSD% = 28.45) in the female group re-spectively; no significant difference between gender was found (p = 0.153). During analysis a shear rate of 533.78 s-1was generated (calculated
by using Weissenberg-Rabinowitsch equation22).
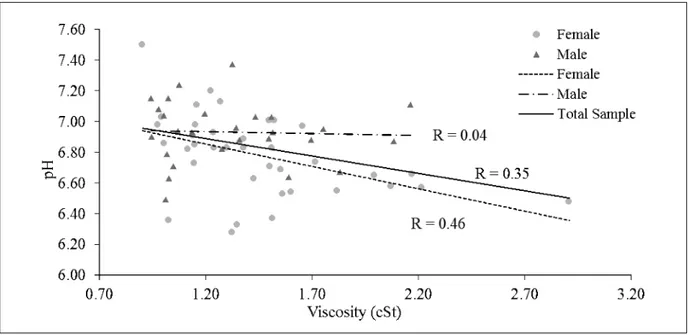
Correlation coefficient between pH and viscosity in the sample as a whole was 0.35. Analyzing the data separately for gender, higher R value for fe-male subject was found (R = 0.46), while no cor-relation was observed for male group (R = 0.04, Figure 3).
Discussion
It is know that saliva pH slowly rise due to the continuous loss of CO2 from saliva exposed to
air23. This increasing could be described by linear
regression (Figure 1); moreover no differences oc-cur in this rate between gender. This trend re-vealed how the accuracy of pH measurements de-pends on the time interval between collection and analysis. If a high precision is required, the saliva should be tested immediately after collection. Our
pH results are similar to that reported by Fenoll-Palomares et al24 and in our previous work18, but
not to that others authors: the difference may be due to subjects’ age, ethnic group, and to the time intervening between saliva collection and pH mea-surement18,24. In this study kinematic viscosity was
measured using capillary viscometer previously adopted by Nordbo et al1; it is not the most suited
in viscosity determination of saliva because is im-possible to set the shear rate during the measure25.
However, a review of the literature12,13 indicated
that saliva shows a Newtonian behavior at shear rates higher than 90 s-1. Usually, in micro-capillary
viscometer and with low viscosity fluids, like sali-va, high shear rate are generated25 (in our case
533.78 s-1); therefore accurate salivary viscosity
values could be obtained with a micro-capillary tool like that used in our work. Moreover, we think that the easiness of use of capillary viscome-ter could be a great advantage in salivary studies. Although a rotational viscometer allows to per-form a more detailed rheological analysis, capil-lary viscometer is preferred when rapid testing is required5, because it allows reducing the time for
loading the sample and the aging of the material. With capillary viscometer it is not necessary to let the sample recover from the shear-induced effects (typically with rotational viscometer), reducing the time of measure. With capillary viscometer it is not necessary to apply pre-treatment to the sali-va; filtration, centrifugation, or addition of surfac-tant are required when viscosity is determined by
other types of viscometer9. Saliva is a biologic
flu-id that underwent several chemical and biochemi-cal reactions after collection (i.e. become aged). However, there is a lack in understanding how ag-ing affects viscosity value of saliva. Bongaerts et al26demonstrated that 24 hours aging of saliva
re-sults in a dramatic decrease of viscosity. Rantonen et al13 found that stimulated saliva viscosity
re-mains almost constant during the first 30 minutes after collection. Other authors affirmed that vis-cosity of stimulated saliva decreases within few hours9; otherwise unstimulated saliva seems to be
less stable (first 5-8 minutes)10. Sajewicz17
re-vealed that unstimulated saliva viscosity starts to decrease immediately after collection and reaches a plateau value within 5 hours17. Therefore, the
ex-ponential trend of viscosity found in our measure-ments could be associated to a rapid aging of sali-va due to several physico-chemical phenomena, among them the most signifcant been absorption at air/liquid interface of mucins7. Capillary
vis-cometer could be a valid tool for the evaluation of salivary viscosity, especially because it is rapid and easier to use than other types of viscometer. Nevertheless, repeated measures on the same sam-ple damage saliva, and only the first run may give a correct rheological measure. Taking in account that saliva has a specific gravity of 1.0013,14,27,28,
and its shear rate was 533.78 s-1 (as calculated
from our data), it is possible to compare our values with dynamic viscosity values obtained by other authors. Unfortunately, some data cannot be fully compared because several authors did not report all the necessary information for the comparison. In other cases different instruments, shear rate or temperature were adopted during measurements, moreover different time between sampling and analysis occur in several works (Table I). Like Rantonen et al13, we did not find any significant
differences between genders. Furthermore, despite the accurate selection of donors, our viscosity val-ues showed relatively high variations (2.91 to 0.90 cSt), that are comparable to those reported in the majority of the cited studies (Table I). This finding could be due to a high interpersonal variability of viscosity values. It is known that UWS viscosity is provided mainly by its content of high weight molecular glycoproteins (i.e. mucins) that are sen-sitive to environmental changes such pH that in-duce modifications of conformation and interac-tions of these macromolecules1,6. However, in
in-vitroexperiments, only with a great deviation from physiological value of pH significant modification in viscosity values occurs6. This consideration
could explain why in our donor population (young healthy subjects) pH and viscosity are not well correlated. It is possible that using a broad donor population, including pathological subjects (i.e. with pH lower than 6) correlation between pH and viscosity could become more evident.
Conclusions
Understanding saliva rheology and the princi-ples that affect his properties are clinically im-portant for people with a compromised or altered function or production of saliva. It is known that viscosity changing has been associated with de-velopment of oral disease in human model stud-ies29. Saliva is intrinsically inhomogeneous, as it
simultaneously consists of a liquid-gaseous and a gel phase9. The complexity of this system reduce
the accuracy in the evaluation of its characteris-tics and in particular of viscosity. The use of dif-ferent methods for saliva viscosity determination make difficult to compare the results of different studies; therefore there is a need to create a pro-tocol that would standardise the evaluation of salivary viscosity. Within the limitations of this study, we can say that capillary viscometry can be a valid method to evaluate this property. Al-though, the capillary viscometry for the evalua-tion of salivary aging needs more improvements. The modification of saliva after sampling signifi-cantly affects the pH value in a linear way, while it is not possible to estimate how aging affects viscosity values. Further studies are required to investigate and explain the interpersonal varia-tions in viscosity, and the effects of different techniques in reducing the film formation on the surface of viscometer during the measure.
–––––––––––––––––-–––– Conflict of Interest
The Authors declare that there are no conflicts of interest.
References
1) NORDBOH, DARWISHS, BHATNAGAR, RS. Salivary
vis-cosity and lubrification: influence of pH and calci-um. Scand J Dent Res 1984; 92: 306-314. 2) RANC H, ELKHYATA, SERVAIS C, MAC-MARY S, LAUNAY
B, HUMPERTPH. Friction coefficient and wettability
of oral mucosal tissue: changes induced by a sali-vary layer. Colloids Surf A: Physiochem Eng As-pect 2006; 276: 155-161.
3) RANCH, SERVAISC, CHAUVYPF, DEBAUDS, MISCHLERS.
Effect of surface structure on frictional behaviour of a tongue/palate tribological system. Tribol Int 2006; 39: 1518-1526.
4) PRINZJF,DEWIJKRA, HUNTJENSL. Load dependency of the coefficient of friction of oral mucosa. Food Hydrocolloids 2007; 21: 402-408.
5) INOUEH, ONOK, MASUDAW, INAGAKIT, YOKOTAM, IN
-ENAGAK. Rheological properties of human saliva and
salivary mucins. J Oral Biosc 2008; 50: 134-141. 6) VEERMAN ECI, VALENTIJN-BENZ M, NIEUWAMERONGEN
AV. Viscosity of human salivary mucins: effect of
pH and ionic strength and role of sialic acid. J Biol Buccale 1989; 17: 297-306.
7) WATERMANHA, BLOM C, HOLTERMAN HJ, ’S-GRAVEN
-MADEEJ, MELLEMAJ. Rheological properties of
hu-man saliva. Arch Oral Biol 1988; 33: 589-596. 8) HIROTOMI T, YOSHIHARA A, OGAWAH, ITO K, IGARASHI
A, MIYAZAKIH. A preliminary study on the relation-ship between stimulated saliva and periodontal conditions in community-dwelling elderly people. J Dent 2006; 34: 692-698.
9) SCHIPPERRG, SILLETTI E, VINGERHOEDS MH. Saliva as
research material: biochemical, physiochemical and practical aspects. Arch Oral Biol 2007; 52: 1114-1135.
10) ROBERTSBJ. A study of the viscosity of saliva at
dif-ferent shear rates in dentate and edentulous pa-tients. J Dent 1977; 5: 303-309.
11) VISSINKA, WATERMANHA, ’S-GRAVENMADEEJ, PANDERS
AK, VERMEYA. Rheological properties of saliva
substitutes containing mucin, carboxymethylcellu-lose or polyethylenoxide. J Oral Pathol 1984; 13: 22-28.
12) VAN DERREIJDENWA, VEERMANECI, VANNIEUWAMERON -GENA. Rheological properties of commercially avail-able polysaccharides with potential use in saliva substitutes. Biorheology 1994; 31: 631-642.
13) RANTONENPJF, MEURMANJH. Viscosity of whole
sali-va. Acta Odontol Scand 1998; 56: 210-214. 14) PREETHA A, BANNERJEE R. Comparison of artificial
substitutes. Trends Biomater Artif Organs 2005; 18: 178-186.
15) PARK MS, CHUNG JW, KIM YK, CHUNGSC, KHO HS.
Viscosity and wettability of animal mucin solutions and human saliva. Oral Dis 2007; 13: 181-186. 16) MEHRAVARANN, MOGHIMI H, MORTAZAVI SA. The
In-fluence of various mucoadhesive polymers on in
vitro performance of the resulting artificial saliva pump spray formulations. Iranian J Pharm Res 2009; 8: 3-13.
17) SAJEWICZE. Effect of saliva viscosity on tribological behavior of tooth enamel. Tribol Int 2009; 42: 327-332.
18) FOGLIO-BONDA PL, MIGLIARIOM, ROCCHETTI V, PATTARI
-NOF, FOGLIO-BONDAA. Daily and annually variation
of unstimulated whole saliva flow rate and pH and their relation with body profile in healthy young adults. Eur Rev Med Pharmacol Sci 2013; 17: 2338-2345.
19) NAVAZESHM, MULLIGANRA, KIPNISV, DENNYPA, DEN
-NYPC. Comparison of whole saliva flow rates and
mucin concentrations in healthy Caucasian young and aged adults. J Dent Res 1992; 71: 1275-1278.
20) RICHARDSON CT, FELDMAN M. Salivary response to
food in humans and its effect on gastric acid se-cretion. Am J Physiol 1986; 250: 85-91.
21) COLEAS, EASTOEJE. Biochemestry and oral biology. 2nd ed. London. Wright, 1998; pp. 478-493. 22) SHIN S, KEUMDY. Viscosity measurement of
non-Newtonian fluid foods with a mass-detecting cap-illary viscometer J Food Eng 2003; 58: 5-10. 23) PARVINEN T. Flow rate, pH, and lactobacillus and
yeast counts of stimulated whole saliva in adults. Proc Finnish Dent Soc 1985; 81: 113-116. 24) FENOLL-PALOMARES C, MUNOZ-MONTAGUD JV, SANCHIZ
V, HERREROSB, HERNÀNDEZV, MÌNGUEZM, BENAGESA.
Unstimulated salivary flow rate, pH and buffer ca-pacity of saliva in healthy volunteers. Rev Esp En-ferm Dig 2004; 96: 773-783.
25) SRIVASTAVA N, BURNS MA. Analysis of non-Newton-ian liquids using a microfluidic capillary viscome-ter. Anal Chem 2006; 78:1690-1696.
26) BONGAERTSJHH, ROSSETTIAD, STOKESAJR. The
lubri-cating properties of human saliva. Tribol Lett 2007; 27: 277-287.
27) FU-LUNG L, DINTENFASS L. Effect of flow instability
(and of blood anti-instability properties) on viscos-ity of blood measured in rotational viscometer. Biorheology 1981; 18: 191-205.
28) SCHWARZWH. The rheology of saliva. J Dent Res
1987; 66: 660-666.
29) ZUSSMANE, YARINAL, NAGLERRM. Age- and flow-de-pendency of salivary viscoelasticity. J Dent Res 2007; 86: 281-285.