Direct observation of aqueous secondary organic
aerosol from biomass-burning emissions
Stefania Gilardonia,1, Paola Massolib, Marco Paglionea, Lara Giulianellia, Claudio Carbonea,2, Matteo Rinaldia, Stefano Decesaria, Silvia Sandrinia, Francesca Costabilec, Gian Paolo Gobbic, Maria Chiara Pietrogranded, Marco Visentind, Fabiana Scottoe, Sandro Fuzzia, and Maria Cristina Facchinia
aItalian National Research Council–Institute of Atmospheric Sciences and Climate, 40129 Bologna, Italy;bAerodyne Research Inc., Billerica, MA 01821;cItalian National Research Council–Institute of Atmospheric Sciences and Climate, 00133 Rome, Italy;dDepartment of Chemical and Pharmaceutical Sciences, University of Ferrara, 44121 Ferrara, Italy; andeAgenzia Regionale per la Prevenzione, l’Ambiente e L’Energia, 40139 Bologna, Italy
Edited by Barbara J. Finlayson-Pitts, University of California, Irvine, CA, and approved July 11, 2016 (received for review February 9, 2016) The mechanisms leading to the formation of secondary organic
aerosol (SOA) are an important subject of ongoing research for both air quality and climate. Recent laboratory experiments suggest that reactions taking place in the atmospheric liquid phase represent a potentially significant source of SOA mass. Here, we report direct ambient observations of SOA mass formation from processing of biomass-burning emissions in the aqueous phase. Aqueous SOA (aqSOA) formation is observed both in fog water and in wet aerosol. The aqSOA from biomass burning contributes to the“brown” carbon (BrC) budget and exhibits light absorption wavelength dependence close to the upper bound of the values observed in laboratory ex-periments for fresh and processed biomass-burning emissions. We estimate that the aqSOA from residential wood combustion can ac-count for up to 0.1–0.5 Tg of organic aerosol (OA) per y in Europe, equivalent to 4–20% of the total OA emissions. Our findings high-light the importance of aqSOA from anthropogenic emissions on air quality and climate.
particulate matter
|
air quality|
secondary organic aerosol|
biomass burning|
aqueous processingO
rganic aerosol (OA) is a dominant component ofatmo-spheric aerosol. Field observations indicate that processed, that is, secondary OA (SOA), dominates over primary OA world-wide (1–3). Bottom-up and top-down estimates confirm that SOA accounts for up to 76% of ambient OA (1, 4). However, the esti-mates of global SOA budget are still largely uncertain (1, 5).
An increasing number of experimental and modeling studies point toward aqueous-phase chemistry as a significant missing pathway for SOA formation (6–8). To date, most studies have investigated the formation of aqueous SOA (aqSOA) from nat-ural biogenic emissions (6–8). Nevertheless, anthropogenic emis-sions, such as wood burning for residential heating, can contribute to the formation of aqSOA, both in urban and rural areas. In fact, water-soluble organic species (WSOC) can account for more than 50% of wood-burning emissions (9–11). Monosac-charides, dicarboxylic acids, and phenols emitted during wood combustion can act as aqSOA precursors (12–15). A few studies investigated formation and properties of aqSOA from biomass combustion through laboratory photochemical oxidation of single compounds, such as levoglucosan and phenolic species (12, 13, 16–18). However, ambient observations of aqSOA formation in environments with high wood-burning emissions are very limited. Phenol oligomers, which are tracers of primary wood burning and aqueous-phase processing of wood-burning emissions, were observed in Fresno in Winter 2006, but con-centration and properties of the related aqSOA were not reported (16). The influence of aqueous-phase chemistry for SOA formation was suggested again in Fresno in Winter 2010 (19), but the oxidation level [oxygen-to-carbon ratio (O:C)] of the Fresno SOA was lower than expected, compared with the O:C of aqSOA formed from oxidation of wood-burning emis-sions in laboratory experiments (12–14, 16, 20).
To identify, quantify, and characterize aqSOA from biomass burning under real ambient conditions, we investigated the OA properties of ambient aerosol and fog water samples collected in the Po Valley (northern Italy) during the cold season, when the region is characterized by temperature below 10 °C, high relative humidity, and significant emissions from wood combustion from residential heating (21). We showed the usefulness of molecular tracer detection by on-line measurement techniques to track the formation of ambient aqSOA. We also infer that oxidation of biomass-burning emissions in wet aerosol is taking place mainly through the formation of hydroxyl/ether groups and oligomeri-zation reactions. Finally, we show that aqSOA originating from biomass-burning emissions are strong absorbers of UV and vis-ible light, thereby contributing to a positive direct forcing. Discussion
Ambient Observations of SOA Formed in the Aqueous Phase. The observations discussed here were obtained during two different field experiments. The first study was performed at the rural site of San Pietro Capofiume (SPC), near Bologna, in Fall 2011, whereas the second experiment took place at an urban back-ground site in Bologna during Winter 2013.
The Fall 2011 campaign at SPC (SPC2011) was characterized by several fog episodes. The evaporation of fog left behind particles enriched in oxidized OA. To study the specific effect of fog dissipation on OA properties, we focused on four dissipation
Significance
Organic aerosol (OA) is a dominant component of atmospheric aerosol worldwide, and it is recognized as a key factor affecting air quality and possibly climate. Observations indicate that more than one-half of the global OA is of secondary origin. Traditional models typically underpredict secondary organic aerosol (SOA) mass, suggesting that a complete knowledge of SOA formation mechanisms is lacking. We show that aqueous-phase processing of biomass-burning emissions contributes to SOA formation. Such aqueous SOA absorbs UV and visible light more efficiently that other OA components. Aqueous chemistry processing of biomass-burning emissions should be taken into account in air quality and climate models for a correct description of the global OA budget and its climate-relevant optical properties.
Author contributions: S.G., S.F., and M.C.F. designed research; S.G., M.P., L.G., C.C., M.R., S.D., S.S., M.C.P., M.V., and F.S. performed research; S.G., P.M., M.P., F.C., and G.P.G. analyzed data; and S.G., P.M., and M.P. wrote the paper.
The authors declare no conflict of interest. This article is a PNAS Direct Submission.
Freely available online through the PNAS open access option.
1To whom correspondence should be addressed. Email: [email protected]. 2Present address: Proambiente S.c.r.l., CNR Research Area, 40129 Bologna, Italy. This article contains supporting information online atwww.pnas.org/lookup/suppl/doi:10. 1073/pnas.1602212113/-/DCSupplemental. EARTH, ATMOSPHERIC, AND PLANETARY SCIENC ES
events that were not perturbed by transport of air masses from surrounding areas (Supporting Information,1. Identification of Radiative Fog Dissipation Events at San Pietro Capofiume
Dur-ing the 2011 StudyandTable S1). The OA was analyzed by the
Aerodyne (Aerodyne Research) high-resolution time-of-flight aerosol mass spectrometer (HR-ToF-AMS) (22). The campaign results have been reported in a previous work (23). In this study, the SOA mass spectrum for each fog event is obtained as the total OA minus the primary OA, as determined by positive matrix factorization (PMF) analysis; the spectrum of fog water samples is instead measured via off-line analysis (see Methods for details). The SOA spectra after fog dissipation are very similar to the OA spectrum in fog water (Fig. S1), with a Pearson correlation co-efficient (r) larger than 0.96 in all cases (and P< 0.001). This result indicates that the OA species observed in the aerosol particle phase after fog dissipation were originally present in fog water.
The field experiment performed in Bologna in Winter 2013 (Bologna2013) was characterized by temperatures below 10 °C, high relative humidity, and stagnant air. Although dense fog events did not occur in the urban setting, the ambient relative humidity was typically above 70%, favoring the presence of wet aerosol particles. Similar to SPC2011, we applied PMF analysis (24) on the HR-ToF-AMS data collected in Bologna2013, to deconvolve the total OA signal in various components (Supporting
Information,4. Positive Matrix Factorization Analysis,4.1. Positive
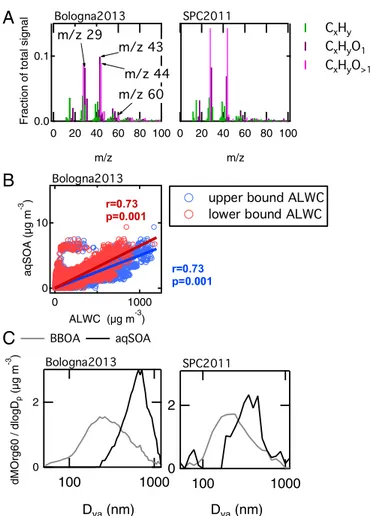
Matrix Factorization of HR-TOF-AMS OA Data During Bologna 2013). Among the different OA types, we identified an oxygenated organic aerosol (OOA) component originating from biomass burning that has mass spectral features similar to the SOA ob-served in SPC2011 after fog dissipation (correlation with r= 0.94 and P< 0.001), therefore suggesting influence of aqueous-phase processing. From now on, we refer to these SOAs as aqSOAs. The spectra of the aqSOA for SPC2011 and Bologna2013 are shown together in Fig. 1A, and they show characteristic signals at m/z 29 (CHO+), m/z 43 (C2H3O+), m/z 44 (CO2+), and m/z 60 (C2H4O2+). In the following paragraphs, we report a series of findings to sup-port our hypothesis that these SOAs are indeed aqSOAs.
The first evidence of aqSOA formation is given by the corre-lation of these SOA samples with a tracer of liquid phase chemistry, that is, the hydroxymethanesulfonate (HMS). HMS is formed from the complexation of sulfite and bisulfite with aque-ous formaldehyde (25–28). During both campaigns, HMS was detected by the HR-ToF-AMS and was also measured by proton NMR (H-NMR) (Methods andSupporting Information,2. Tracers
of Aqueous-Phase Chemistry and Fig. S2). For SPC2011, the
aqSOA concentration increased together with the HMS signal after fog dissipation (r= 0.77, P < 0.001). Because photochemistry prevents HMS formation, the correlation of HMS with aqSOA could not be justified by radiation increase during the first hours after sunrise, when fog dissipates. Instead, the data indicate that HMS and aqSOA were formed in the same environment, that is, in the aqueous phase, consistent with previous literature (8, 29). Good correlation (r= 0.68, P < 0.001) is found between aqSOA and HMS signal for Bologna2013 as well. In addition, Fig. 1B shows that aqSOA in Bologna correlates well (r= 0.73, P < 0.001) with the aerosol liquid water content (ALWC) estimated from particle composition (Methods), confirming that the aqueous phase was the formation medium for this OA.
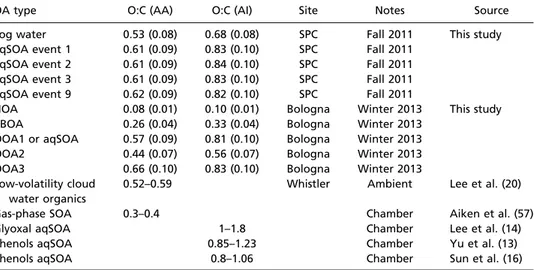
Second, we consider the elemental composition of the aqSOA (Table 1). The O:C ratios observed for the aqSOA in this study are around 0.61–0.62 as calculated with the Aiken ambient (AA) method (Table 1). The corresponding ambient improved (AI) O:C ratios (0.81–0.84) are similar to the AI O:C ratio of aqSOA obtained from laboratory oxidation of phenolic compounds (13, 16). Enhanced O:C ratios (AA O:C > 0.52) have also been reported for laboratory-generated SOA from the photooxidation of organic precursors in the aqueous phase (14, 20). Moreover, higher-than-usual O:C of SOA observed in various environments
at high relative humidity have been correctly modeled and explained solely by an aqueous-phase chemistry scheme (7).
Last, we consider the particle size distribution of the aqSOA. Fig. 1C shows the size distribution of the mass fragment at m/z 60 (C2H4O2+; exact mass, 60.0206), or Org60, a marker for biomass burning (30) and a component of aqSOA mass spectrum. During the Bologna2013 campaign (Fig. 1C, Left), the size distribution of Org60 for the aqSOA factor shows a median mass diameter above 700-nm Dva, consistently with aqueous-phase reaction products (31). Additional particle time-of-flight (pToF) size distributions for other aerosol species during Bologna2013 are reported inFig. S3. For SPC2011 (Fig. 1C, Right), the pToF size distributions of or-ganic and inoror-ganic chemical species are analyzed in a previous work (23). They are characterized by smaller mean diameters, due to efficient fog-scavenging occurring almost every night, preventing particle growth (23). Nevertheless, the Org60 for the biomass-burning OA (BBOA) and aqSOA factors behave consistently with what observed in Bologna2013, with the size distribution of the Org60 in aqSOA peaking at higher size (∼500-nm Dva) compared with the Org60 in BBOA (200-nm Dva).
Biomass-Burning Emissions as Precursors of the aqSOA.In both datasets, we observe the presence of the guaiacol dimer (C14H14O4+),
2 0 dMOrg60 / dlogD p (µg m -3 ) 100 1000 Dva (nm) 0.1 0.0
Fraction of total signal
100 80 60 40 20 0 m/z 100 80 60 40 20 0 m/z 2 0 100 1000 Dva (nm) 10 0 aqSOA (µg m -3 ) 1000 0 ALWC (µg m-3)
A
B
C
Fig. 1. Evidence of aqSOA formation. (A) Comparison of aqSOA mass spectra in Bologna2013 and in SPC2011; the spectra are highly correlated (r= 94, P < 0.001). Notably, the mass spectrum of the SPC2011 aqSOA has a much larger CO2+fraction than the spectrum of Bologna2013 aqSOA. (B) Scatter plot of aqSOA vs. the estimated aerosol liquid water content (ALWC) for Bologna2013 (upper and lower bounds). (C) Normalized size distribution of mass fragment m/z 60 (Org60) in BBOA-rich particles (i.e., samples with BBOA organic mass fraction larger than 70%) and in aqSOA-rich particles (i.e., samples with aqSOA organic mass fraction larger than 30%, and corrected for BBOA contribution).
detected by the HR-ToF-AMS at the exact mass 246.0887 (Fig. S4). The guaiacol dimer is a phenolic species directly emitted during lignin combustion, but it can also be formed in atmospheric liquid water through radical recombination of the guaiacol monomer (13, 16). Concentrations of other phenols and anhydrosugars measured by GC/MS (vanillin, vanillic acid, syringol, syringic acid, pyrogallol, and levoglucosan) that are typical tracers of wood combustion emissions (10) covary with the HR-ToF-AMS guaiacol dimer signal
(Fig. S4). The guaiacol dimer signal during the Bologna2013
ex-periment (Fig. 2A) correlates well with BBOA for aqSOA < 0.3μg·m−3(r= 0.95, significant at P < 0.001), indicating a dominant contribution of primary sources for the measured guaiacol dimer during part of the experiment (i.e., when ALWC was low and aqSOA formation was not observed). However, we observe that, when aqSOA concentration increases, the dimer signal increases by 40% on average, indicating that aqSOA is also contributing to the observed guaiacol dimer concentration. In SPC2011 (Fig. 2B), the guaiacol dimer signal correlates well both with BBOA (r= 0.96, P < 0.001) and with aqSOA after fog dissipation (r= 0.96, P < 0.001), suggesting that primary and secondary sources of the dimer were comparable (note that only the data collected after fog dissipation are reported here, to isolate the effects of fog processing on aqSOA formation).
We further stress the link between biomass burning and aqSOA using a schematic representation of biomass-burning aging based on specific mass spectrometry features previously used in litera-ture (32, 33). Fresh biomass-burning emissions (BBOA) show a high content of anhydrosugars, like levoglucosan, which are characterized by the aforementioned signal at m/z 60 (C2H4O2+)
(Figs. S5–S7). During atmospheric aging, the relative intensity of
anhydrosugar signal decreases due to degradation and oxidation reactions. At the same time, atmospheric aging leads to the in-crease of oxygenated moieties, which translates into the inin-crease of oxygenated fragments in the mass spectrum, the most intense of which is at m/z 44 (CO2+) (Figs. S5–S7). Fig. 2D shows that the spectral features of aqSOA are those typical of aged OA (large signal at m/z 44) but also indicate the presence of anhydrosugars (signal at m/z 60) above background levels, laying in the graph space that is typical of aged biomass-burning emissions. Overall,
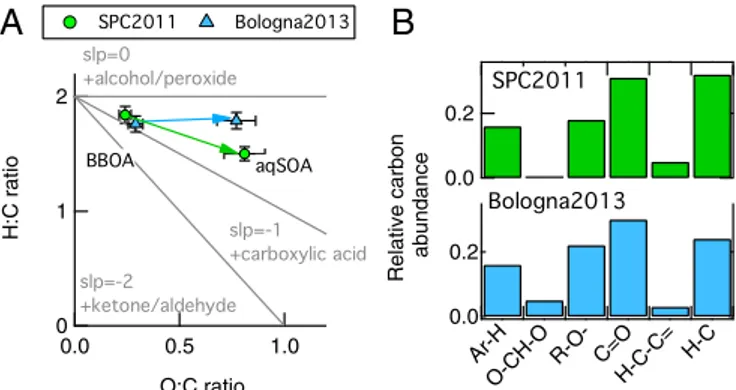
these results point to the fact that the observed aqSOA originate from the processing of biomass burning (BBOA) in both datasets. The evolution of the BBOA into aqSOA is further analyzed in Fig. 3 for both datasets. Fig. 3A shows the O:C and the hydrogen-to-carbon (H:C) values of the aqSOA and BBOA factors in the Van Krevelen (VK) diagram, which is typically used to investigate the OA evolution during field and laboratory experiments (34, 35). We plot the elemental ratios of the PMF factors to remove the effect of physical mixing between secondary and primary aerosols, allowing for a clearer and stronger interpretation of the results in the VK space. Aerosol aging has the overall effect of increasing O:C ratios. The “H:C vs. O:C” slope of zero in the VK plot is equivalent to the replacement of a hydrogen atom with a OH moiety, whereas a slope of−1 indicates the formation of carbox-ylic acid groups (34). The slope of the line that links BBOA to aqSOA for Bologna2013 is close to zero, whereas in SPC2011 the slope is about −0.5. The different slopes suggest that, during Bologna2013, where aerosol processing took place in aerosol water (i.e., wet aerosol), the increase in O:C ratio was mainly driven by oligomerization with hydroxyl group formation through dark chemistry (36). This is probably due to the fact that dark chemistry is favored in aerosol water compared with cloud and fog water, due to the higher concentration of solute, which reduces OH radical availability (8, 29). Conversely, the negative slope in SPC2011 indicates that oxidation through formation of carboxylic acid moieties was more important, in agreement with the domi-nant role of photochemical processes driven by OH radical in cloud and fog water (8).
Fig. 3B shows the organic functional group composition of the aqSOA obtained from H-NMR spectra (Supporting Information,
4. Positive Matrix Factorization Analysis, 4.2. Factor Analysis of
H-NMR Spectra, andFigs. S8andS9). Compared with SPC2011,
the aqSOA of Bologna2013 has a similar carbonyl and carboxylic group fraction (C=O), but a higher content of hydroxyl/ether groups (R–O–) and oxygen–carbon–oxygen moieties (–O–CH– O–), which are totally absent in SPC2011. In addition, the smaller contribution of C–H groups in the Bologna2013 aqSOA indicates a higher degree of molecular-chain ramification and functionalization. The H-NMR functional group analysis is therefore consistent with the hypothesis of higher relevance of
Table 1. O:C ratios of the aqSOA measured for SPC2011 and of the OA factors (including the aqSOA) for Bologna2013, together with literature values of laboratory aqSOA and cloud water samples
OA type O:C (AA) O:C (AI) Site Notes Source
Fog water 0.53 (0.08) 0.68 (0.08) SPC Fall 2011 This study aqSOA event 1 0.61 (0.09) 0.83 (0.10) SPC Fall 2011
aqSOA event 2 0.61 (0.09) 0.84 (0.10) SPC Fall 2011 aqSOA event 3 0.61 (0.09) 0.83 (0.10) SPC Fall 2011 aqSOA event 9 0.62 (0.09) 0.82 (0.10) SPC Fall 2011
HOA 0.08 (0.01) 0.10 (0.01) Bologna Winter 2013 This study BBOA 0.26 (0.04) 0.33 (0.04) Bologna Winter 2013
OOA1 or aqSOA 0.57 (0.09) 0.81 (0.10) Bologna Winter 2013 OOA2 0.44 (0.07) 0.56 (0.07) Bologna Winter 2013 OOA3 0.66 (0.10) 0.83 (0.10) Bologna Winter 2013 Low-volatility cloud
water organics
0.52–0.59 Whistler Ambient Lee et al. (20)
Gas-phase SOA 0.3–0.4 Chamber Aiken et al. (57)
Glyoxal aqSOA 1–1.8 Chamber Lee et al. (14)
Phenols aqSOA 0.85–1.23 Chamber Yu et al. (13)
Phenols aqSOA 0.8–1.06 Chamber Sun et al. (16)
The elemental ratios are estimated by the AMS organic mass spectra using the Aiken ambient (AA) (57), and the ambient improved (AI) (58) methods. Uncertainty is reported between brackets. The AA method is known to underestimate O:C, whereas the AI method reproduces the O:C ratio of complex organic mixture within 10%. However, because most of the literature studies use the AA method, we report the O:C ratios calculated using both the AA and the AI parameterizations.
EARTH, ATMOSPHERIC, AND PLANETARY SCIENC ES
oligomerization and dark chemistry processes promoting the formation of ethers and hydroxyl groups in the wet aerosol sampled during Bologna2013 (8, 29, 36).
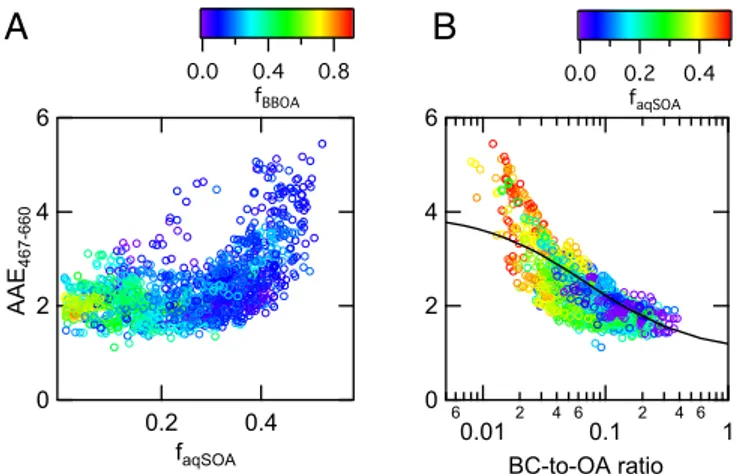
Atmospheric Implications.Part of the OA emitted during biomass combustion absorbs UV and visible light with a higher wavelength dependence than black carbon (BC). For this reason, the light-absorbing fraction of OA is known as“brown carbon” (BrC) (37). Here we show that the biomass-burning aqSOA contributes to the BrC budget and absorbs light more efficiently than fresh biomass-burning emissions. Fig. 4A shows that when the OA is dominated by fresh biomass burning and the contribution of aqSOA is neg-ligible, the absorption Ångström exponent (AAE) (i.e., the light absorption wavelength dependence) is close to 2, as expected from literature (38). When the fraction of the biomass-burning aqSOA becomes larger, the AAE increases, with values up to 5. This result agrees with measurements of optical properties of aqSOA produced in laboratory experiments from photooxidation and nitration of phenolic compounds (13, 17, 39). The large AAE indicates that this OA component absorbs radiation efficiently in the near-UV and vis-ible region, possibly contributing to a net positive radiative forcing.
Although it has been suggested that light-absorbing OA can at most contribute up to 10% of total aerosol solar light absorption
(40), many climate models still treat OA as purely scattering species, therefore underestimating their potential for light absorption. Some difficulties still exist in predicting OA absorption in general, and even more in the case of biomass-burning OA due to its complex nature (41, 42). However, recent laboratory results indicate that optical properties of biomass combustion aerosol can be successfully parameterized based on the BC-to-OA ratio (41). Fig. 4B shows such parameterization (black curve) applied to our ambient data. The similarity between ambient data and the parameterized curve is consistent with the limited contribution of fossil fuel combustion to the OA loading. In addition, our observations indicate enhanced absorption in the near-UV region associated with aqSOA forma-tion. At low BC-to-OA ratios, corresponding to more processed aerosol and higher aqSOA fraction, the observed AAE is larger (up to 50%) than what is observed in laboratory experiments of wood-burning emissions subjected to gas phase oxidation (41).
The aging of biomass-burning emissions in the aqueous phase impacts air quality as well. In Europe, combustion of biomass for residential heating has increased in recent years. One study at a rural site in northern Italy showed that SOA from biomass burning in winter accounts for 10% of organic carbon and 7% of fine par-ticle mass (43); in the urban area of Paris, processing of biomass-burning emissions accounted for up to 40% of the OA during an-other field study (44); similarly, in rural areas nearby London, aged biomass-burning emissions are a likely important contribution to the overall OA (45). This study highlights the relevance of aqueous-phase chemistry for processing of wood-burning emissions. The impacts on the European air quality are potentially relevant. In fact, several European areas, characterized by large wood-burning emis-sions for residential heating, experience humid weather and frequent fog events during the winter season (46). We assume that the ratio of aqSOA to elemental carbon (EC) from wood burning observed in the Po Basin (refs. 1–5 and this study) (Fig. S10) can be applied to a larger scale. Using the European budget of residential wood-burning EC emissions (about 0.1 Tg per y) (47), the upper bound of the biomass-burning aqSOA budget would range between 0.1 and 0.5 Tg of OA per y (Supporting Information,5. aqSOA Budget), equivalent to 4–20% of the estimated total primary OA emissions (48).
In conclusion, our ambient observations demonstrate that aqSOA originating from wood-burning emissions is a potentially important and unaccounted player in air quality budget and cli-mate forcing balance. Future studies are needed to better con-strain the chemical mechanisms responsible for aqSOA formation and to identify gas and particle-phase aqSOA precursors.
2 1 0 H:C ratio 1.0 0.5 0.0 O:C ratio 0.2 0.0 Relative carbon abundance Ar-H O-CH-O R-O- C=O H-C-C= H-C 0.2 0.0
A
B
Fig. 3. aqSOA chemical properties. (A) Van Krevelen (VK) diagram of the BBOA and aqSOA PMF factors obtained from the HR-ToF-AMS data analysis for both SPC2011 (green) and Bologna2013 (light blue). The line connecting BBOA and aqSOA has a close to zero for Bologna2013 and−0.5 for SPC2011, indicating different chemistry processing leading to aqSOA formation in the two environments. (B) Organic functional group composition of the aqSOA factors identified by PMF analysis of H-NMR spectra in SPC2011(green) and Bologna2013 (light blue).
0.2 0.1 0.0 Normalized m/z 44 signal 0.04 0.02 0.00 Normalized m/z 60 signal Aged BBOA Fresh BBOA no BB influence
Ageing of biomass burning emissions Decrease of anydrosugars Increase of oxigenated OA 0.2 0.1 0.0 0.04 0.02 0.00 Normalized m/z 60 signal BBOA aqSOA Bologna2013 SPC2011 This study 2x10⁻³ 0 C14 H14 O4 signal (a.u.) 15 10 5 0 BBOA (µg m-3) Bologna2013 10 5 0 aqSOA (µg m-3) slope=1.5 10-4 low aqSOA slope=2.1 10-4 high aqSOA 2x10⁻³ 0 8 6 4 2 0 BBOA (µg m-3) SPC2011 10 5 0 aqSOA (µg m-3) slope=2.2 10-4
A
B
C
D
Fig. 2. Influence of biomass-burning emissions on aqSOA formation. (A and B) Scatter plots of the guaiacol dimer signal (C14H14O4) vs. the BBOA loadings (in micrograms per cubic meter) color-coded as a function of aqSOA concen-tration in Bologna2013 and SPC2011. For the Bologna2013 dataset, the two slopes correspond to high (>4 μg·m−3) and low (<0.3 μg·m−3) aqSOA concen-tration; for the SPC 2011 dataset, only the data after fog dissipation are reported. (C) Schematic representation of aging of wood-burning emissions as observed in laboratory and field experiments using HR-ToF-AMS parameters, that is, normalized mass spectrum signal at m/z 44 (f44), which is a proxy of OA oxygenation degree, and normalized mass spectrum signal at m/z 60 (f60), which is a proxy of anhydrosugar content. The gray shaded area corresponds to f60 lower than 0.003 and indicates no influence of biomass burning (33). (D) BBOA and aqSOA factors corresponding to Bologna2013 (light blue tri-angles) and SPC2011 (light green circles) in the f44 vs. f60 space.
Methods
The chemical and microphysical properties of submicron aerosol particles were investigated in San Pietro Capofiume (44°39′15″ latitude, 11°37′29″ longitude), a rural site located at 30 km northeast of Bologna (Italy), and in an urban background site in Bologna (44°31′29″ latitude, 11°20′27″ longitude) in the framework of the Agenzia Regionale per la Prevenzione, l’Ambiente e l’Energia (ARPAE) Emilia Romagna Supersite project. Field experiments in SPC started on November 15 and ended on December 1, 2011 (23). The experi-ment in Bologna started on January 29 and ended on February 22, 2013. OA Measurements. The chemical composition of atmospheric aerosol particles were characterized on-line with a HR-ToF-AMS (Aerodyne Research) (22). We report data collected using the V-ion mode, which had a resolution of 2,200 during both campaigns. Aerosol particles were dried below 30% relative hu-midity with a Nafion drier. OA components were identified by PMF analysis of HR-ToF-AMS organic mass spectra (24). Details of PMF analysis of HR-ToF-AMS data for the SPC2011 campaign are reported elsewhere (23), whereas the re-sults of PMF analysis on HR-ToF-AMS data during Bologna2013 are reported in
Supporting Information,4. Positive Matrix Factorization Analysis,4.1. Positive Matrix Factorization of HR-TOF-AMS OA Data During Bologna 2013.
Submicron particles were sampled for off-line analysis by H-NMR (49). Particles were collected on prewashed and prebaked quartz fiber filters (Pall; 9-cm diameter) by a dichotomous sampler at a constant nominal flow of 300 L·min−1. We collected two samples each day, one from 9:00 AM to 5:00 PM local time (LT) and one from 5:00 PM to 9:00 AM LT. Filters were stored at 4 °C before analysis. OA components were identified by PMF analysis of H-NMR organic spectra. Details of PMF analysis of H-NMR data on both the SPC2011 and Bologna2013 datasets are reported in
Supporting Information, 4. Positive Matrix Factorization Analysis,4.2. Factor Analysis of H-NMR Spectra, andFig. S9.
Polar organic compounds (vanillin, vanillic acid, syringol, syringic acid, and pyrogallol) were quantified using off-line GC/MS analysis (50).
Determination of aqSOA from the HR-ToF-AMS Datasets. The mass spectrum of OA dissolved in fog water for the SPC2011 dataset was measured by HR-ToF-AMS analysis of reaerosolized fog water samples. To make sure that the reaerosolized fog water was representative of the original
sample, we verified that the nitrate-to-organic and the sulfate-to-organic ratios from HR-ToF-AMS analysis were within 20% (measurement un-certainty level) of the ratios measured by ion chromatography and thermal analysis.
At SPC, the strong modulation of OA properties caused by fog made it difficult to isolate more than one oxidized OA component. To better define the aqSOA in the SPC2011 HR-ToF-AMS data, we removed from the total OA matrix the contribution of the primary OA components [hydrocarbon-like organic aerosol (HOA) and BBOA] as determined by PMF analysis (23). The residual OA mass spectra (identified as aqSOA) was calculated using Eq. 1 as follows (19): aqSOA= ORG − ðtsHOA × msHOAÞ − ðtsBBOA × msBBOAÞ, [1] where ORG is the organic mass spectra matrix from AMS analysis, tsHOA and tsBBOA are the time series of the HOA and BBOA factors, whereas msHOA and msBBOA are their mass spectra.
The aqSOA in the Bologna2013 dataset was identified via PMF analysis of the OA HR-ToF-AMS measurements (Supporting Information, 4. Positive Matrix Factorization Analysis,4.1. Positive Matrix Factorization of HR-TOF-AMS OA Data During Bologna 2013). PMF identified a hydrocarbon-like component (HOA) related to urban traffic, BBOA, and three OOA compo-nents (Fig. S5). One of the OOAs was identified as aqSOA as described in
Supporting Information,4. Positive Matrix Factorization Analysis,4.1. Posi-tive Matrix Factorization of HR-TOF-AMS OA Data During Bologna 2013. ALWC Estimates. Lower and upper bounds of ALWC were estimated using the extended aerosol inorganic module (E-AIM–module 4) (51). The model cal-culates the content of water in liquid phase based on inorganic ions and OA concentration. The molar concentrations of organic and inorganic species measured with the HR-ToF-AMS were used as input variables. Particles were assumed to be neutral. This assumption is supported by the observation that during the SPC2011 experiment, the mean pH of fog water samples was 6.8. Overall, long-term, continuous measurements at SPC have shown a pro-gressive decrease of fog water acidity over the last 20 y, with values approaching neutrality during the last few years (52). Due to the limited knowledge of the OA molecular composition, we estimated the lower bound of ALWC by neglecting the contribution of OA, and the upper bound by assuming OA properties equivalent to those of oxalic acid [a highly hy-groscopic OA component with k-Kohler equal to 0.48 (53)]. The lower and upper bound of ALWC differ on average by 25%.
Aerosol Optical Property Measurements. During Bologna2013, the spectral optical properties of the ambient aerosol in the visible range were measured on-line (54). The dry aerosol absorption coefficientσawas measured by a three-wavelength particle soot absorption photometer (PSAP) (Radiance Research) at 467, 530, and 660 nm. Raw PSAP data were corrected according to previous work (55). The procedure requires wavelength-resolved scat-tering coefficient (σs), which was extrapolated from measurements of the dry aerosol σs at 450, 525, and 635 nm, performed by an integrating nephelometer (Ecotech; mod.Aurora 3000). All measurements with σa < 1 Mm−1,σs< 10 Mm−1were eliminated to reduce experimental errors. Data affected by dust presence were discarded based on scattering and absorption properties (56). These instruments were set up on the same inlet system as the HR-ToF-AMS. External air was pumped in the cabin into a stainless-steel tube (length, 4.0 m) by an external pump ensuring a laminar flow (Reynolds number,<2,000). The cabin was conditioned at 20– 25 °C to dry sample air based on the difference between air temperature and dew point.
ACKNOWLEDGMENTS. We acknowledge V. Poluzzi for coordinating the “Supersito” project, L. Tarozzi for his contribution to fog and aerosol sam-pling activity, ARPAE Emilia Romagna for providing the meteorological data and EC observations, and M. R. Canagaratna for supporting the PMF analysis. This research was funded by Regione Emilia Romagna as part of the “Super-sito” project (Decreto Regionale 428/10).
1. Hallquist M, et al. (2009) The formation, properties and impact of secondary organic aerosol: Current and emerging issues. Atmos Chem Phys 9(14):5155–5236. 2. Crippa M, et al. (2014) Organic aerosol components derived from 25 AMS data sets
across Europe using a consistent ME-2 based source apportionment approach. Atmos Chem Phys 14(12):6159–6176.
3. Zhang Q, et al. (2007) Ubiquity and dominance of oxygenated species in organic aerosols in anthropogenically-influenced Northern Hemisphere midlatitudes. Geophys Res Lett 34(13):L13801.
4. Bond T, et al. (2013) Bounding the role of black carbon in the climate system: A sci-entific assessment. J Geophys Res Atmos 118(11):5380–5552.
5. Goldstein AH, Galbally IE (2007) Known and unknown organic constituents in the Earth’ s atmosphere. Environ Sci Technol 41(5):1514–1521.
6. Carlton AG, et al. (2008) CMAQ model performance enhanced when in-cloud sec-ondary organic aerosol is included: Comparisons of organic carbon predictions with measurements. Environ Sci Technol 42(23):8798–8802.
7. Ervens B, Turpin B, Weber R (2011) Secondary organic aerosol formation in cloud droplets and aqueous particles (aqSOA): A review of laboratory, field and model studies. Atmos Chem Phys 11(21):11069–11102.
8. McNeill VF (2015) Aqueous organic chemistry in the atmosphere: Sources and chemical processing of organic aerosols. Environ Sci Technol 49(3):1237–1244.
6 4 2 0 6 0.012 4 60.1 2 4 6 1 BC-to-OA ratio 6 4 2 0 AAE 467-660 0.4 0.2 faqSOA
A
B
Fig. 4. aqSOA optical properties. Light absorption wavelength dependence as a function of aqSOA biomass-burning mass fraction (faqSOA= aqSOA/OA) (A) and of the BC–OA ratio (B). The black line in B is the AAE fitting curve describing optical properties of fresh and aged biomass-burning aerosol (33). Markers are color-coded as a function of primary biomass-burning organic mass fraction (fBBOA= BBOA/OA) (A) and aqSOA organic mass fraction (B). The optical data are available only for the Bologna2013 dataset.
EARTH, ATMOSPHERIC, AND PLANETARY SCIENC ES
9. Mazzoleni LR, Zielinska B, Moosmüller H (2007) Emissions of levoglucosan, methoxy phenols, and organic acids from prescribed burns, laboratory combustion of wildland fuels, and residential wood combustion. Environ Sci Technol 41(7):2115–2122. 10. Schauer JJ, Kleeman MJ, Cass GR, Simoneit BRT (2001) Measurement of emissions
from air pollution sources. 3. C1-C29 organic compounds from fireplace combustion of wood. Environ Sci Technol 35(9):1716–1728.
11. Iinuma Y, et al. (2007) Source characterization of biomass burning particles: The combustion of selected European conifers, African hardwood, savanna grass, and German and Indonesian peat. J Geophys Res Atmos 112(D8):D08209.
12. Zhao R, Mungall EL, Lee AKY, Aljawhary D, Abbatt JPD (2014) Aqueous-phase pho-tooxidation of levoglucosan—a mechanistic study using aerosol time-of-flight chemical ionization mass spectrometry (aerosol ToF-CIMS). Atmos Chem Phys 14(18): 9695–9706.
13. Yu L, et al. (2014) Chemical characterization of SOA formed from aqueous-phase reactions of phenols with the triplet excited state of carbonyl and hydroxyl radical. Atmos Chem Phys 14(24):13801–13816.
14. Lee AKY, Herckes P, Leaitch WR, Macdonald AM, Abbatt JPD (2011) Aqueous OH oxidation of ambient organic aerosol and cloud water organics: Formation of highly oxidized products. Geophys Res Lett 38(11):L11805.
15. Yu L, et al. (2016) Molecular transformations of phenolic SOA during photochemical aging in the aqueous phase: Competition among oligomerization, functionalization, and fragmentation. Atmos Chem Phys 16(7):4511–4527.
16. Sun YL, Zhang Q, Anastasio C, Sun J (2010) Insights into secondary organic aerosol formed via aqueous-phase reactions of phenolic compounds based on high resolution mass spectrometry. Atmos Chem Phys 10(10):4809–4822.
17. Kitanovski Z, Cusak A, Grgic I, Claeys M (2014) Chemical characterization of the main products formed through aqueous-phase photonitration of guaiacol. Atmos Meas Tech 7(8):2457–2470.
18. Li YJ, Huang DD, Cheung HY, Lee AKY, Chan CK (2014) Aqueous-phase photo-chemical oxidation and direct photolysis of vanillin—a model compound of methoxy phenols from biomass burning. Atmos Chem Phys 14(6):2871–2885.
19. Ge X, Zhang Q, Sun Y, Ruehl CR, Setyan A (2012) Effect of aqueous-phase processing on aerosol chemistry and size distributions in Fresno, California, during wintertime. Environ Chem 9(3):221–235.
20. Lee AKY, et al. (2012) Characterization of aerosol and cloud water at a mountain site during WACS 2010: Secondary organic aerosol formation through oxidative cloud processing. Atmos Chem Phys 12(15):7103–7116.
21. Caserini S, et al. (2013) A methodology for elemental and organic carbon emission inventory and results for Lombardy region, Italy. Sci Total Environ 450-451:22–30. 22. DeCarlo PF, et al. (2006) Field-deployable, high-resolution, time-of-flight aerosol mass
spectrometer. Anal Chem 78(24):8281–8289.
23. Gilardoni S, et al. (2014) Fog scavenging of organic and inorganic aerosol in the Po Valley. Atmos Chem Phys 14(13):6967–6981.
24. Zhang Q, et al. (2011) Understanding atmospheric organic aerosols via factor analysis of aerosol mass spectrometry: A review. Anal Bioanal Chem 401(10):3045–3067. 25. Whiteaker JR, Prather KA (2003) Hydroxymethanesulfonate as a tracer for fog
pro-cessing of individual aerosol particles. Atmos Environ 37(8):1033–1043.
26. Facchini MC, et al. (1992) The chemistry of sulfur and nitrogen species in a fog system—a multiphase approach. Tellus B Chem Phys Meterol 44(5):505–521.
27. Munger JW, Tiller C, Hoffmann MR (1986) Identification of hydroxymethanesulfonate in fog water. Science 231(4735):247–249.
28. Kok GL, Gitlin SN, Lazrus AL (1986) Kinetics of the formation and decomposition of hydroxymethanesulfonate. J Geophys Res Atmos 91(D2):2801–2804.
29. Ervens B, Sorooshian A, Lim YB, Turpin BJ (2014) Key parameters controlling OH-initiated formation of secondary organic aerosol in the aqueous phase (aqSOA). J Geophys Res Atmos 119(7):3997–4016.
30. Alfarra MR, et al. (2007) Identification of the mass spectral signature of organic aerosols from wood burning emissions. Environ Sci Technol 41(16):5770–5777. 31. John W, Wall SM, Ondo JL, Winklmayr W (1990) Modes in the size distribution of
atmospheric inorganic aerosol. Atmos Environ 24(9):2349–2359.
32. Ortega AM, et al. (2013) Secondary organic aerosol formation and primary organic aerosol oxidation from biomass-burning smoke in a flow reactor during FLAME-3. Atmos Chem Phys 13(22):11551–11571.
33. Cubison MJ, et al. (2011) Effects of aging on organic aerosol from open biomass burning smoke in aircraft and laboratory studies. Atmos Chem Phys 11(23): 12049–12064.
34. Heald CL, et al. (2010) A simplified description of the evolution of organic aerosol composition in the atmosphere. Geophys Res Lett 37(8):L08803.
35. Ng NL, et al. (2011) Changes in organic aerosol composition with aging inferred from aerosol mass spectra. Atmos Chem Phys 11(13):6465–6474.
36. Lim YB, Tan Y, Perri MJ, Seitzinger SP, Turpin BJ (2010) Aqueous chemistry and its role in secondary organic aerosol (SOA) formation. Atmos Chem Phys 10(21):10521–10539. 37. Kirchstetter T, Novakov T, Hobbs P (2004) Evidence that the spectral dependence of light absorption by aerosols is affected by organic carbon. J Geophys Res Atmos 109 (D21):D21208.
38. Russell PB, et al. (2010) Absorption Ångström exponent in AERONET and related data as an indicator of aerosol composition. Atmos Chem Phys 10(3):1155–1169.
39. Lambe AT, et al. (2013) Relationship between oxidation level and optical properties of secondary organic aerosol. Environ Sci Technol 47(12):6349–6357.
40. Kirillova EN, et al. (2014) Water-soluble organic carbon aerosols during a full New Delhi winter: Isotope-based source apportionment and optical properties. J Geophys Res Atmos 119(6):3476–3485.
41. Saleh R, et al. (2014) Brownness of organics in aerosols from biomass burning linked to their black carbon content. Nat Geosci 7(9):647–650.
42. Lu Z, et al. (2015) Light absorption properties and radiative effects of primary organic aerosol emissions. Environ Sci Technol 49(8):4868–4877.
43. Gilardoni S, et al. (2011) Better constraints on sources of carbonaceous aerosols using a combined C-14–macro tracer analysis in a European rural background site. Atmos Chem Phys 11(12):5685–5700.
44. Crippa M, et al. (2013) Wintertime aerosol chemical composition and source appor-tionment of the organic fraction in the metropolitan area of Paris. Atmos Chem Phys 13(2):961–981.
45. Crilley LR, et al. (2015) Sources and contributions of wood smoke during winter in London: Assessing local and regional influences. Atmos Chem Phys 15(6):3149–3171. 46. Cermak J, Eastman RM, Bendix J, Warren SG (2009) European climatology of fog and low stratus based on geostationary satellite observations. Q J R Meteorol Soc 135(645):2125–2130.
47. Genberg J, et al. (2013) Light-absorbing carbon in Europe—measurement and mod-elling, with a focus on residential wood combustion emissions. Atmos Chem Phys 13(17):8719–8738.
48. Denier van der Gon H, et al. (2015) Particulate emissions from residential wood combustion in Europe—revised estimates and an evaluation. Atmos Chem Phys 15(11):6503–6519.
49. Decesari S, et al. (2006) Characterization of the organic composition of aerosols from Rondonia, Brazil, during the LBA-SMOCC 2002 experiment and its representation through model compounds. Atmos Chem Phys 6(2):375–402.
50. Pietrogrande MC, Bacco D, Visentin M, Ferrari S, Casali P (2014) Polar organic marker compounds in atmospheric aerosol in the Po Valley during the Supersito campaigns— Part 2: Seasonal variations of sugars. Atmos Environ 97:215–225.
51. Friese E, Ebel A (2010) Temperature dependent thermodynamic model of the system H+-NH4+-Na+-SO42−-NO3−-Cl−-H2O. J Phys Chem A 114(43):11595–11631.
52. Giulianelli L, et al. (2014) Fog occurrence and chemical composition in the Po valley over the last twenty years. Atmos Environ 98:394–401.
53. Kreidenweis SM, Petters MD, DeMott PJ (2008) Single-parameter estimates of aerosol water content. Environ Res Lett 3(3):035002.
54. Costabile F, et al. (2016) Characteristics of an aged organic“brown” aerosol in the urban Po Valley atmosphere. Atmos Chem Phys Discuss, 10.5194/acp-2015-1062. 55. Virkkula A (2010) Correction of the calibration of the 3-wavelength particle soot
absorption photometer (3 PSAP). Aerosol Sci Technol 44(8):706–712.
56. Costabile F, Barnaba F, Angelini F, Gobbi GP (2013) Identification of key aerosol populations through their size and composition resolved spectral scattering and ab-sorption. Atmos Chem Phys 13(5):2455–2470.
57. Aiken AC, et al. (2008) O/C and OM/OC ratios of primary, secondary, and ambient organic aerosols with high-resolution time-of-flight aerosol mass spectrometry. Environ Sci Technol 42(12):4478–4485.
58. Canagaratna MR, et al. (2015) Elemental ratio measurements of organic compounds using aerosol mass spectrometry: Characterization, improved calibration, and impli-cations. Atmos Chem Phys 15(1):253–272.
59. Suzuki Y, Kawakami M, Akasaka K (2001) 1H NMR application for characterizing water-soluble organic compounds in urban atmospheric particles. Environ Sci Technol 35(13):2656–2664.
60. Canagaratna MR, et al. (2007) Chemical and microphysical characterization of am-bient aerosols with the aerodyne aerosol mass spectrometer. Mass Spectrom Rev 26(2):185–222.
61. Meng ZY, Seinfeld JH (1994) On the source of the submicrometer droplet mode of urban and regional aerosols. Aerosol Sci Technol 20(3):253–265.
62. Decesari S, et al. (2011) Primary and secondary marine organic aerosols over the North Atlantic Ocean during the MAP experiment. J Geophys Res Atmos 116(D22):D22210. 63. Finessi E, et al. (2012) Determination of the biogenic secondary organic aerosol fraction in the boreal forest by NMR spectroscopy. Atmos Chem Phys 12(2):941–959. 64. Paglione M, et al. (2014) Identification of humic-like substances (HULIS) in oxygenated organic aerosols using NMR and AMS factor analyses and liquid chromatographic techniques. Atmos Chem Phys 14(1):25–45.
65. Lin C-J (2007) Projected gradient methods for nonnegative matrix factorization. Neural Comput 19(10):2756–2779.
66. Tauler R (1995) Multivariate curve resolution applied to second order data. Chemom Intell Lab Syst 30(1):133–146.
67. Jaumot J, Gargallo R, de Juan A, Tauler R (2005) A graphical user-friendly interface for MCR-ALS: A new tool for multivariate curve resolution in MATLAB. Chemom Intell Lab Syst 76(1):101–110.
68. Paglione M, et al. (2014) Primary and secondary biomass burning aerosols de-termined by proton nuclear magnetic resonance (H-1-NMR) spectroscopy during the 2008 EUCAARI campaign in the Po Valley (Italy). Atmos Chem Phys 14(10): 5089–5110.