2
3
Ringraziamenti
A conclusione di questi tre anni di dottorato sono molte le persone che mi hanno permesso
di realizzare questa tesi ai quali devo i miei ringraziamenti.
Un ringraziamento al Direttore dell’Istituto di Biologia Agroambientale e Forestale
IBAF-CNR di Porano Dr. Angelo Massacci ed al Direttore del Dipartimento Scienze del
Sistema Terra e Tecnologie per l'ambiente Dr. Enrico Brugnoli, per avermi ancora ospitato
e concesso la possibilità di svolgere la tesi presso questo Istituto.
Quindi un profondo ringraziamento al mio tutor, Dr. Carlo Calfapietra per avermi dato
questa occasione, inserendomi nel suo gruppo di ricerca all’interno del Progetto PON
I-AMICA. Grazie per avermi seguito, incoraggiandomi e permettendomi di fare tante
esperienze così da superare i miei limiti, diventare autonoma e valorizzare le mie capacità.
Ringrazio tutte le persone coinvolte nel Progetto PON I-AMICA che mi hanno aiutato in
questo percorso, ed in particolare la Dott.ssa Angela Augusti e la Dott.ssa Claudia
Roberta Calidonna che mi hanno seguito nei corsi di formazione. Ringrazio il co-tutor
della tesi Dr. Giorgio Matteucci per le revisioni ed i consigli, ed il correlatore Prof. Paolo
de Angelis per aver sempre prontamente risposto con grande gentilezza ad ogni mio
dubbio. Grazie alla Dott.ssa Chiara Mattia ed al Parco Nazionale dell’Alta Murgia per
averci ospitato ed accompagnato per i campionamenti.
4
Ringrazio tutti i colleghi del gruppo “Calfa Lab”, in particolare Gabriele Guidolotti per il
lavoro e le missioni svolte insieme, ed Emanuele Pallozzi e Raffaela Esposito a cui va il
più grande ringraziamento per essere stati dei colleghi meravigliosi come mai avrei potuto
immaginare, ma sopratutto per essere dei veri amici! Il vostro sostegno, sia tecnico, sia
emotivo è stato fondamentale per me. Non ci sono parole adatte ad esprimere quanto vi
sono grata per questi tre anni di vita passati tutti i giorni insieme! Grazie Ema per la tua
infinita pazienza, competenza e disponibilità senza le quali questa tesi non esisterebbe, e
Raffa grazie per essermi stata costantemente vicina ed avermi ascoltato e compreso con
una straordinaria sensibilità in ogni momento. Grazie a voi ho vissuto questi anni con il
sorriso, senza mai sentirmi sola. Avete reso questa esperienza unica! Voglio anche
ringraziare Mauro Medori per avermi trasmesso con grandissima disponibilità e simpatia
tutto ciò che aveva imparato nel suo percorso. Un sincero e affettuoso ringraziamento
anche al Dr. Paolo Ciccioli, per i suoi fondamentali insegnamenti che mi hanno permesso
di condurre gli esperimenti ed elaborare i dati al meglio. Ringrazio ancora di cuore tutti i
tecnici dell’Istituto, Marcello Cherubini, Michele Mattioni e Giovanni de Simoni, che
sono stati sempre pronti ad aiutarmi, il loro supporto per la messa in funzione della
camera di combustione è stato fondamentale. Ringrazio tutte le ricercatrici del mio
precedente gruppo, Claudia Mattioni, Paola Pollegioni, Francesca Chiocchini sempre
presenti e gentili per ascoltarmi e consigliarmi, ma soprattutto grazie per coinvolgermi
ancora adesso nelle loro pubblicazioni per le quali ho dato il mio piccolo contributo con la
5
tesi di laurea. Un ringraziamento anche a tutte le altre persone che fanno parte
dell’istituto IBAF di Porano e di Montelibretti per essere stati sempre cordiali e
disponibili.
Ringrazio infine tutte le persone che fanno parte della mia vita: i miei genitori e mia
nonna, ai quali va un immenso grazie per i sacrifici che hanno continuato a fare per
permettermi di continuare le attività presso questo Istituto, è soprattutto grazie a loro
che adesso raggiungo questo nuovo traguardo.
Un grazie di cuore all’incrollabile gruppo de “laGita” Giulia L., Angy, Vale, Elia, Paolo
B., Alessio, Davide, Matteo C., Niccolò, Simona, Giulia N., Paolo F., Matteo V., Vally,
Cami; i miei più cari amici di sempre, ed in ultimo grazie al mio ragazzo, per aver
camminato con me dall’inizio alla fine, per essermi stato sempre vicino, incoraggiandomi
con pazienza e amore, nonostante tutte le avversità. Ed un grazie di esistere all’altra
anima mia, Febino!
6
.Abstract
Vegetation fires, such as savanna and forest fires, domestic fuels and agricultural wastes burnings, are a significant source of gases as carbon dioxide (CO2), carbon monoxide (CO), methane (CH4),
nitrous oxide (NO) and volatile organic compounds (VOC) that are annually released into the atmosphere and could affect the atmospheric chemistry through the “greenhouse” effect and the photochemical ozone formation . Biomass burning also exacerbates atmospheric particulate matter loadings, releasing primary fine carbonaceous particle. This in turn leads to significant health implications, particularly for the respirable fraction (fine particles less than 2.5 µm in diameter) and impact on the Earth’s radiative budget. Furthermore, the fine particles increase the cloud albedo partly and, by acting as cloud condensation nuclei, they could modify the rainfall regimes. It is presented so a general overview about volatile organic compounds, their interactions with the atmosphere and the general aspects about biomass burning. Then we demonstrate the performance of a recently developed combustion chamber, showing its capability in estimating the emission from wildland fire through a case study with dried leaf litter of Quercus robur. The combustion chamber was equipped with a thermocouple, a high resolution balance, an epiradiometer, two different sampling lines to collect volatile organic compounds (VOCs) and particles, a portable analyzer to measure carbon monoxide (CO) and carbon dioxide (CO2) emission and a methane
(CH4) analyzer. VOCs were determined by gas chromatography–mass spectrometry (GC-MS)
after enrichment on adsorption traps, but also monitored on-line with a proton-transfer-reaction
mass spectrometer (PTR-MS). Preliminary qualitative analyses of emissions from burning dried
leaf litter of Q. robur found CO2 and CO as the main gaseous species emitted during the flaming
and smoldering stages, respectively. Aromatic VOCs, such as benzene and toluene, were detected together with several oxygenated VOCs, like acetaldehyde and methanol.
7 Biomass burning is an important ecological factor in the Mediterranean ecosystem where wildfires are very frequent and the predicted future of possible increase of fires could modify drastically the vegetation scenarios. The gaseous and particulate emissions from the combustion of three different plant tissues (leaves, woody branches and litter) of two tree species (Pinus halepensis and Quercus pubescens) are reported. These species are very common across the Mediterranean area and often subject to wildfires. Experiments were carried out in the combustion chamber previously described. The percentages and the trends of gaseous emissions during the different stages of burning (pre-ignition, flaming and smoldering) were reported. We identified and quantified 83 volatile organic compounds (VOCS) including important carcinogenic species that
can affect the human health. The CO and CO2 confirmed again as the main gaseous species
emitted, benzene and toluene were the dominant aromatic hydrocarbons, methyl vinyl ketone and methyl ethyl ketone were the most abundant measured OVOCs. CO2 and CH4 emissions showed
the peak of emissions during the flaming phase, while the peak of CO emission occurred during smoldering phase. In general the combustion of leaves released in the atmosphere a greater quantity of VOCs than the combustion of woody branches and litter. There are little differences between the emissions from the combustion of the two tree species, except for some compounds. The combustion of P. halepensis released a great amount of monoterpenes as α-pinene, β-pinene, β-cymene, sabinene, Δ3
-carene, terpinolene, camphene that are not emitted from the combustion of Q. pubescens. The combustion of woody branches showed the highest duration of flaming and peak of heat. Moreover, the carbon budget emitted during the biomass combustion was obtained. Data presented in this thesis reveal the favorability of using a combustion chamber to better understand how different typologies of biomass can affect wildfires and the speciation profile of their emission. Furthermore, these data describe in detail the phases occurring during biomass combustion that could be crucial for modeling assessments.
8
Riassunto
Ogni anno una grande quantità di composti gassosi come anidride carbonica (CO2), monossido di
carbonio (CO), metano (CH4), monossido di azoto (NO), ed altri composti organici volatili
(VOCs) sono immessi in atmosfera durante la combustione di biomassa vegetale e possono influenzarne la chimica attraverso l’effetto “serra” e la formazione fotochimica dell’ozono. La combustione di biomassa, rilasciando in aria grandi quantità di piccole particelle carboniose, contribuisce ad aumentare la quantità totale di particolato in atmosfera. Ciò può avere importanti conseguenze sulla salute umana, soprattutto per quanto riguarda la frazione di particolato respirabile (particelle di diametro inferiori a 2.5 µm), e può avere un impatto molto significativo sul budget radiativo della Terra. Inoltre, le piccole particelle carboniose aumentano l’effetto albedo ed agendo come nuclei di condensazione possono modificare il regime delle precipitazioni. Gli incendi boschivi sono un fattore ecologico molto importante nell’ecosistema del Mediterraneo e gli scenari futuri di un possibile aumento del rischio di incendi potrebbero modificare drasticamente lo scenario vegetazionale.
Questa tesi si propone di integrare le conoscenze sui composti gassosi ed il particolato immesso in atmosfera durante un incendio forestale tramite esperimenti di combustione svolti in laboratorio. È stata quindi ideata e costruita una camera di combustione al fine di studiare le emissioni da combustione di biomassa. La camera di combustione è dotata di una termocoppia, una bilancia ad alta risoluzione, un epiradiometro, due differenti linee di campionamento per campionare i composti organici volatili (VOCs) ed il particolato, un analizzatore portatile per misurare le emissioni di monossido di carbonio e anidride carbonica ed un analizzatore di metano. I composti organici volatili, collezionati all’interno di trappole assorbenti durante le prove di combustione, sono stati determinati tramite analisi al gas-cromatografo accoppiato con uno spettrometro di
9 massa (GC-MS). I composti organici volatili sono inoltre monitorati in tempo reale utilizzando uno spettrometro di massa (PTR-MS).
I primi risultati per testare la validità della camera di combustione sono presentati attraverso il caso studio su foglie disidratate di farnia (Quercus robur). Le prime analisi qualitative sulle emissioni da combustione di foglie di farnia indicano che la CO2 ed il CO sono le specie gassose
principalmente emesse durante, rispettivamente, la fase di flaming e la fase di smoldering. Sono stati identificati molti composti organici volatili aromatici, come il benzene ed il toluene, ed altri composti organici volatili ossigenati come l’acetaldeide ed il metanolo.
Successivamente, le emissioni di specie gassose e di particolato derivanti dalla combustione di tre differenti materiali vegetali (foglie, rametti e lettiera) di due diverse specie arboree, il pino d’Aleppo (Pinus halepensis) e la roverella (Quercus pubescens) sono riportate come caso studio di incendi che ogni anno si verificano nel Mediterraneo, in particolar modo nell’ecosistema murgiano del Parco Nazionale dell’Alta Murgia dove sono stati campionati e di cui ne caratterizzano la vegetazione arborea principale. Sono stati identificati e quantificati 83 composti organici volatili, incluse importanti specie cancerogene che possono arrecare danni alla salute umana. La CO2 ed il
CO si confermano le principali specie gassose emesse, il benzene ed il toluene sono tra i composti organici aromatici dominanti, mentre il metiletilchetone ed il metilvinilchetone sono tra i composti organici ossigenati maggiormente emessi. L’anidride carbonica ed il metano mostrano picchi di emissione durante la fase di flaming, mentre il picco del monossido di carbonio si verifica durante la fase di smoldering. In generale, la combustione di foglie rilascia in atmosfera la maggiore quantità di VOCs rispetto la combustione di rametti e lettiera. Per quanto riguarda le emissioni di composti organici volatili, le maggiori differenze riscontrate tra le due specie arboree riguardano l’emissione di terpenoidi. La combustione di pino d’Aleppo rilascia una grande quantità di monoterpeni come α-pinene, β-pinene, β-cymene, sabinene, Δ3-carene, terpinolene e canfene, i
10 quali sono invece assenti nella combustione di roverella. Differenze significative si rilevano anche nelle caratteristiche della combustione, in particolare i rametti di entrambe le specie mostrano durata della fase di flaming e picco di calore sviluppato durante la combustione significativamente più alti rispetto foglie e lettiera.
Sono stati infine stimati la quantità di carbonio totale ed il particolato emessi durante la combustione di biomassa.
I dati presentati in questa tesi mettono in luce i numerosi vantaggi offerti dall’uso di una camera di combustione per valutare in modo approfondito come le differenti tipologie di biomassa possono influire sugli incendi e sul profilo delle specie emesse durante essi. Questi risultati descrivono in dettaglio le differenti fasi del processo di combustione e forniscono i fattori di emissione di molte specie gassose emesse che potranno essere utilizzati per lo sviluppo di modelli previsionali.
11
Index
List of Figures ... 14
1 An overview on biosphere-atmosphere gas exchange ... 18
2 Biogenic Volatile Organic Compounds (BVOCs) ... 19
2.1 Volatile isoprenoids ... 19
2.1.1 Monoterpenes and sesquterpenes ... 20
2.1.2 Isoprene ... 20
2.2 Oxygenated volatile compounds ... 22
2.3 The BVOCs emissions and their role in the atmosphere ... 23
2.4 Abiotic factor that influence the BVOC emission ... 24
2.4.1 Effect of temperature ... 26
2.4.2 Effect of CO2 ... 26
2.4.3 Effect of drought ... 27
3 Emissions from vegetation fire ... 28
3.1 The combustion processes ... 31
3.2 The impact of vegetation fire on carbon cycle ... 33
4 Novel application of a combustion chamber for experimental assessment of biomass burning emission ... 36
4.1 Introduction ... 36
4.2 Materials and Method ... 38
12
4.2.2 CO and CO2 measurements ... 40
4.2.3 Particulate sampling ... 41
4.2.4 VOC sampling ... 42
4.2.5 The experiment set up and combustion test ... 43
4.2.6 Preliminary Calculations ... 44
4.3 Preliminary results ... 46
4.3.1 CO2 and CO emission ... 46
4.3.2 VOC emission ... 47
4.3.3 Temperature and weight loss ... 52
4.3.4 Particulate emission ... 53
4.4 Discussion ... 54
4.5 Conclusion ... 58
5 Laboratory measurements of gaseous and particulate emission from biomass burning: the contribution of different tree components in a conifer and broadleaf species ... 60
5.1 Introduction ... 60
5.2 Materials and method ... 63
5.2.1 Sources of forest biomass ... 63
5.2.2 The chamber combustion ... 67
5.2.3 CO, CO2 and CH4 measurements ... 68
5.2.4 Particulate sampling ... 68
13
5.2.6 Calculation ... 70
5.2.7 GC-MS calibration ... 71
5.2.8 Statistical analysis ... 75
5.3 Results ... 75
5.3.1 The features of fire ... 76
5.3.2 CO, CO2 and CH4 emissions ... 78
5.3.3 VOCs emissions ... 81
5.3.4 Particulate emissions ... 89
5.4 Discussion ... 90
5.4.1 The combustion process ... 90
5.4.2 The modified combustion efficiency ... 92
5.4.3 CO, CO2, CH4 emissions and the C budget ... 93
5.4.4 Emissions of Aromatic VOCs ... 95
5.4.5 Emissions of Oxygenated VOCs ... 95
5.4.6 Isoprene and monoterpenes emissions ... 96
5.4.7 Particulate matters emissions ... 98
5.5 Conclusion ... 99
6 Implications ... 100
14
List of Figures
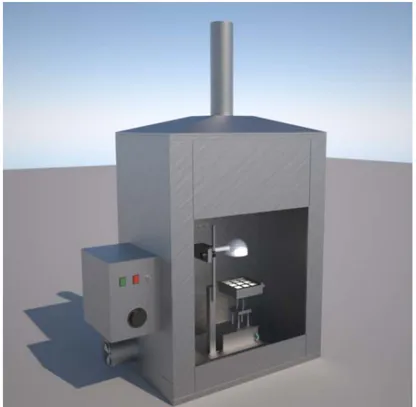
• Fig 1 A tridimensional image of the combustion chamber installed at the Institute of Agro-environmental and Forest Biology of CNR. ... 39
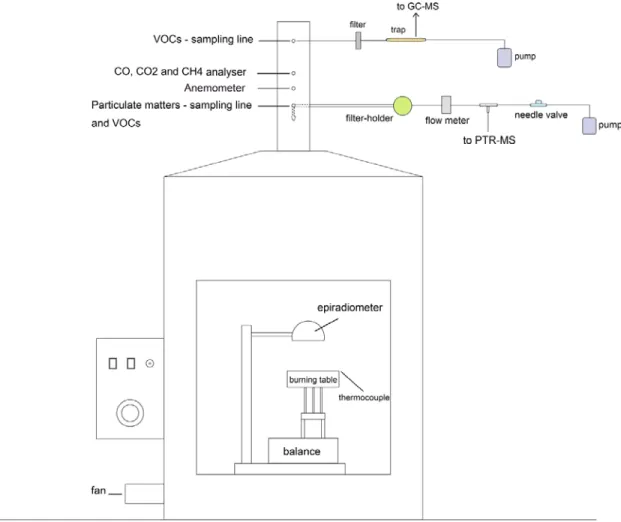
• Fig 2 The combustion chamber for laboratory biomass burning. The main components of the combustion chamber and the sampling lines of particulate matter and gases are indicated. ... 40
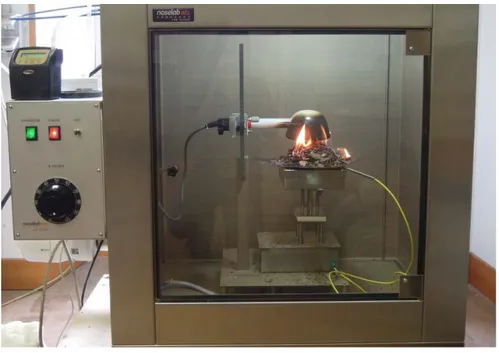
• Fig 3 A picture of a representative experiments during the flaming phase. ... 44
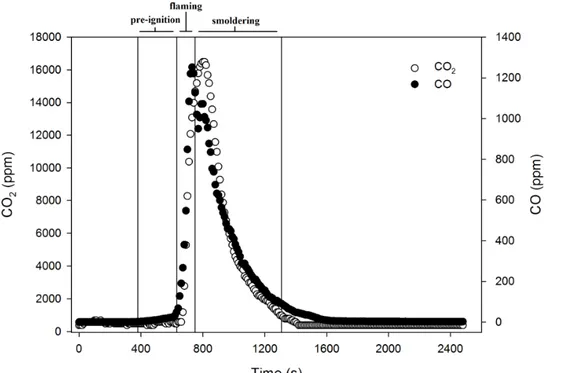
• Fig 4 Emitted CO and CO2 concentrations over time from a burning experiment with leaf
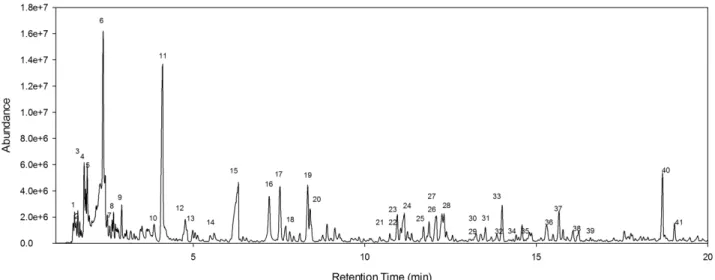
litter of Quercus robur. The vertical lines indicate the beginning of each combustion phase: pre-ignition (380 s), flaming (630 s), smoldering (750 s). The CO emission is indicated by black circles, CO2 emission is indicated by white circles. ... 47 • Fig 5 The chromatogram obtained by submitting to GC-MS analysis a trap sampled during
a burning experiment with leaf litter of Quercus robur. The identified gaseous compounds are listed: 1) 1,3 Cyclopentene; 2) Cyclopentene; 3) 3-Buten 2-one; 4) Pentene 2-methyl; 5) Furan 2-methyl; 6) Benzene; 7) Bibromomethane; 8) 2-Methylhexane; 9) 1,3 Dimethyl cyclopentane; 10) 2,3,3-Trimethyl pentane; 11) Toluene; 12) 5-Hexene 2-one; 13) Octane; 14) 2,4-Hexenedial; 15) Furfural; 16) Ethylbenzene; 17) m+p Xylene; 18) Ethynilbenzene; 19) Styrene; 20) o-Xylene; 21) Benzene, isopropenyl; 22) Benzene, propyl; 23) Benzaldehyde; 24) Benzene 1-ethyl-3-methyl; 25) Benzene 1-ethyl-4-methyl; 26) Benzonitrile; 27) Phenol; 28) Benzene isopropenyl 2-propanol, 1-(2-methoxy-1-methylethoxy); 29) Benzene 1,2,3-trimethyl; 30) Benzene 1-methyl-3-isopropyl; 31) Limonene; 32) Indane; 33) Indene; 34) Benzene, butyl; 35) Benzene, dimethyl-ehtyl; 36)
15 Phenol 4 methyl; 37) Phenol 2-methyl; 38) Benzofuran, 2-methyl; 39)2,6.Dimethyl-2,4,6-Octatriene; 40) Naphtalene; 41) Phenol, 2-methoxy-4-methyl. ... 48
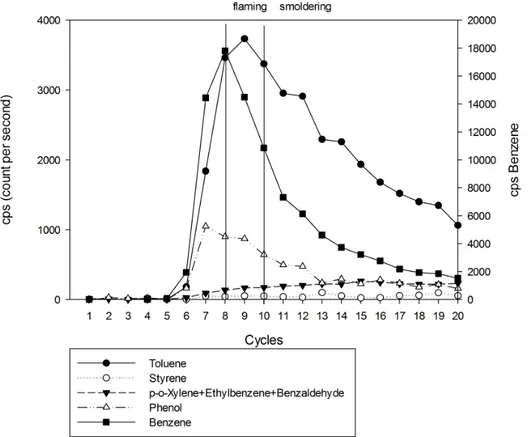
• Fig 6 The on-line monitoring of aromatic VOCs released during a burning experiment with leaf litter of Quercus robur using PTR-MS tecnique. The vertical lines indicate the starting time of combustion phase in correspondence with the measurement cycle on the PTR-MS: flaming (cycle 8), smoldering (cycle 10). ... 49
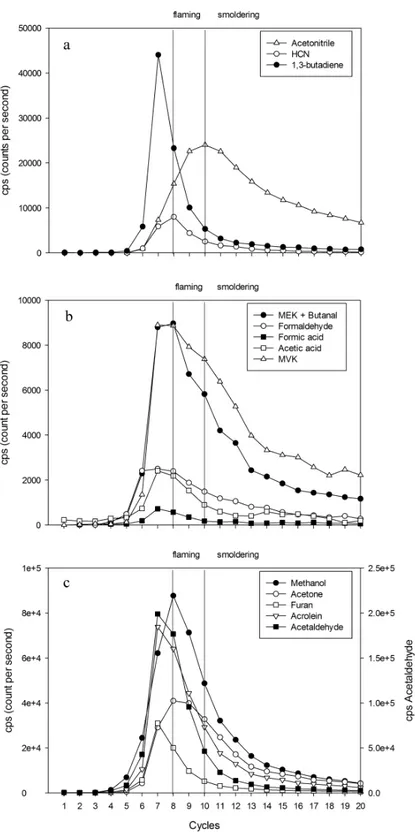
• Fig 7 The on-line monitoring of VOCs released during a burning experiment with leaf litter of Quercus robur using PTR-MS tecnique. The vertical lines indicate the starting time of combustion phase in correspondence with the measurement cycle on the PTR-MS: flaming (cycle 8), smoldering (cycle 10). ... 51
• Fig 8 Inner and smoke temperature over time during a burning experiment with leaf litter of Quercus robur. The vertical lines indicate the starting time of combustion phase: pre-ignition (380 s), flaming (630 s), smoldering (750 s). The red circle indicated the inner temperature, the white circle indicate the temperature measured in the smoke. ... 52
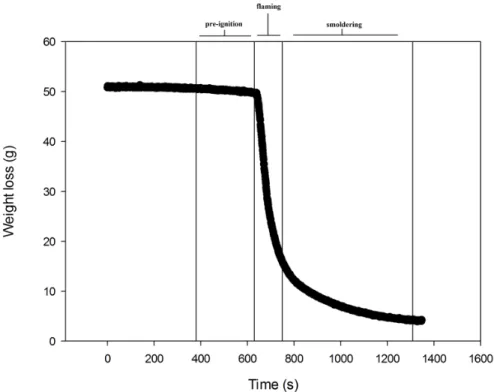
• Fig 9 Weight loss over time during a burning experiment with leaf litter of Quercus robur. The vertical lines indicate the starting time of combustion phase: pre-ignition (380 s), flaming (630 s), smoldering (750 s). ... 53
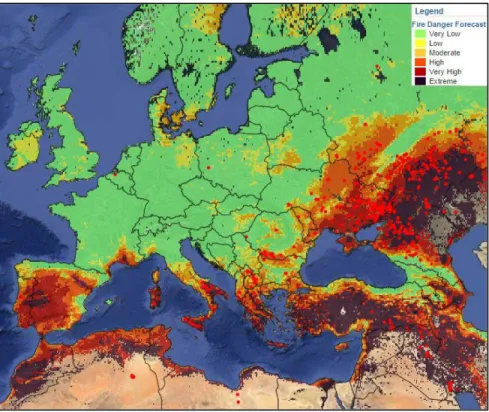
• Fig 10 The map of forecasted fire danger level in Europe. Fire danger is mapped in 6 classes (very low, low, medium, high, very high and extreme). The map is the property of The European Forest Fire Information System (EFFIS) http://forest.jrc.ec.europa.eu/ ... 63
• Fig 11 A representative forests of Pinus halepensis and the maps of distribution of this species in the Mediterranean basin. The map is the property of Department of Environmental Science, Aarhus University (Skjøth et al. 2008). ... 66
16
• Fig 12 A representative sparse woodland of Quercus pubescens and the map of distribution of this species in the Mediterranean basin. The map is the property of Department of
Environmental Science, Aarhus University (Skjøth et al. 2008). ... 67
• Fig 13 A detailed scheme of the new arrangement of the combustion chamber. The sampling lines of particulate matter and gases are indicated. ... 68
• Fig 14 Calibration curve of acetic acid and ethanol for quantitative GC-MS analysis. ... 72
• Fig 15 Calibration curve of acetone and methyl ethyl ketone for quantitative GC-MS analysis. ... 72
• Fig 16 Calibration curve of isoprene and benzene for quantitative GC-MS analysis. ... 73
• Fig 17 Calibration curve of toluene and nonane for quantitative GC-MS analysis. ... 73
• Fig 18 Calibration curve of o-xylene and p-xylene for quantitative GC-MS analysis. ... 74
• Fig 19 Calibration curve of limonene, linalool and α-pinene for quantitative GC-MS analysis. ... 74
• Fig 20 A) Duration of pre-ignition (s), B) durationf of flaming (s) ,C) peak of heat (°C) and D) total heat released (°C s g-1) during the burning of leaves, little branches and litter of Q. pubescens and P. halepensis. ... 77
• Fig 21 Total heat released (°C) during the combustion experiment and the correlation with benzene and toluene emission (mg hg-1) during burning. ... 77
• Fig 22 A representative trend of CO, CO2 and CH4 emission during the three stage of biomass burning (P = pre-ignition, F = flaming, S = smoldering). ... 79
• Fig 23 The modified combustion efficiency (MCE) from burning of leaves, little branches and litter of Q. pubescens and P. halepensis. ... 80
• Fig 24 Correlation between some gaseous compounds (g Kg-1) emitted during burning experiment and MCE. Significant linear regression were indicated (p<0.05). ... 81
17
• Fig 25 Trend in real time of monoterpenes emission analyzed by PTR-MS from the combustion of leaves, little branches and litter of Pinus halepensis . The time of the phases are aligned in order that the beginning of flaming phase (indicated by the vertical line) is equal for all three experiments. The darts indicated the beginning of smoldering phase for each experiment. ... 88
• Fig 26 Trend in real time of oxygenated VOCs (acetaldehyde, methanol and acetone) emission analyzed by PTR-MS from the combustion of leaves of Quercus pubescens during the three phase of biomass burning (P = pre-ignition, F = flaming, S = smoldering). ... 89
• Fig 27 Total particulate matter (g Kg-1) released during the combustion of leaves, little branches and litter of Q. pubescens and P. halepensis. ... 90
18
1 An overview on biosphere-atmosphere gas exchange
The terrestrial biosphere covers approximately 30% of the Earth’s surface, and vegetation plays an important role in the interaction between the land surface and the physical and chemical atmosphere, influencing them through many processes. Energy, water, carbon, and other trace gases are constantly exchanged between the biosphere and the atmosphere behaving as a coupled system. The biosphere and atmosphere are dynamic and reflect constantly these interactions and feedbacks. These exchanges modify mass transport and the thermodynamic structure of the atmosphere, which in turn affect atmospheric circulation, cloud formation, and rainfall, as well as land processes involving the carbon cycle, the hydrologic cycle, and the radiative budget of Earth's surface. In particular the exchange of gases and aerosols between the Earth’s surface and the atmosphere plays a fundamental role in determining air quality, and it is an important driver of climate at both regional and global scales. Molecules of the gases and aerosol can be exchanged between the atmosphere and Earth’s surface by physical processes (e.g. evaporation, volcanic eruption, continental weathering, wind blowing) or biological processes (e.g. evapotranspiration, photosynthesis, bushfires) or anthropogenic processes (e.g. burning fossil fuels, industrial activities).
Regarding the biological processes and thus the biogenic emission, there are physical, biological and chemical processes that affect in turn the emissions. Important physical processes include atmospheric turbulence, molecular diffusion and energy exchange, while important biological and biogeochemical processes include the regulation of biological barriers (stomata and cuticle) that control the diffusion of trace gases but also biological factors as respiration, transpiration, decomposition of plant material by microbes, mineralization, nitrification, denitrification at plant community scale release trace gases in atmosphere.
19
2 Biogenic Volatile Organic Compounds (BVOCs)
Biogenic volatile organic compounds (BVOCs) are emitted by almost all plants. They are involved in a range of ecological functions, including indirect plant defense against insects, pollinator attractor, plant-plant communications, plant-pathogen interactions, reactive oxygen species removal, thermo-tolerance and environmental stress adaptation. Their evolution is complex and it is driven by interaction of plants with biotic and abiotic factors in constantly changing environment, at local and global level (Spinelli et al., 2011). They includes volatile isoprenoids (isoprene, monoterpenes, sesquiterpenes) which are the major fraction of biogenic VOC emissions, followed by oxygenated volatile compounds (alcohols, aldehydes, ketones, ester), alkenes and in a minor part also alkanes and aromatics (e.g. ethane and toluene). Global emission have been estimated at around 800 Tg C y-1 although this estimation is continuously updated based on the latest laboratory results and large-scale monitoring (Fowler et al., 2009)
2.1 Volatile isoprenoids
Volatile isoprenoids have a relevant role in the atmosphere and important functions in plant vs. environment interaction (Fowler et al., 2009). Isoprene and monoterpenes are produced from the precursor dimethylallyl diphosphate (DMAPP) and its isomer isopentenyl diphosphate (IPP), which are synthesized by the deoxyxylulose-5-phosphate (DXP) pathway in the chloroplast and by the mevalonate pathway in the cytoplasm (Lichtenthaler, 1999). Isoprenoids carbon skeletons are composed of five-carbon building blocks that may be assembled in a variety of formations and contain many different modifications.
20 2.1.1 Monoterpenes and sesquterpenes
Monoterpenes and sesquiterpens are active compounds in plant interactions with other organisms (Fowler et al., 2009) as attractors or deterrents for herbivores or carnivores and attractors for pollinators (Gershenzon and Duradeva, 2007). For instance menthol plays a role as mild antimicrobial, citral and geraniol are aroma components, citronellal is an insect repellent, linalool acts as parasitoid wasp attractant, and camphor has an allelopathic function (Paiva, 2000).
Monoterpenes are lipid-soluble molecules and may protect plant membranes from thermal and oxidative stress (Sharkey and Yeh, 2001). Their production is strongly specie-specific (Fowler et al., 2009). Monoterpenes and sesquiterpenes are emitted from specialized storage structures such as resin ducts present in conifers, glandular trichomes in species from Lamiaceae (peppermint) and oil glands in Rutaceae (lemon, orange) and Myrtaceae (eucalypts). Monoterpenes, such as eucalyptol, linalool, camphor, α-pinene, β-pinene, α-terpineol, borneol and many others are the principal components of aromatic plant volatile oil (Dorman and Deans, 2000; Candan et al., 2003).
Many sesquiterpenes are typical fragrances emitted from flowers (Chen et al., 2003) but also from the herbivore-damaged foliage (Vourinen et al., 2004). High levels of sesquiterpenes are produced also after O3 exposure in O3-resistant tobacco (Holopainen, 2004).
2.1.2 Isoprene
Isoprene (C5H8, 2-methyl 1,3-butadiene) is the dominant hydrocarbon that moves from plants to
21 and Shallcross, 2000). The biosynthesis of isoprene requires an high cost in term of energy and carbon but its benefits are numerous as it is a leaf thermoprotector, a flowering hormone (Terry et al., 1995), an antioxidant (Zeidler et al., 1997), and a metabolite overflow to get rid of excess carbon (Logan et al., 2000). Isoprene is not stored within the leaf but it is immediately emitted through the stomata upon its production. For this reason its synthesis is dependent on photosynthesis. Therefore, the factors affecting photosynthesis such as water stress, light and temperature excesses usually influence also isoprene emission. Isoprene emission is very sensitive to temperature, whereas seem to be only marginally effected by moderate water-stress even if drought directly affects stomatal conductance and produce diffusive and biochemical limitations of photosynthesis (Tingey et al., 1981). Isoprene has also an important role thermotolerance during short high-temperature episodes (Singsaas and Sharkey, 1998) probably thanks to the stabilization of membrane lipid bilayer by enhancing the hydrophobic interactions (Gounaris et al., 1984). Isoprene may play also an important role as antioxidant in leaves. It react with ozone and hydroxyl radicals reducing rapidly the damage caused by acute and short (3h, 300nL L-1) or relatively low and long (8h, 100nl L-1) ozone treatments in leaves (Loreto et al., 2001).
22 2.2 Oxygenated volatile compounds
The denomination oxygenated organic compounds includes a wide range of organic molecules as alcohols (R-OH), ketones (R1-CO-R2), aldehydes (R-CHO), ethers (R1-O-R2), esters (R1-COO-R2)
and acids (R-COOH). They are emitted by all plants (Fowler et al., 2009) or are produced in the atmosphere in the course of the oxidation of hydrocarbons (Monk et al., 2009). The emission of these compounds may be induced by developmental and stress factors and they may be large at certain periods of the year and by certain vegetation types.
Methanol, acetaldehyde and other C-6 compounds are often emitted in large quantities, especially in the presence of mechanical wounding or other stress (Loreto et al., 2006). Formaldehyde (HCHO) plays a key role in atmospheric chemistry as it readily photolyses, being a source of the hydroperoxyl radical (HO2) and of ozone (in the presence of NOx). It is formed either as an
intermediate during the oxidation of many VOC or is emitted directly by fossil fuel combustion or biomass burning (Monks et al., 2009). The release of methanol (CH3OH) is associated with cell
wall damage occurring because of wounding (Karl et al., 2001), growing plant tissues (Harley et al., 2007), senescing tissues (Fall, 2003). It is the most abundant non-methane VOC in the atmosphere. Large fluxes of acetaldehyde (CH3CHO) have been observed in conditions of root
anoxia such as under waterlogging stress and under natural condition (Lathiere et al., 2006). Short-lived emissions of acetaldehyde are also observed from darkened leaves (Karl et al., 2002), but also following wounding and ozone stress episodes. Acetone (CH3COCH3) is primarily
emitted by biomass burning and anthropogenic activities. It has been suggested that in the dry conditions of the higher troposphere acetone can act as an important source for OH and peroxy radicals (HOx) (Jaegle et al., 2001).
23 2.3 The BVOCs emissions and their role in the atmosphere
Emissions essentially result from diffusion of BOVCs along a vapore-pressure gradient from cellular compartments of relatively high concentrations to the air surrounding the leaf, where there are relatively low concentrations because of the transport, extreme reactivity and brief lifetime of most BOVCs (Penuelas and Llusia, 2003).
Emission of storing species seems to depend more on temperature, whereas emission of non-storing species seems to depend more on PFD and photosynthetic rate (Penuelas and Llusia, 1999) that alter the production of monoterpenes and so affect their vapor pressure according to a concentration-dependent relationship (Llusia and Penuelas, 2000).
BVOC could protect plants against high temperature, but, in their turn, BVOC emissions increase with warming, and might produce both negative and positive feedback on climate warming through aerosol formation and direct and indirect greenhouse effects.
BVOCs emissions regulate crucial features of atmospheric chemistry and their impact depend on two main factors: its atmospheric lifetime, which is controlled by its rate of reaction with the common atmospheric oxidants, O3, OH and NO3, and the mechanism of its oxidation (Monks et
al., 2009). BVOCs are, in general, extremely reactive and their emission constitute a significant input of precursors for photochemical oxidant being the major reaction partner for OH (Trainer et al., 1993; Simpson et al., 1995). They actually influence the oxidizing potential of the troposphere by affecting the concentration of the main atmospheric oxidant, the hydroxyl radical (Penuelas and Llusia, 2003; Monks et al., 2009). Many studies have also demonstrated that BVOC contribute to the formation of tropospheric ozone (Chameides et al., 1988; Tao et al., 2003; Bell and Ellis, 2004; Hogrefe et al., 2011) in the presence of NOx. The oxidation of isoprene and monoterpenes
24 1992). In turn, the concentration of carbon monoxide in the atmosphere is a major factor in the control of the OH radicals levels in the atmosphere.
The oxidation of the biogenic hydrocarbons is initiated by the highly reactive O3 and the
ubiquitous, transient HO and NO3 radicals.
The atmospheric oxidation of isoprene for instance, is dominated by its reaction with OH during the day and its reaction with NO3 during the night, while ozone plays a minor role day and night.
Methyl vinyl ketone (MVK) and methacrolein have long to been known to account for about 60% of the isoprene reacted (Tuazon and Atkinson, 1990), with formaldehyde as a co-product in each case.
BOVCs, particularly sesquiterpenes and monoterpenes (Monks et al., 2009), also generate large quantities of secondary organic aereosol particles (SOA) by either direct condensation of the BVOC, or the products from the atmospheric oxidation. The organic aereosol particles scatter and absorb radiation, and could affect cloud formation and precipitation by acting as cloud condensation nuclei (Hoffmann et al., 1997; Hartz et al., 2005; Dusek et al., 2006).
Also the oxygenated VOCs can have a significant role in tropospheric chemistry. For example, acetone is believed to play an active role in the formation of peroxyacetyl nitrate and in the formation of OHx radicals (Singh et al., 1995).
2.4 Abiotic factor that influence the BVOC emission
Stored VOCs may be volatilized into the atmosphere by healthy unwounded plants depending on their concentration and physiochemical properties (Niinemets et al., 2004). In addition to the constitutive emission by constitutively emitting species, the emission of volatile compounds are induced in response to stress in practically all plant species, also in those not emitting volatile
25 isoprenoids under optimal growth conditions (Heiden et al., 1999). The induced VOCs are produced only after biotic and abiotic inductions and they have the advantages that they are de novo synthesized only when needed and therefore they optimize carbon usage and do not reduce plant fitness (Dicke, 2000).
Many environmental factors can influence the biogenic volatile organic emission. They include drought, light, soil/litter moisture, humidity, salinity, ozone exposure, wind and turbulence, static pressure fluctuations, nutrient deficiency, chemical, hydraulic, and thermal properties of the soil. Many oxygenated volatile compounds for instance are emitted from leaves subject to various stresses such as wounding (e.g. as a consequence of cutting hay), insect feeding, ozone stress and heat stress. Also the synthesis of volatile isoprenoids is induced in many species in response to biotic (e.g. attack of herbivores and pathogen), and abiotic (e.g. ozone stress, heat stress) stresses (Beachamp et al., 2005; Blande et al., 2005; Loreto et al., 2006).
In constitutively emitting species, the volatile isoprenoids blend differs between induced and constitutive emissions. For instance in non- stressed conditions, the emissions of the monoterpene-emitting species Pinus pinea are dominated by limonene, but the emissions in conditions of high temperature and low water availability are dominated by linalool and ocimene (Staudt et al., 2000). The BVOCs emission represent a large carbon loss and can be up to ~ 10% of that fixed by photosynthesis under stressfull condition.
Land use change, with consequent shifts in species dominance, also have the potential to change BVOC emissions dramatically because these emissions are specie-specific (Lerdau and Slobodkin, 2002).
26 2.4.1 Effect of temperature
As other physiological processes (e.g. photosynthesis) also biogenic VOC emissions are very sensitive to changes in temperature.
Temperature increases the emission rates of most BVOC exponentially by enhancing the enzymatic activities of synthesis (Loreto and Schnitzler, 2010), by raising the BVOC vapor pressure, and by decreasing the resistance of the diffusion pathway (Tingey et al., 1991). For VOC compounds with low air-liquid phase partition coefficient (Henry’s law constant), stomatal closure may constrain emission rates, and, specifically changes in temperature can alter the gas/liquid phase partitioning (as well as the biosynthesis rate of the compound) (Filella et al., 2007). This may affect emission flux rates (Niinemets and Reichstein, 2003) and alter the expected exponential response to temperature. Also, the stress produced by high temperature may generate additional emissions of stress-related volatiles, such as hexenal and hexenols among others (Heiden et al., 2003).
2.4.2 Effect of CO2
The effect of the progressive rise of atmospheric CO2 concentration on the emission rate of
BVOCs has been investigated in a number of studies, and different responses have often been observed. The responses of plant emissions to rising [CO2] can differ among species and among
plants of different ages. The responses can also vary with different experimental lay-outs, times of exposure, and with water and nutrient supply.
For instance, there is a high degree of species-specific variability in the response of isoprene emission to elevated [CO2], although generally a decreased emission is observed both in the
short-27 term and in the long-term experiments. But the responses of isoprene emissions to changes in [CO2] is the effect of drought, which can offset the negative effect of elevated [CO2]. Emissions
from poplar trees grown under elevated [CO2] showed a significant stimulation under drought as
compared to those grown under ambient [CO2]. Only when drought stress became severe, the
emission decreased under elevated [CO2] (Pegoraro et al., 2007).
2.4.3 Effect of drought
It is well know that drought will impact some plant physiological processes. The physiological response to moderate drought include significant reductions in stomatal conductance and photosynthetic rates. Extreme drought reduces these rate to zero and results in senescence (the plant drops its leaves) in some plants. Specific response vary considerably among different species (Guenther, 2001). For example Quercus virginiana is fairly drought resistant and showed no change in isoprene emission despite of the large decrease in photosynthesis after a treatment of drought (Tingey et al., 1981). Sharkey and Loreto (1993) showed even an increment of isoprene emission during the drought stress in Pueraria lobata even if the photosynthesis rates drop to zero. The response to the drought stress could be very differ depending on species considered, however, there is a general consensus (Fuentes et al., 2000; Guenther et al., 2000) that extreme and extended drought will lower the isoprene emission capacity of plant.
The variability of responses to drought depending also on what VOC species are considered because probably emissions of some VOC compounds will be less responsive while other are more responsive. Bertin and Staudt (1996) studied the effect of drought on Quercus ilex and showed that monoterpene emissions were reduced only after severe drought. Monoterpenes are not stored in Q. ilex and their light dependent production and emission pattern are similar to isoprene.
28 The emissions of monoterpenes that have been stored in plant tissue (e.g from the pine trees) are likely to be very unsensitive to drought (Guenther et al., 2001).
The oxygenated VOC emissions showed a strong correlation with stomatal conductance. The lower stomatal conductance observed with drought conditions might lead to large decrease in these emission. Nonetheless it was observed in some cases that some oxygenated VOC emissions appear to be greatly increased by stress and so drought might increase their emissions (Guenther et al., 2001).
3 Emissions from vegetation fire
Biomass burning is widespread in the Earth, it could result from wildfire that naturally trigger in the ecosystem, but more often there are human-induced fires. The use of fire as a tool to manipulate the environment has been instrumental in the human conquest of Earth, the first evidence of the use of fire by early hominids dating back to 1 million to 1.5 million years ago (Schule, 1990). Nowadays biomass burning serves a variety of purpose, such as clearing of forest and brushland for agricultural use, control of pests, insect and weeds, nutrient mobilization, agricultural waste burning and removal of dry savanna vegetation and firewood, prescribed burning for forest management (Crutzen and Andreae, 1990). Vegetation fires release a great amount of trace gases as carbon dioxide (CO2), carbon monoxide (CO), methane (CH4), nitrous
oxide (NO), volatile organic compounds (VOC) as aldehydes, ketones, alcohols and acid organic annually that could affect the atmospheric chemistry and biogeochemical cycles (Crutzen and Andreae, 1990; Lobert et al., 1990; Miranda et al., 1994; Holzinger et al., 2004; Yokelson et al., 2007) at regional scale but also, due to the transportation of gaseous species over large distances, at global scale (Duck et al., 2007; Petzold et al., 2007; Liu et al., 2010; Alves et al., 2011;
29 Warneke et al., 2011). Results of chemical measurement from satellite, space shuttle, aircraft, and research vessels indicate that pyrogenic emissions are transported around the globe (Crutzen and Andrea, 1990). For instance, soot C and other pyrogenic aerosol constituents have been measured during research cruiser over the remote Atlantic and Pacific (Andrea, 1983), high levels of O3 and
CO have also been observed from satellites over the tropical region of Africa and South America, and large areas of surrounding oceans (Fishma and Larsen, 1987; Crutzen and Andrea, 1990). The emissions of CO, CO2, CH4, hydrocarbons and NOx play an important role through the
“greenhouse” effect and the photochemical ozone formation (Hegg et al., 1987; Schultz et al., 1999; Koppmann et al., 2005). In the presence of high concentration of hydrocarbon, CO but also NOx, as will be the case in the smoke plumes, the oxidation of CO and hydrocarbons, that is
favored by the exposition to sunlight, is accompanied by the formation of O3 (Kirchhoff and
Marinho, 1989). Increased concentration of O3 promote high concentrations of OH radicals and
thus increase the overall photochemical activity of air masses affected by biomass burning (Crutzen and Andrea, 1990). Studies in temperate forest regions have linked such levels of O3
pollution to damage to trees and vegetation, which has become widespread in Europe and North America (Prinz, 1988).
Biomass burning acts also as a perturbation factor of oxidant cycles in the troposphere. Many gases, particularly hydrocarbons, are emitted in large quantities from fire but their increase in the atmosphere is prevented by a self-cleaning mechanism through their oxidation promoted by OH. The global decreases in OH, the primary sink for CH4 and CO, could led through a feedback
mechanism to a further increase in CO and CH4. The large amount of NOx emitted from biomass
burning could, at regionally level, counteract this effect because hydrocarbon oxidation in the presence of elevated amounts of NOx creates additional O3 and OH. Moreover, the vegetation fire
30 with and strongly deplete OH. This contribute to enhancement the boundary layer of O3 and OH
concentrations in atmosphere. However, the increase of CO and CH4 emissions due to biomass
burning will lead to decreasing average of OH concentration and thereby to the increase of the many gases that are removed from the atmosphere by reaction with OH.
Biomass burning also exacerbates atmospheric particulate matter loadings (Ward and Hardy, 1991). This in turn leads to significant health implications, particularly for the respirable fraction (fine particles less than 2.5 µm in diameter) and impact on the Earth’s radiative budged because they reflect sunlight back into space. Smoke particles also contain black (elemental) C, which may strongly absorb sunlight and thus cause a heating of the atmosphere and less penetration of solar energy to Earth’s surface. Such an effect has an influence on the heat balance of the lower troposphere resulting in less solar heating of the surface, warming of the atmosphere and more stable meteorological conditions (Crutzen and Andrea, 1990). The submicrometer-sized pyrogenic particles have a great influence on the microphysical properties of clouds and climate. By acting as cloud condensation nuclei (CCN), that are the aerosol particles on which cloud droplets form, fine particles increase the cloud albedo partly counteracting the greenhouse effect (Delmas et al., 1995; Scholes et al., 1996; Reid et al., 2005). The properties of the cloud depend on the number of available CCN: the more CCN, the more droplets that can form and the smaller the droplet size for a given amount of water. Clouds made up of smaller droplets reflect more sunlight back into the space, and, because these clouds are also less likely to produce rain, cloud coverage also may increase. Because clouds are one of the most important controls on the heat balance of Earth, any large-scale modification of cloud properties is likely to have a strong impact on climate (Crutzen and Andrea, 1990). Particularly, low intensity fires produce high particulate matter emissions due to the agglomeration of condensed hydrocarbon and tar material, as well as the contemporary incorporation of ash and fragment of vegetation (Ward and Hardy, 1991). Smoke particles, in
31 addition to affecting the radiative properties of clouds and Earth’s radiation balance, may also disturb the hydrological cycle, with potential repercussion for regional and possibly global climate.
Black carbon (BC) is the most strongly light-absorbing component of particulate matter (PM) and is emitted directly into the atmosphere in the form of fine particles (PM2.5). BC is a major
component of “soot”, a complex light-absorbing mixture that also contains some organic carbon. It is found in smoke as well as in the residues on the ground and it comprises a range of materials from high aromatic to largely elemental or graphitic carbon and can be found in soils, ice and sediments (Kuhlbush and Crutzen, 1995). Since black carbon will not, or only slowly decompose, this carbon will be sequestered from the short- to the long- term carbon pool and will thus represent a sink of biospheric carbon and of atmospheric CO2 (Seiler and Crutzen, 1980). Lignin, a
major constituent of wood, promotes the formation of black carbon much more than other constituents as cellulose (Cadle and Groblicki, 1982).
Biomass burning is also responsible for the direct production of formic and acetic acid that are chemically produced in the plumes (Crutzen and Andrea, 1990). Nitric acid is formed photochemically from the NOx emitted in the fires (Keller et al., 1991). Acid substances in the
atmosphere can be deposited onto plants and soil either by rain and fog (wet deposition) or by the direct removal of aerosol and gases onto surfaces (dry deposition). Acid deposition has been linked to forest damage in Europe and the eastern United States (Bormann, 1985). Acid deposition can act on an ecosystem trough two major pathways: directly through the deposition of acidic aereosol and gases on leaves, or soil acidification.
32 In smoke plumes from fire, volatile organic compounds could be derived from stress of vegetation, distillation phenomena and pyrolysis processes (Greenberg et al., 2006; Niinemets et al., 2010, Evtyugina et al., 2013) of cellulose, hemicelluloses and lignin of which the dry biomass is substantial composed (Van Loo and Koppejan, 2007) but also of lipids, fatty acids, resin acids, sterol, aminoacids, protein and waxes (Rowell et al., 2012; Ciccioli et al., 2014). In particular, the several phases of the combustion process are characterized by distinct emission and emission rate, thus, to describe the emissions of biomass burning, it is necessary to understand the processes involved in the combustion of vegetation.
The ignition of biomass is dependent on both fuel and environmental factors (fuel moisture and type, temperature, relative humidity and wind) (Lobert and Warnatz, 1993). The pre-ignition stage is considered the period of time before the development of flame, when moisture together with some fuel pyrolysis products are released (Patterson and McMahon, 1984). It include different processes as distillation (up to a temperature of 200 °C), endothermic pyrolysis (thermal degradation of compounds between 200° and 280°C), exotermic pyrolysis (between 280° and 500°) that ignite the flaming phase (Greenberg et al., 2006). During the distillation phenomena the biomass become dry by losing free water and the majority of BVOCs stored in liquid pool as formic and acetic acids, methanol are emitted (Greenberg et al., 2006; De Lillis et al., 2009). During the endothermic pyrolysis the most of oxygenated VOCs are released.
Above the temperature of 500 °C, the mixture of gases accumulated in the hot zone over the biomass becomes a flammable fuel trigging the flaming processes. The flaming stage therefore, is the phase of combustion associated with visible flame during which oxidized compounds, such as CO2, CO, NOx together with the substantial amount of pyrogenic VOCs (aromatic, olefinic and
aliphatic organic compounds) are emitted (Lobert et al., 1990; Greenberg et al., 2006). The influence of turbulence (generated by wither wind or shearing effects due to velocity differences
33 of outgassing material within the fuel bed) basically enhances the mixing process of fuel and air (Lobert and Warnatz, 1993).
The following smoldering phase begins after the flame extinction and a considerable amount of smoke is produced. It is characterized by high emission of CO (Ward and Hardy, 1991) and other less oxidized compunds (Lobert and Warnatz, 1993; Andreae and Merlet, 2001).
3.2 The impact of vegetation fire on carbon cycle
Fires represent a loss of stored terrestrial carbon and are responsible for the release of 3800 to 4300 Tg C yr-1 to the atmosphere on a global basis (Andrea, 1991; Andreae and Merlet, 2001; Giglio et al., 2006). According to some authors, global forest fire contributed to about 16% of the global estimate. Other C emissions came from fire in grasslands and savannas (44%), from tropical deforestation and degradation fires (20%), woodland fires (15%), agricultural waste burning (3%) and tropical peat fires (2%) (van der Werf et al. 2010; Bertolin et al., 2015). The sum of CO2 and CO represents more than 90% of the carbon released during the biomass burning
(Ward and Hardy, 1991; Andreae et al., 1998; Reid et al., 2005). Biomass burning causes a prompt release of CO2 but does not necessarily imply a net release of CO2 to the atmosphere, as the C that
is lost to the atmosphere may be returned by subsequent regrowth of vegetation (Crutzen and Andreae, 1990). So, as far as the carbon balance at ecosystem level is concerned, long-term effects of wildfires on atmospheric CO2 are considered small because part of the emitted CO2 is taken up
by the biomass during the vegetation regrowth (Wiedinmyer and Neff, 2007), even though the burning of long rotation biomass (e.g. forest wood) can have some impact on climate because of the slow growth rate of this type of vegetation (Cherubini et al., 2011). Furthermore, during the canopy reconstruction phase, the new foliage that emerges in the months following a fire, is not
34 immediately photosynthetically competent with leaf respiration rates exceeding leaf photosynthesis rate resulting still a source of carbon (Cernusak et al., 2006; Beringer et al., 2015). Short-term effects of vegetation fires can be, instead, important as CO2 emission can match or
even exceed industrial emission at a regional scale (Amiro et al., 2001; Wiedinmyer and Neff, 2007). Before being captured by biomass regrowth, CO2 molecules spend time in the atmosphere
and contribute to global warming (Cherubini et al., 2011).
Estimates of fire emission of CO2 depend on a wide range of factors, including the severity and
type of burns, as well as the spatial heterogeneity of vegetation and fire intensity (van der Werf et al., 2006). A shortening of fire return intervals increases in area burned, and/or increase of fire severity can lead to net emissions of CO2, even on a multi-decadal times scale despite the
equilibrium effect of forest regrowth. Dore et al. (2008) studied the effect of a high-intensity stand-replacing fire in a Ponderosa pine forest which killed all trees reducing the total carbon storage and shifted ecosystem carbon allocation from the forest floor and living biomass to necromass. They showed that ten years after the fire, the burned site was still a source of CO2 to
the atmosphere in all months, due to slow recovery of the gross primary production.
So, due to the high variability of fire emission in both space and time as well as the uncertainty of emission and removal estimates (Chiriacò et al., 2013), the impact of forest fires on the carbon budget is difficult to be assessed at ecosystem level. Van der Werf et al. (2003), using the Tropical Rainfall Measuring Mission (TRMM) satellite which observe the earth between 38°N and 38°S (tropics area) estimated that for the region observed, 2.6 Pg C yr-1 (or 6% of NPP) was lost as direct emissions (vegetation fire and fuelwood combustion) and an extra 1.2 Pg C yr-1 (or 3% of NPP) was lost as respiration from fire-induced mortality. Also these results are highly uncertain because of uncertainties in estimates of burned area and fuel loads.
35 It also important to take into consideration also the effects of post fire, for instance Kim and Tanaka (2003) showed elevated CO2 emission in burned black spruce after at least three years
which was ascribed to the higher soil temperature than that before the burning. This suggest that solar irradiation transfers more easily to the burned stand surface than to the unburned floor due to the lower soil-water content (Richter et al., 2000). The black carbon aerosols that, blackening the soil surface, have strong positive radiative forcing (Ramanathan andand Carmichael, 2008) may also change the surface albedo of burned area thereby increasing solar energy absorption (Govaerts, 2002). Furthermore forest fire significantly decreased soil CO2 fluxes, but the post-fire
condition may stimulate microbial respiration because of higher nutrients and substrates remnant soil after the burning, leading to an increase of CO2 flux (Schlentner and Van Cleve, 1985)
changing the ecosystem from a sink to a source of CO2 (Van Cleve et al., 1983; Kim and Tanaka,
2003; Dore et al., 2008). On the other hand, the formation of black carbon by vegetation fire might significantly reduce the net carbon flux (Kuhlbusch and Crutzen, 1995) for its role of carbon sequestration in a long-term pool.
36
4 Novel application of a combustion chamber for experimental assessment of
biomass burning emission
4.1 Introduction
Laboratory experiments have a great importance on the study of emissions from vegetation fire, providing a deeply insight into the burning process, and are a useful tool to understand the contribution of the various type of vegetation communities to the available fuels for wildland fire. In many studies, the emission has been determined in combustion chambers where vegetation fires are carried out under controlled conditions (Lobert et al., 1990; Kannan et al., 2004; Zhang et al., 2008; Soares Neto et al., 2011; Warneke et al., 2011). Only with this approach it is, in fact, possible to follow in detail the combustion of the different vegetation compartments, such as leaves, bark, trunk, and the accumulated biomass in the soil, involved in forest fires. In addition to this, only experiments performed under controlled conditions allow to follow the progressive release of both reduced and various oxidized forms of carbon, such as CO2, CO, CH4, VOCs and
particulate matter during the different phases of vegetation combustion, separating the contribution coming from pre-ignition, flaming and smoldering. This allows to get detailed information on the gas and particle emission originated from the combustion of plant species and vegetation compartments present in different forest ecosystems that can be useful for landscape management (Moreira et al., 2011). Emissions from fire of biomass produced by human activities as agricultural crop residues (Zhang et al., 2008), cereal waste (Ortiz de Zàrate et al., 2000) and garden (Kannan et al., 2004) were deeply investigated using experimental systems. Several laboratory studies focused on the emission from tropical forest (Yokelson et al., 2008; Neto et al., 2011) and savanna fires (Lobert et al., 1991; Christian et al., 2003). The main disadvantage of
37 laboratory studies is the fact that the simulation of fire is an artificial condition that could not reproduce the complexity of reality.
Experimental data could be integrated with field data conducted in airborne campaign, during open fire, using aircraft and platforms equipped with various type of sampling instruments. This has the advantage to be applied to a real situation but could over- or under-estimate flaming emission due to the type of platforms that are used (Yokelson et al., 2008). Basing on data from laboratory and field experiments, numerous studies have attempted to estimate emissions from
fires in regional, national or even higher scale (Crutzen et al., 1990; Miranda et al., 1994; Scholes
et al., 1996; Cofer et al., 1998; Andreae and Marlet, 2001; de Gouw et al., 2006; Yokelson et al., 2007) but there is still uncertainty and understanding how the emission from biomass burning could impact the atmospheric chemistry is still developing.
In this section, a combustion chamber designed for the determination of gases and particles emitted from vegetation fire is described. Data collected during the combustion of Quercus robur dried leaves are presented to show the potential of this approach.
38 4.2 Materials and Method
4.2.1 Description of the combustion chamber
A 3D image and a schematic diagram of combustion chamber designed at CNR-IBAF are shown in Fig. 1 and 2. The chamber was built by NOSELAB ATS s.r.l., Italy.
The stainless steel chamber has a size of 106x80x50 cm with a diameter of the exhaust chimney of 10 cm. The internal walls of the chambers are coated by Teflon@ to limit the reactivity of the emitted compounds at the chamber surface. The chamber is equipped with a stainless steel burning basket of 16x16 cm, covered by a grid where the biomass to burn is located, and is internally coated by ceramic panels for thermal insulation. A thermocouple located in the basket allows the continuous determination of the temperature during the whole combustion experiment. The basket is placed in a scaffold supported by four cylinders. These cylinders transfer the pressure generated by the biomass weight to a high-resolution balance. This allows the continuous recording of weight losses occurring during vegetation combustion experiments. The scaffold is equipped with a ceramic platform for thermal insulation and for the protection of the loading cell. An epiradiometer, equipped with ceramic coated wires, is used as a source to heat the biomass and ignite the emitted gases. It is placed on an adjustable support to heat in a reproducible way the biomass in the basket. The chamber is continuously flushed with an air flow in order to ensure the constancy in combustion and in the removal of gases and particles from the chamber. Air is delivered to the chamber with an electrical fan placed at the bottom of the chamber. The fan is equipped with a power controller to regulate the air flow.
Data of the internal temperature and sample weight during the combustion experiments are stored in an acquisition system connected to a personal computer through an USB 2.0 connection. The
39 chamber is equipped with the data logger HD 2103.2 (Delta Hom srl, Italy) to store the air flow rate values measured by a hot-wire anemometric probe AP471S1 working in a range of 0.1-40 m/s and -25°C +80°C, with a detection limit of 0.01 m/s and 0.1°C. The probe is equipped with a SICRAM module to provide calibrated data. The data logger can store up to 38,000 samples that can be transferred to a PC via the serial port multi-standard RS232C and USB 2.0. The anemometer is used also to get the temperature of the smoke. This value provides an index of heat dispersion from the fire, when associated with that of the inner temperature.
Fig 1A tridimensional image of the combustion chamber installed at the Institute of Agro-environmental
40
Fig 2The combustion chamber for laboratory biomass burning. The main components of the combustion
chamber and the sampling lines of particulate matter and gases are indicated.
4.2.2 CO and CO2 measurements
A portable analyzer MRU NOVA PLUS (MRU ITALIA srl, Italy) was used for the continuous
measure of CO and CO2. It uses a CO sensor (compensated H2) in the range of 0 – 4.000 parts per
million (ppm) (maximum limit 10.000 ppm), whereas it uses an infrared cell for the measurement
of higher concentration of CO (range of 0-10 %) and CO2 (range of 0-30%). The analyzer was
equipped with a software for the automatic storage of settable times and a gas cooler (Peltier). It contains a pump for the automatic discharge of condensed water. Once calibrated, this unit is
41
inserted inside the exhaust chimney through a hole, and data transferred to a remote display with a wireless connection.
4.2.3 Particulate sampling
An isokinetic sampling line was used for the collection of particulate matter in the exhaust chimney located at the top of the combustion chamber. It consisted of a threaded stainless steel line equipped with a nozzle (6 mm internal diameter) connected to a stainless steel filter holder able to host circular filters with a diameter of 47 mm to retain particles. The nozzle for collecting the fumes was placed at the center of the chimney in order to limit the disturbance of the walls on the fluid moving through. The filter holder was connected to an aspirating pump provided by KNF (Neuberger GmbH, Germany) through a Teflon tube (6 mm inner diameter). To achieve isokinetic sampling of particles, a needle valve was inserted between pump and the filter holder in order to set the flow rate through the sampling system at the same value of the fluid moving inside the exhaust chimney. Both flow rates were measured with a flow meter. The needle valve allowed also to maintain an isokinetic regime through the line when the filter pores got partly clogged by particles. The filter holder can host filters made by different materials, such as cellulose, glass or quartz fibers. Cellulose filters, able to retain particles with an aerodynamic diameters <0.45 µm (Tecnochimica Moderna Srl., Italy) were preferred in our experiments as we wanted to use them for a subsequent morphological and elemental analysis of particles by scanning electron microscope (SEM). Glass and quartz fiber filters were expected to be used when wet analysis of particles or the extraction of organic material was needed. In all cases, filters were dried in a stove at 60 °C for 30 min to remove the atmospheric humidity.
42 4.2.4 VOC sampling
The VOC sampling line consisted of a glass tube inserted perpendicularly to the exhaust chimney.
It was connected through to a Sylcosteel adsorption trap 3 1/2” long with an inner diameter of
1/4”, filled with Tenax TA particles 35-60 mesh in size (Markes International Limited, Llantrisant,
UK). The trap outlet was connected to an aspirating pump ensuring a flow rate of 200 ml min-1
through the enriching system.
VOCs retained on the adsorption traps were thermally desorbed at 275°C for 10 min in a Markes Unity 1 thermal desorption unit (Markes International Limited, Llantrisant, UK) under a flow rate of helium, cryofocused in a cold trap containing a 2 mm diameter x 60 mm long bed of Tenax TA backed up by Carbograph 1TDTM separated and supported at each end by quarz wool and kept at −10°C by a Peltier cell. By rapid heating the cryogenic trap at 300°C, VOCs were injected into a 30 m MS-5HP capillary column with an inner diameter of 0.25mm (J&W Scientific USA, Agilent Technologies, Palo Alto, CA, USA), connected to a gas chromatographic-mass spectrometric unit (GC-MS-MSD 5975C) supplied by the same company. The column temperature was maintained at 40°C for 1 min, and then increased up to 210°C at a rate of 5°C/min. A final temperature of 250°C was reached using a rate of 20°C/min. Helium was used as a carrier gas. One trap for each combustion experiment was collected. The background levels of VOCs in the exhaust chimney were determined by collecting a trap before each combustion experiment.
Online VOC determinations were carried out by using proton-transfer-reaction mass spectrometer (PTR-MS, IONICON, Innsbruck, Austria) equipped with a quadrupole mass filter. The system, which provides high sensitivity, is able to record spectra from m/z 18 to m/z 220 at a rate of 100ms for each m/z seconds. VOCs were sampled by aspirating the air sample from the same line
43 used for the collection of particulate matter. This was carried out by placing a T connection after the filter holder.
4.2.5 The experiment set up and combustion test
The suitability of the chamber to investigate the combustion process of vegetation samples is tested by using about 50 g of leaf litter of Q. robur that was previously desiccated in a stove. The sample was placed on the grid of the burning system and the epiradiometer was placed just above the litter at a distance of 1 cm. Leaf litter was oven dried to standardize measurements during
different experiments. The fan speed was regulated to maintain a constant air flow of 0.7 m s-1
inside the chimney. This air flow provided a good circulation of air within the chamber ensuring a good supply of oxygen for the combustion and avoiding an excessive turbulence which could move the ash from the burning basket.
Once the biomass was placed in the basket and flows adjusted, the gas analyzer and the epiradiometer were both turned on. For safety reasons, the power of the epiradiometer was maintained at 50% in the first two minutes of the experiment, and then increased to 100%. The
concentration values of CO2 and CO were automatically stored every ten seconds, whereas those
of the sensors of the combustion chamber (weight and temperature) were collected every second. As soon as the release of smoke were detected, the sampling of VOCs and particulate matter started. In the sets of experiments reported here VOC sampling was performed for 15 minutes. Particulate matter was sampled for the entire duration of the experiment to quantify the total amount released from the pre ignition phase to the end of the smoldering phase. At the end of the experiment the filter was dried at 60 °C for 30 min in an oven to remove water and to get correct amounts of particulate matter. The analysis of VOCs by PTR-MS was performed in selected ion
44
mode, by selecting the ions of the most important volatile and toxic components known to be emitted by biomass burning. The first five acquisition cycles were used to determine the background levels of VOCs in the air circulating inside the chamber (blank). As soon as the epiradiometer was switched on, 20 acquisition cycles were performed from m/z 19 to m/z 200 to select the specific ions to be monitored. After setting the proper ions, a continuous acquisition was performed until the end of the fire. During the experiment the level of the primary H3O+ ions used
for the ionization was maintained in the range of 6 x 10⁶ counts per seconds. A representative
image of the experiment was provided in Fig. 3.
Fig 3 A picture of a representative experiments during the flaming phase.
45 The chamber was designed in order to get the most relevant combustion parameters. The first one is the combustion efficiency (CE), which is the ratio between the amount of CO2 and that of the
total carbon mass emitted during combustion (Ward et al., 1992): CE = C[CO2]
C[total]
where C[CO2] is the fraction of emitted carbon which is completely oxidized to CO2; C[total]
represent the total amounts of emitted carbon products (CO2, CO, CH4, non-methane
hydrocarbons NMHCs and particulate carbon PC). This parameter is useful to assess the extent to which carbon is oxidized to CO2 during vegetation combustion.
The second parameter is the modified combustion efficiency (MCE) defined as: MCE =[CO[CO2]
2] + [CO]
The MCE requires only the measure of CO2 and CO. It allows to assess the transition between the
flaming and smoldering phases, because the highest efficiency is observed in the flaming phase in which MCE=0.9-1 (Reid et al., 2005).